Publication date: July 23, 2026 · Bitbase Research
For related Bitbase Research on this subject, see Token Allocation and Vesting.
Executive Summary
Token unlocks are the most predictable supply shock in crypto and, paradoxically, among the most consistently mispriced. An unlock is written into a public vesting contract months or years ahead, so the date is never news; yet the consequence routinely is, because knowing when locked tokens become sellable says almost nothing, on its own, about how hard they will land. That gap between "when" and "how hard" is where analysis lives, and it is not a small one: a large-sample study by Keyrock of more than 16,000 unlock events across roughly 40 tokens found that about 90% were followed by negative price pressure, with the weakness typically beginning around 30 days before the date rather than after it [1]. The market front-runs the calendar.
This report builds the analysis in two layers. The first is that an unlock is not a special crypto phenomenon but the direct analog of a well-studied equity event — the expiration of IPO share lock-ups — whose two-decade academic literature finds statistically significant, permanent negative abnormal returns and a lasting jump in trading volume even though the expiration date is public knowledge [3][4][5]. The second layer is mechanical: an unlock that reaches exchanges is a large meta-order that some cohort must work through a finite order book, and its price effect is therefore governed by the market-impact laws that govern any large trade [6][7][8]. On those two foundations we specify a five-factor Sell-Pressure Risk Score — magnitude, absorption, cohort, structure, and timing — and connect each factor to an observable signal, including a worked market-impact estimate and the derivatives-market "tell" that makes the 30-day anticipation window legible.
The stakes are structural, not incidental. Binance Research estimated roughly US$155 billion of tokens scheduled to unlock across 2024–2030 [29], and calculated that tokens launched in 2024 — carrying an average market-cap-to-FDV ratio of just 12.3% — would need on the order of US$80 billion of new demand simply to hold their prices against scheduled supply [2]. The subsequent cohort bore this out: of 118 tokens that launched in 2025, 84.7% later traded below their listing valuation, with a median drawdown of 71.1% on a fully-diluted basis [2][21]. Against that backdrop the score's purpose is not to forecast price but to rank a crowded unlock calendar into the few events that are genuine structural supply and the many that are noise. Everything here is educational analysis, not investment advice.
Part 1 · The anatomy of an unlock: stock, flow, and the overhang
Precision about what an unlock changes is the foundation for everything else. An unlock creates no tokens; total supply is fixed and always counted [13]. What changes is the float — the fraction of supply that can actually be sold. A project can carry a reassuring market capitalization while most of its tokens sit locked, so that tradeable supply is a thin slice of the headline and the fully diluted valuation (FDV) that looked cheap is defensible only if demand grows into a release schedule that is public, mechanical, and indifferent to price [2].
The structural condition that makes unlocks matter is the low-float/high-FDV design that dominated the 2023–2025 launch cycle, in which circulating float at listing was often just 5–15% of total supply [2][28]. Under that design the locked overhang dwarfs the live float. Binance Research put the average market-cap-to-FDV ratio of 2024 launches at 12.3%, implying that roughly seven-eighths of eventual supply still sat behind the float, and estimated ~US$80 billion of fresh demand would be required merely to absorb the scheduled 2024-cohort unlocks at unchanged prices [2]. Industry unlock trackers such as Tokenomist and CoinMarketCap exist precisely to make this forward supply legible event by event [12][13][25].
That arithmetic forces a distinction weaker analyses collapse: there are two magnitudes, not one. The stock magnitude is the size of a single event as a percentage of circulating float — the discrete shock. The flow magnitude is the annualized emission the schedule implies — the persistent overhang that can cap a token for quarters even when no single event looks large. A token with 100 million circulating against 1.9 billion total, vesting the 1.8-billion remainder linearly over four years, emits roughly 27% of current float every year as a structural drip entirely separate from any cliff [2][26]. A token can be low-stock and high-flow (a relentless linear schedule) or low-flow and high-stock (a dormant allocation hitting one cliff), and reading only one number is the most common first error.
Part 2 · The lesson from equity lock-ups
Crypto did not invent the unlock; it re-created the IPO share lock-up, and the equity literature on lock-up expiration is the most rigorous evidence base available for reasoning about token unlocks. In a conventional IPO, insiders and pre-IPO investors agree not to sell for a fixed period — classically 180 days — after which their shares become freely tradeable. The expiration is a scheduled, publicly known increase in float: structurally identical to a token unlock [3][4].
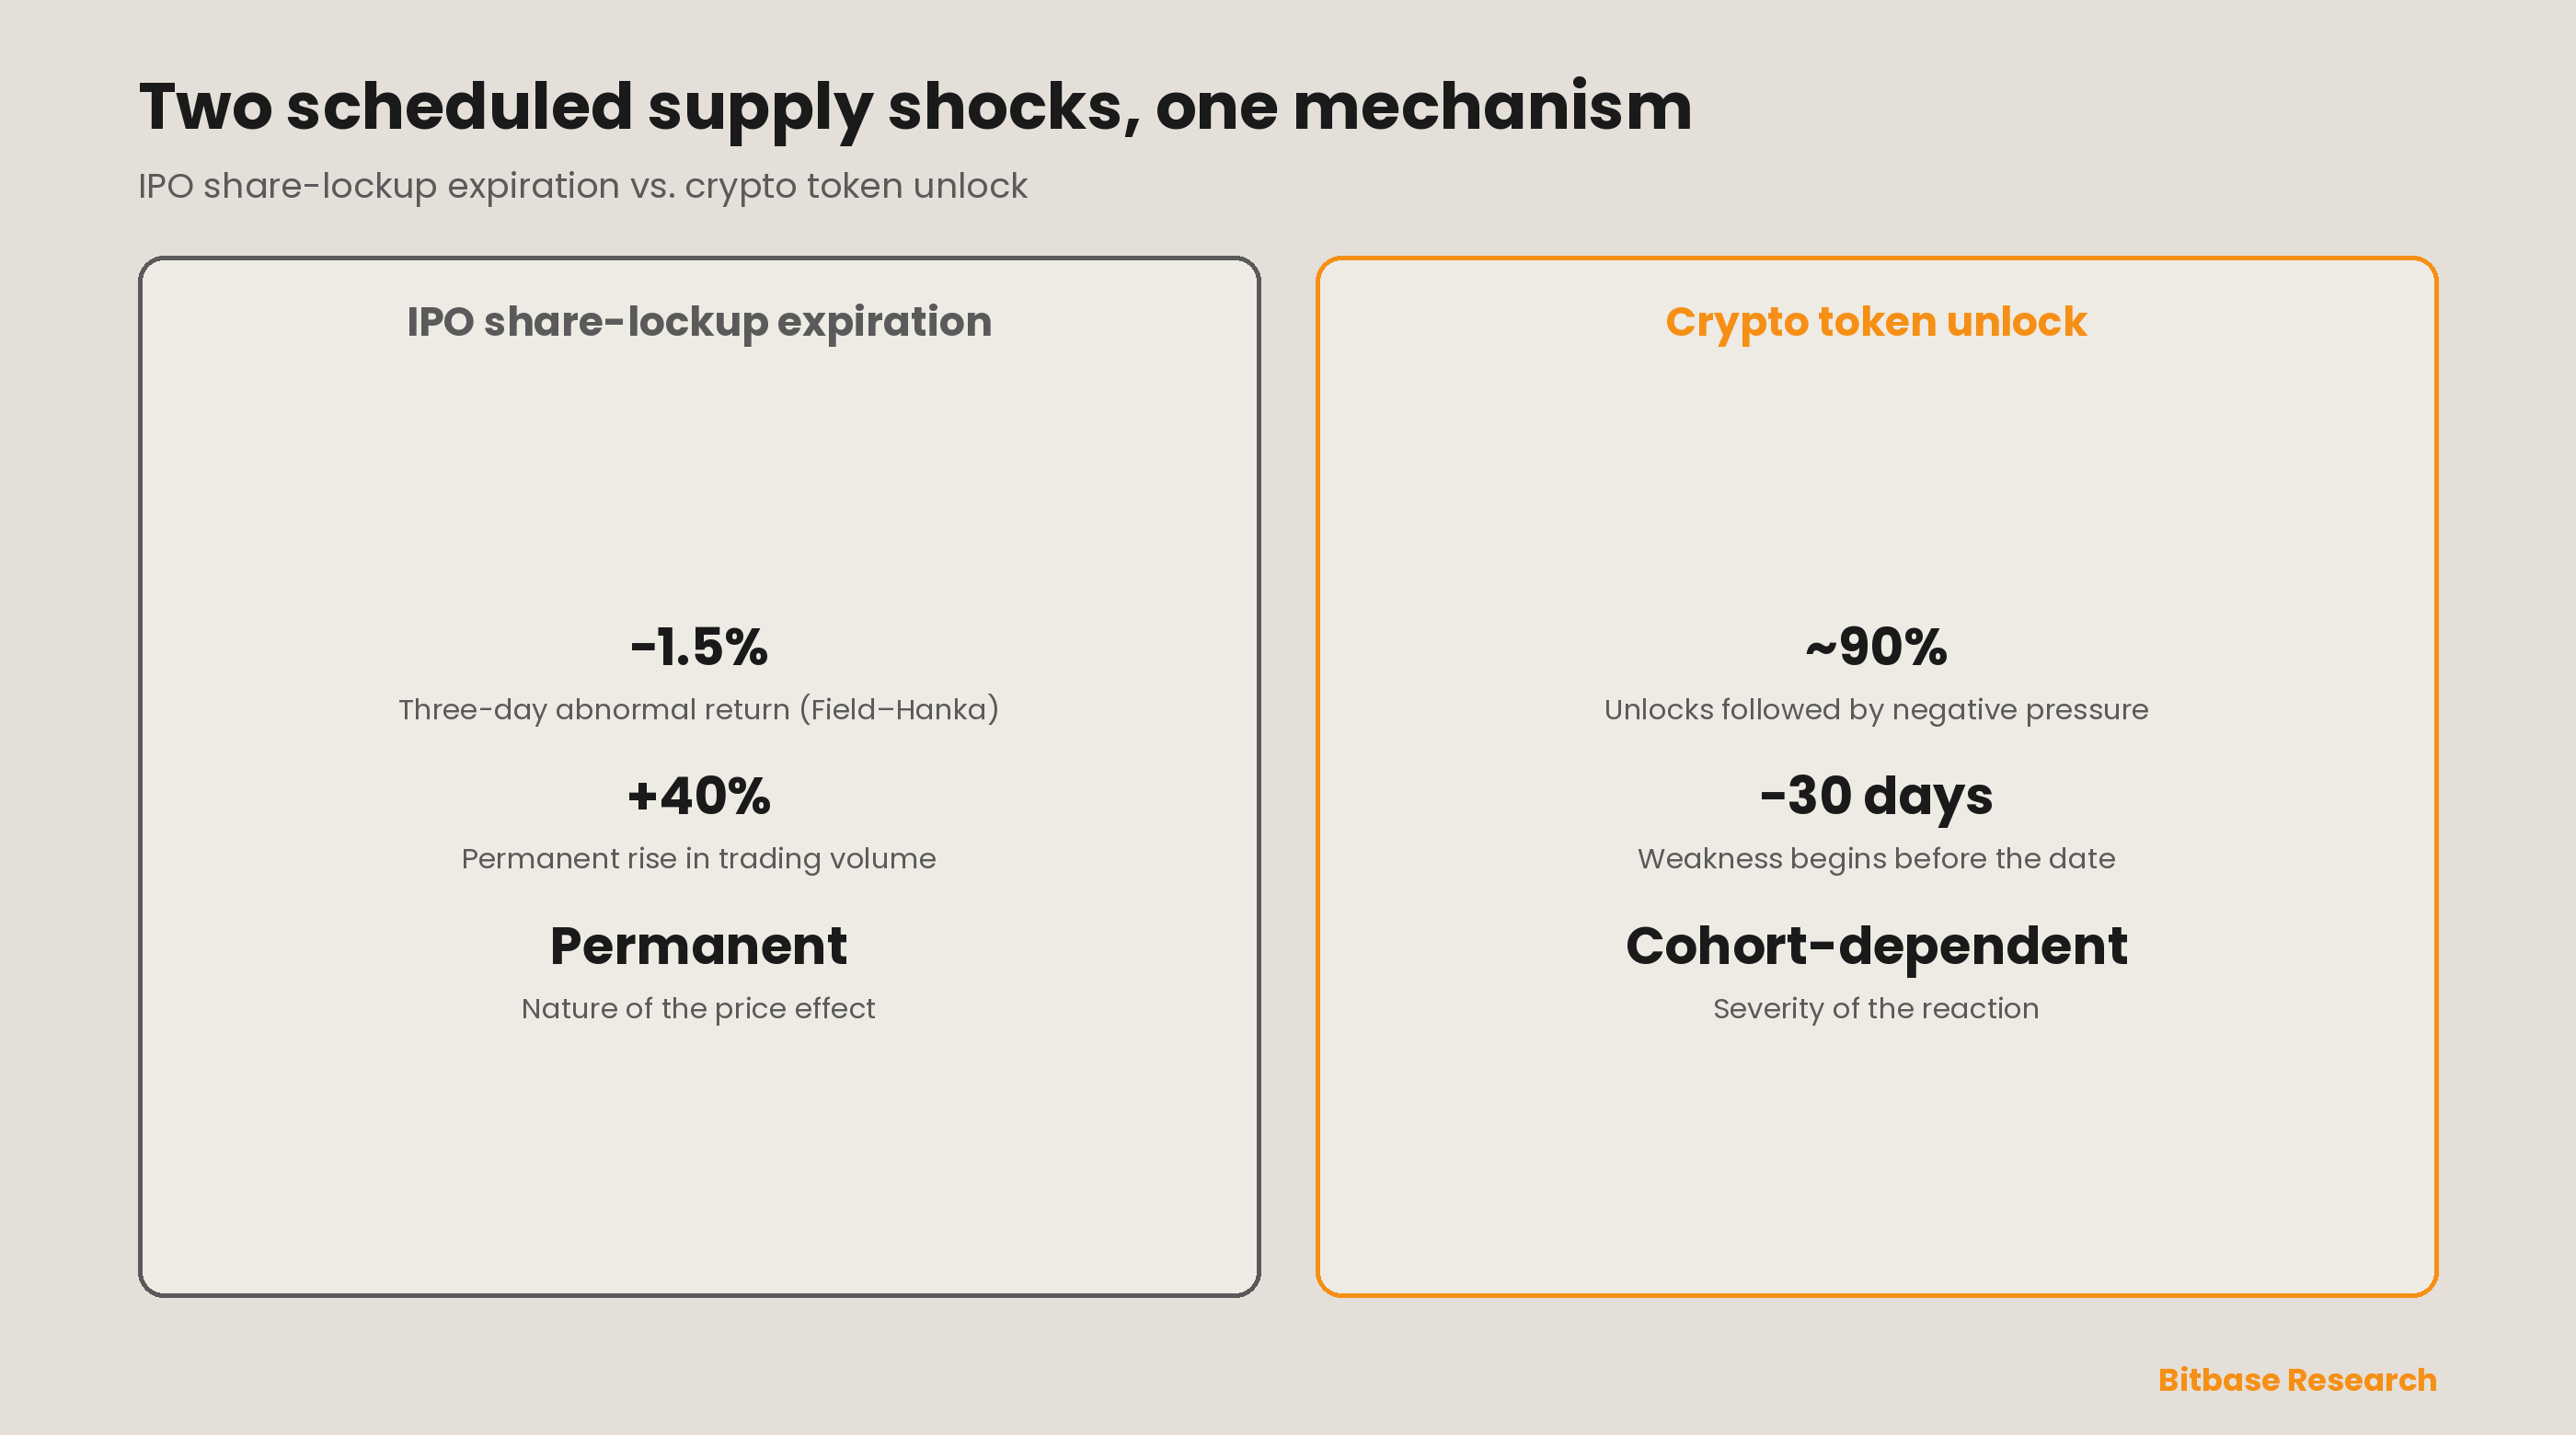
The empirical findings are strikingly consistent and directly transferable. Field and Hanka, studying a large sample of U.S. IPOs, documented a statistically significant three-day abnormal return of about −1.5% around lock-up expiration, accompanied by a permanent ~40% increase in average trading volume [3]. Ofek and Richardson, and subsequent work, found the price effect to be permanent rather than transitory — consistent with a lasting rightward shift in supply against a downward-sloping demand curve, not a temporary liquidity dip [4]. The pattern replicates internationally, including in European and Malaysian markets, where expiration is likewise the first exit opportunity for insiders and is likewise accompanied by a volume surge [5].
Two implications carry straight into crypto. First, the fact that a publicly known date produces a significant, permanent price move is itself evidence against strong-form market efficiency and in favour of downward-sloping demand curves for individual securities [4] — which is exactly why "the unlock is priced in" is a claim that must be earned, not assumed. Second, the magnitude ordering matches what crypto data later showed: the effect is driven by the arrival of insider supply that was previously locked, and it is larger where the newly unlockable float is large relative to what already trades. The token-unlock framework that follows is, in effect, the IPO-lock-up result re-derived for a market with 24/7 trading, thinner order books, and a richer derivatives overlay.
Part 3 · The crypto empirical baseline — and what it hides
The crypto evidence sharpens the equity analog. Across Keyrock's 16,000-plus event sample, roughly 90% of unlocks were associated with negative price pressure, and — the detail most people miss — the weakness usually began up to 30 days before the date, as holders and traders front-ran the release by selling or, more often, hedging [1]. An early academic study of 52 unlock events on Binance reached a compatible conclusion through a "supply-shock" lens, noting that every one of the 14 events falling within a 60-day window around the one-year post-listing anniversary showed negative returns, while carefully flagging that the pattern was identified post-hoc and needs out-of-sample replication [11]. The market-level cohort data is blunter still: of 118 tokens launched in 2025, 84.7% later traded below their listing valuation, with a median fully-diluted drawdown of 71.1% [2][21].
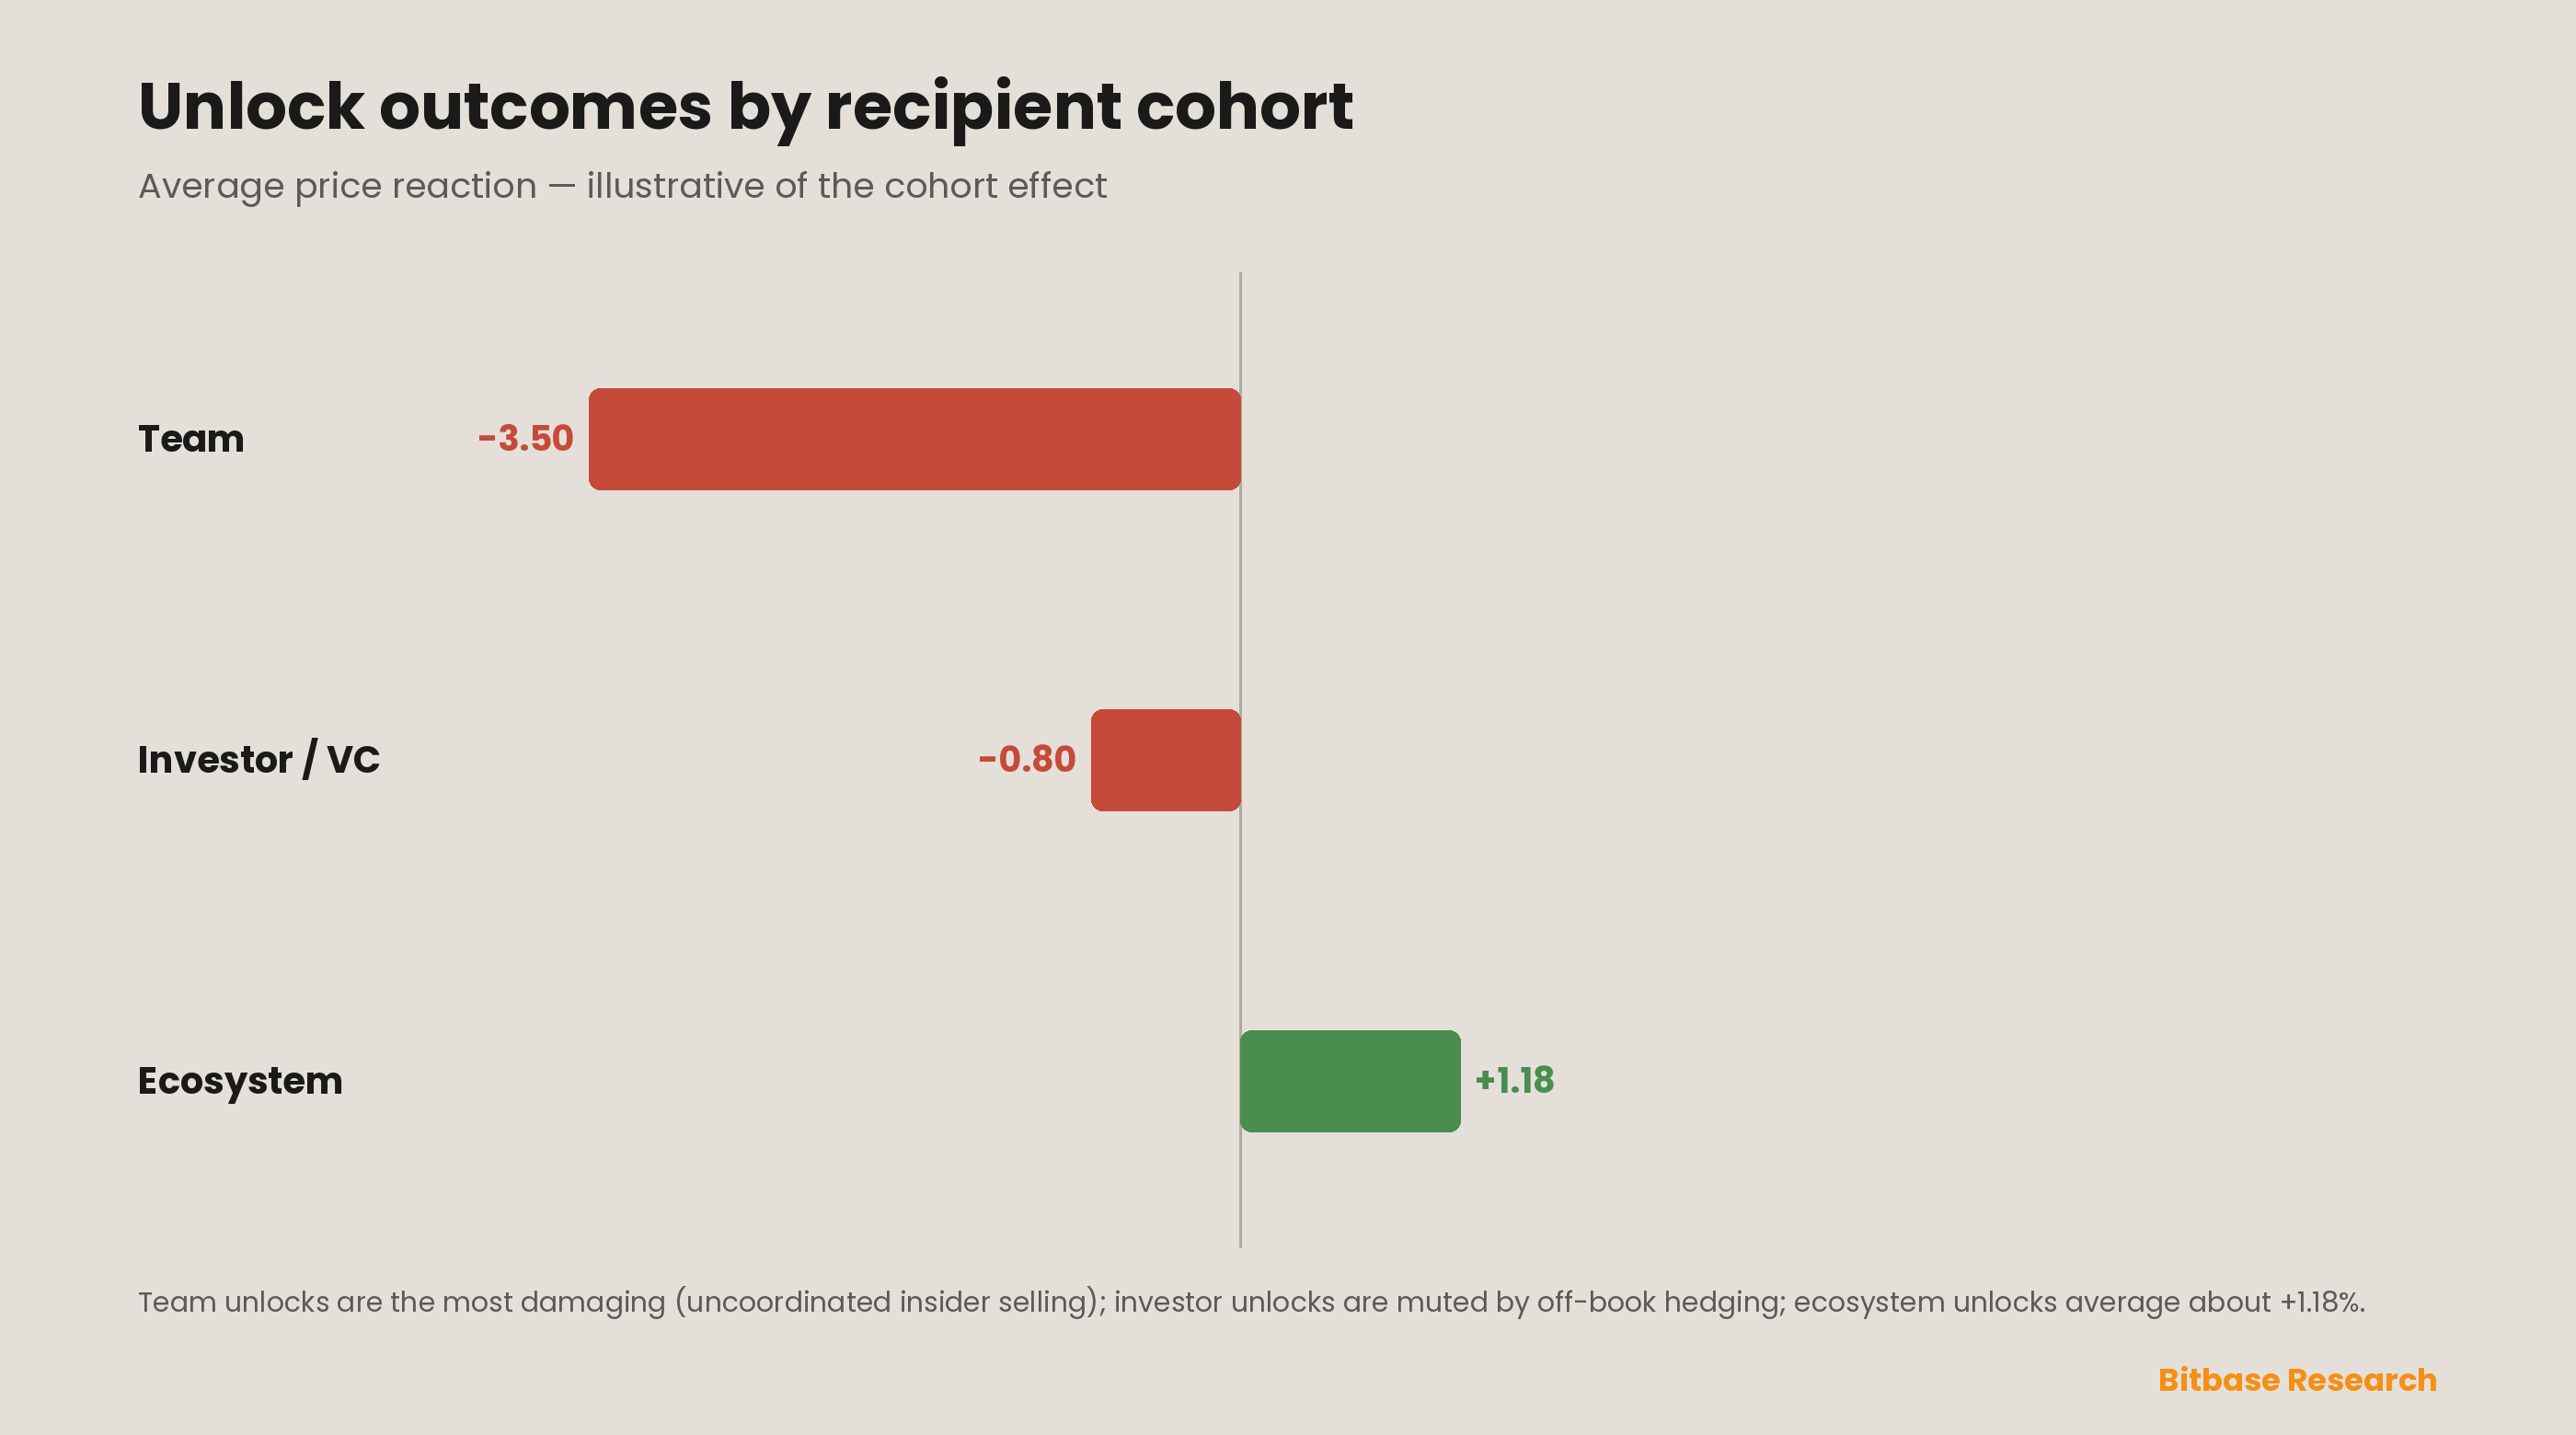
Two findings reshape how the calendar should be read. The damage arrives early: because much of the adjustment happens before the date, an unlock is an anticipation event first and a flow event second, and the post-date tape mostly reveals how much released supply is genuinely reaching exchanges [1]. The recipient decides the severity: team unlocks are the most damaging category, because teams rarely coordinate selling and individual members liquidate into the same window; investor and venture unlocks are, surprisingly, not the primary drivers of decline, because these holders more often hedge and transact through over-the-counter desks and options that keep supply off the public book; and ecosystem unlocks frequently break positive, averaging around +1.18%, because they fund liquidity, grants and incentives rather than personal exits [1]. Concrete 2024 cases illustrate the anticipation pattern cleanly: ARB's release of roughly 1.1 billion tokens to investors and the team drove a sharp drop around the date, while OP's repeated investor and contributor unlocks each softened price before the event and eased after it where fundamentals held [11][18].
A top-tier reading interrogates its own evidence. Four caveats temper the 90% base rate. Endogeneity: schedules are not random — weaker projects front-load insider allocations, so cohort and outcome are partly confounded with quality [11]. Market beta: unlocks cluster in time, and a wave landing in a risk-off tape "confirms" the base rate for reasons unrelated to the unlocks [2]. Survivorship: samples skew toward tokens that survived long enough to unlock on schedule [1]. Reflexivity: because the base rate is now widely known and tooled [12][13][14], it is partially self-defeating — the more efficiently the market anticipates unlocks, the more the average impact migrates from the date into the pre-window and, for the most-watched names, toward zero. The base rate is a prior to be updated, not a verdict to be applied.
Part 4 · The physics of absorption: a market-impact treatment
Beneath the behavioural story is a mechanical one, and it is where most unlock commentary stops short. An unlock that reaches exchanges is a large meta-order sellers must work through a finite book, so its price effect is the market impact of that meta-order — one of the most heavily studied objects in quantitative finance. Kyle's canonical model predicts linear impact for small orders, I(Q) ≈ λ·Q, with the slope λ ("Kyle's lambda") measuring illiquidity [6]. But for the large sizes an unlock represents, linear response fails: impact follows a concave square-root law, I(Q) ≈ Y · σ_D · (Q / V_D)^δ, where σ_D is daily volatility, V_D is daily volume, Y is a constant of order one, and the exponent δ is close to 0.5 — a form first drawn from Loeb's and Torre's empirics and since confirmed across equities, FX, futures, credit and crypto [8][9][22][23]. The argument that matters for unlocks is the ratio Q / V_D, order size against daily volume — precisely the "unlock ÷ average daily volume" absorption term, now derived rather than asserted.
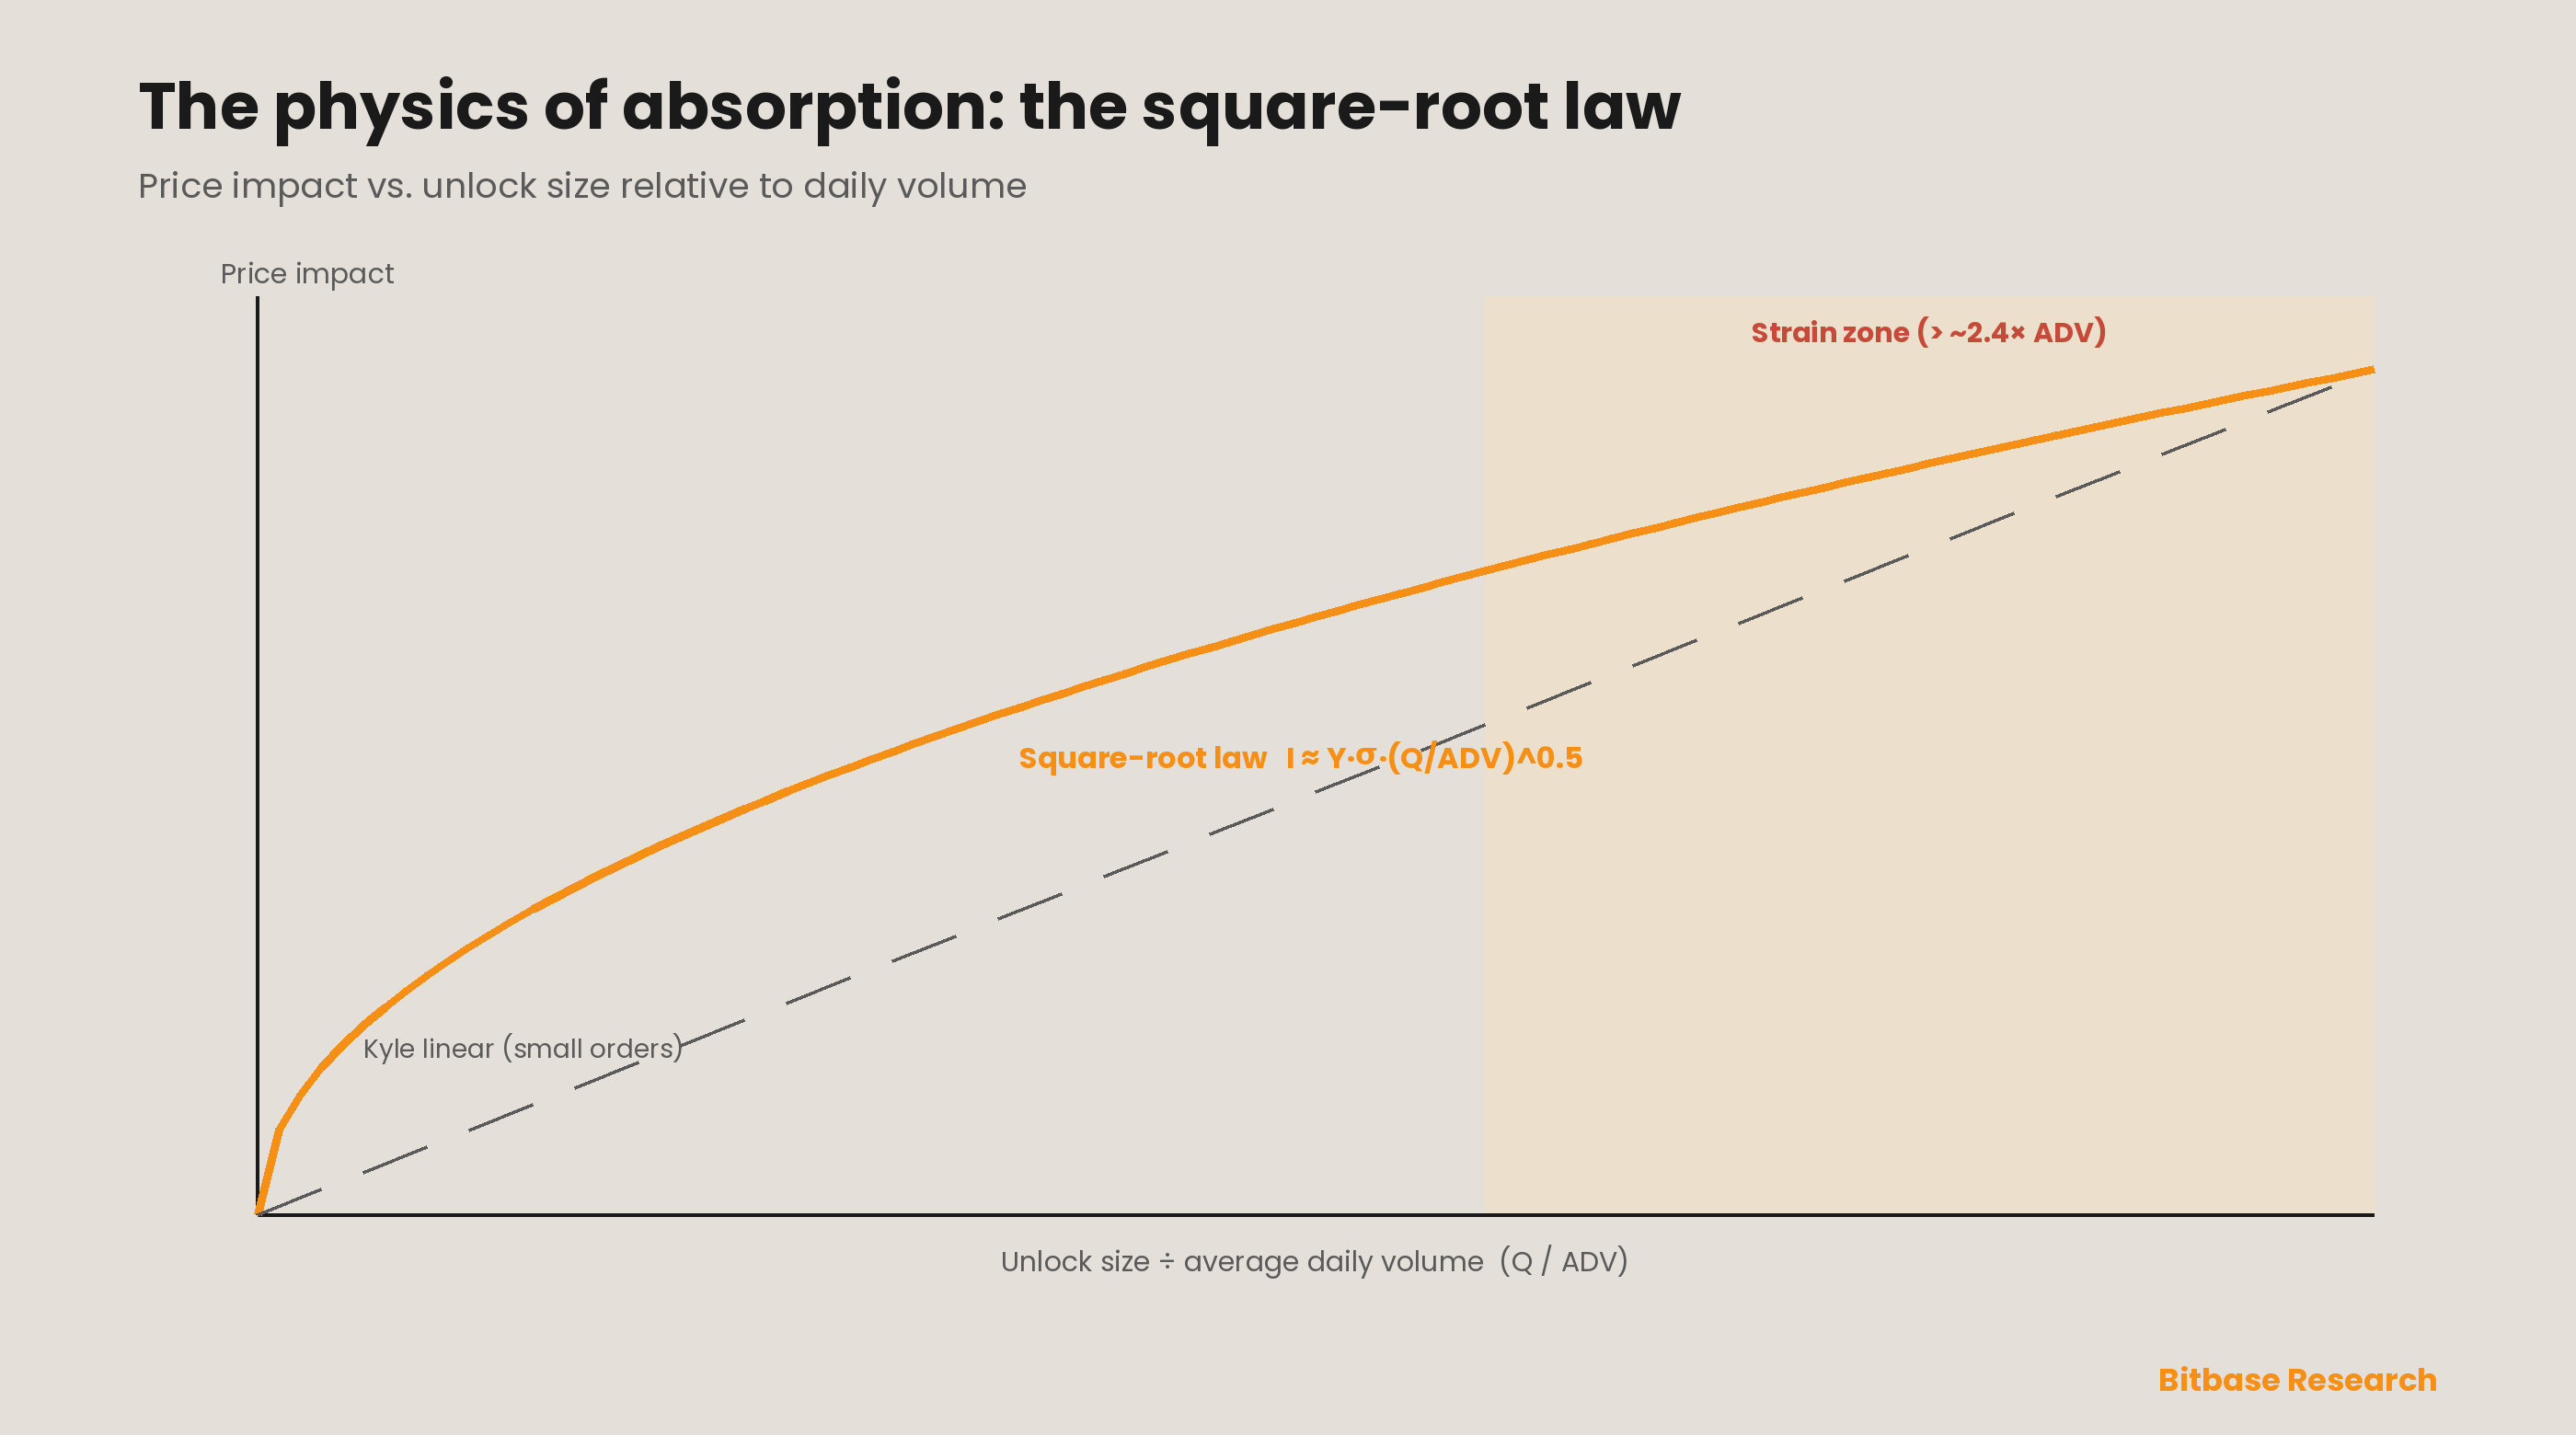
Two consequences follow. First, concavity makes absorption nonlinear in the right way: a modest unlock is cheap to digest, but past a threshold the marginal token becomes very expensive to sell, which is why the empirically observed strain point — around 2.4× average daily volume — is not arbitrary but the region where (Q/V_D) pushes the impact function into its punishing range [18]. Concretely, for a token with ~4% daily volatility, an unlock equal to one day's volume implies a temporary impact of order Y·σ·(1)^0.5, while nine days' volume implies roughly √9 = 3× that impact before any behavioural selling — supply alone, mechanically [8]. This is why a 2% float unlock into a thin book can matter more than a 5% unlock into a deep one: the same Q meets a different V_D. Second, the Almgren–Chriss decomposition of impact into a temporary component (the cost of demanding liquidity, which reverts) and a permanent component (a lasting, information-bearing shift) explains why release structure is first-order [7]. Optimal-execution theory says a large meta-order should be sliced across time to minimise temporary impact — exactly what a linear vesting schedule does mechanically and what a cliff cannot. A cliff forces the whole tranche to demand liquidity at once, maximising temporary impact; a linear schedule converts one shock into a long series of small, individually-absorbable orders that collectively grind. Market-microstructure invariance work links these regimes into a single framework in which bet size, volatility and volume jointly set impact, the power-law impact of large institutional trades being well documented [10][24].
Part 5 · The Sell-Pressure Risk Score
The equity analog gives the prior, the impact law gives the mechanics, and the cohort split gives the behavioural weighting. The score combines them, reading every unlock along five dimensions — each mapped where possible to an observable, and read together because the factors interact multiplicatively, not additively.
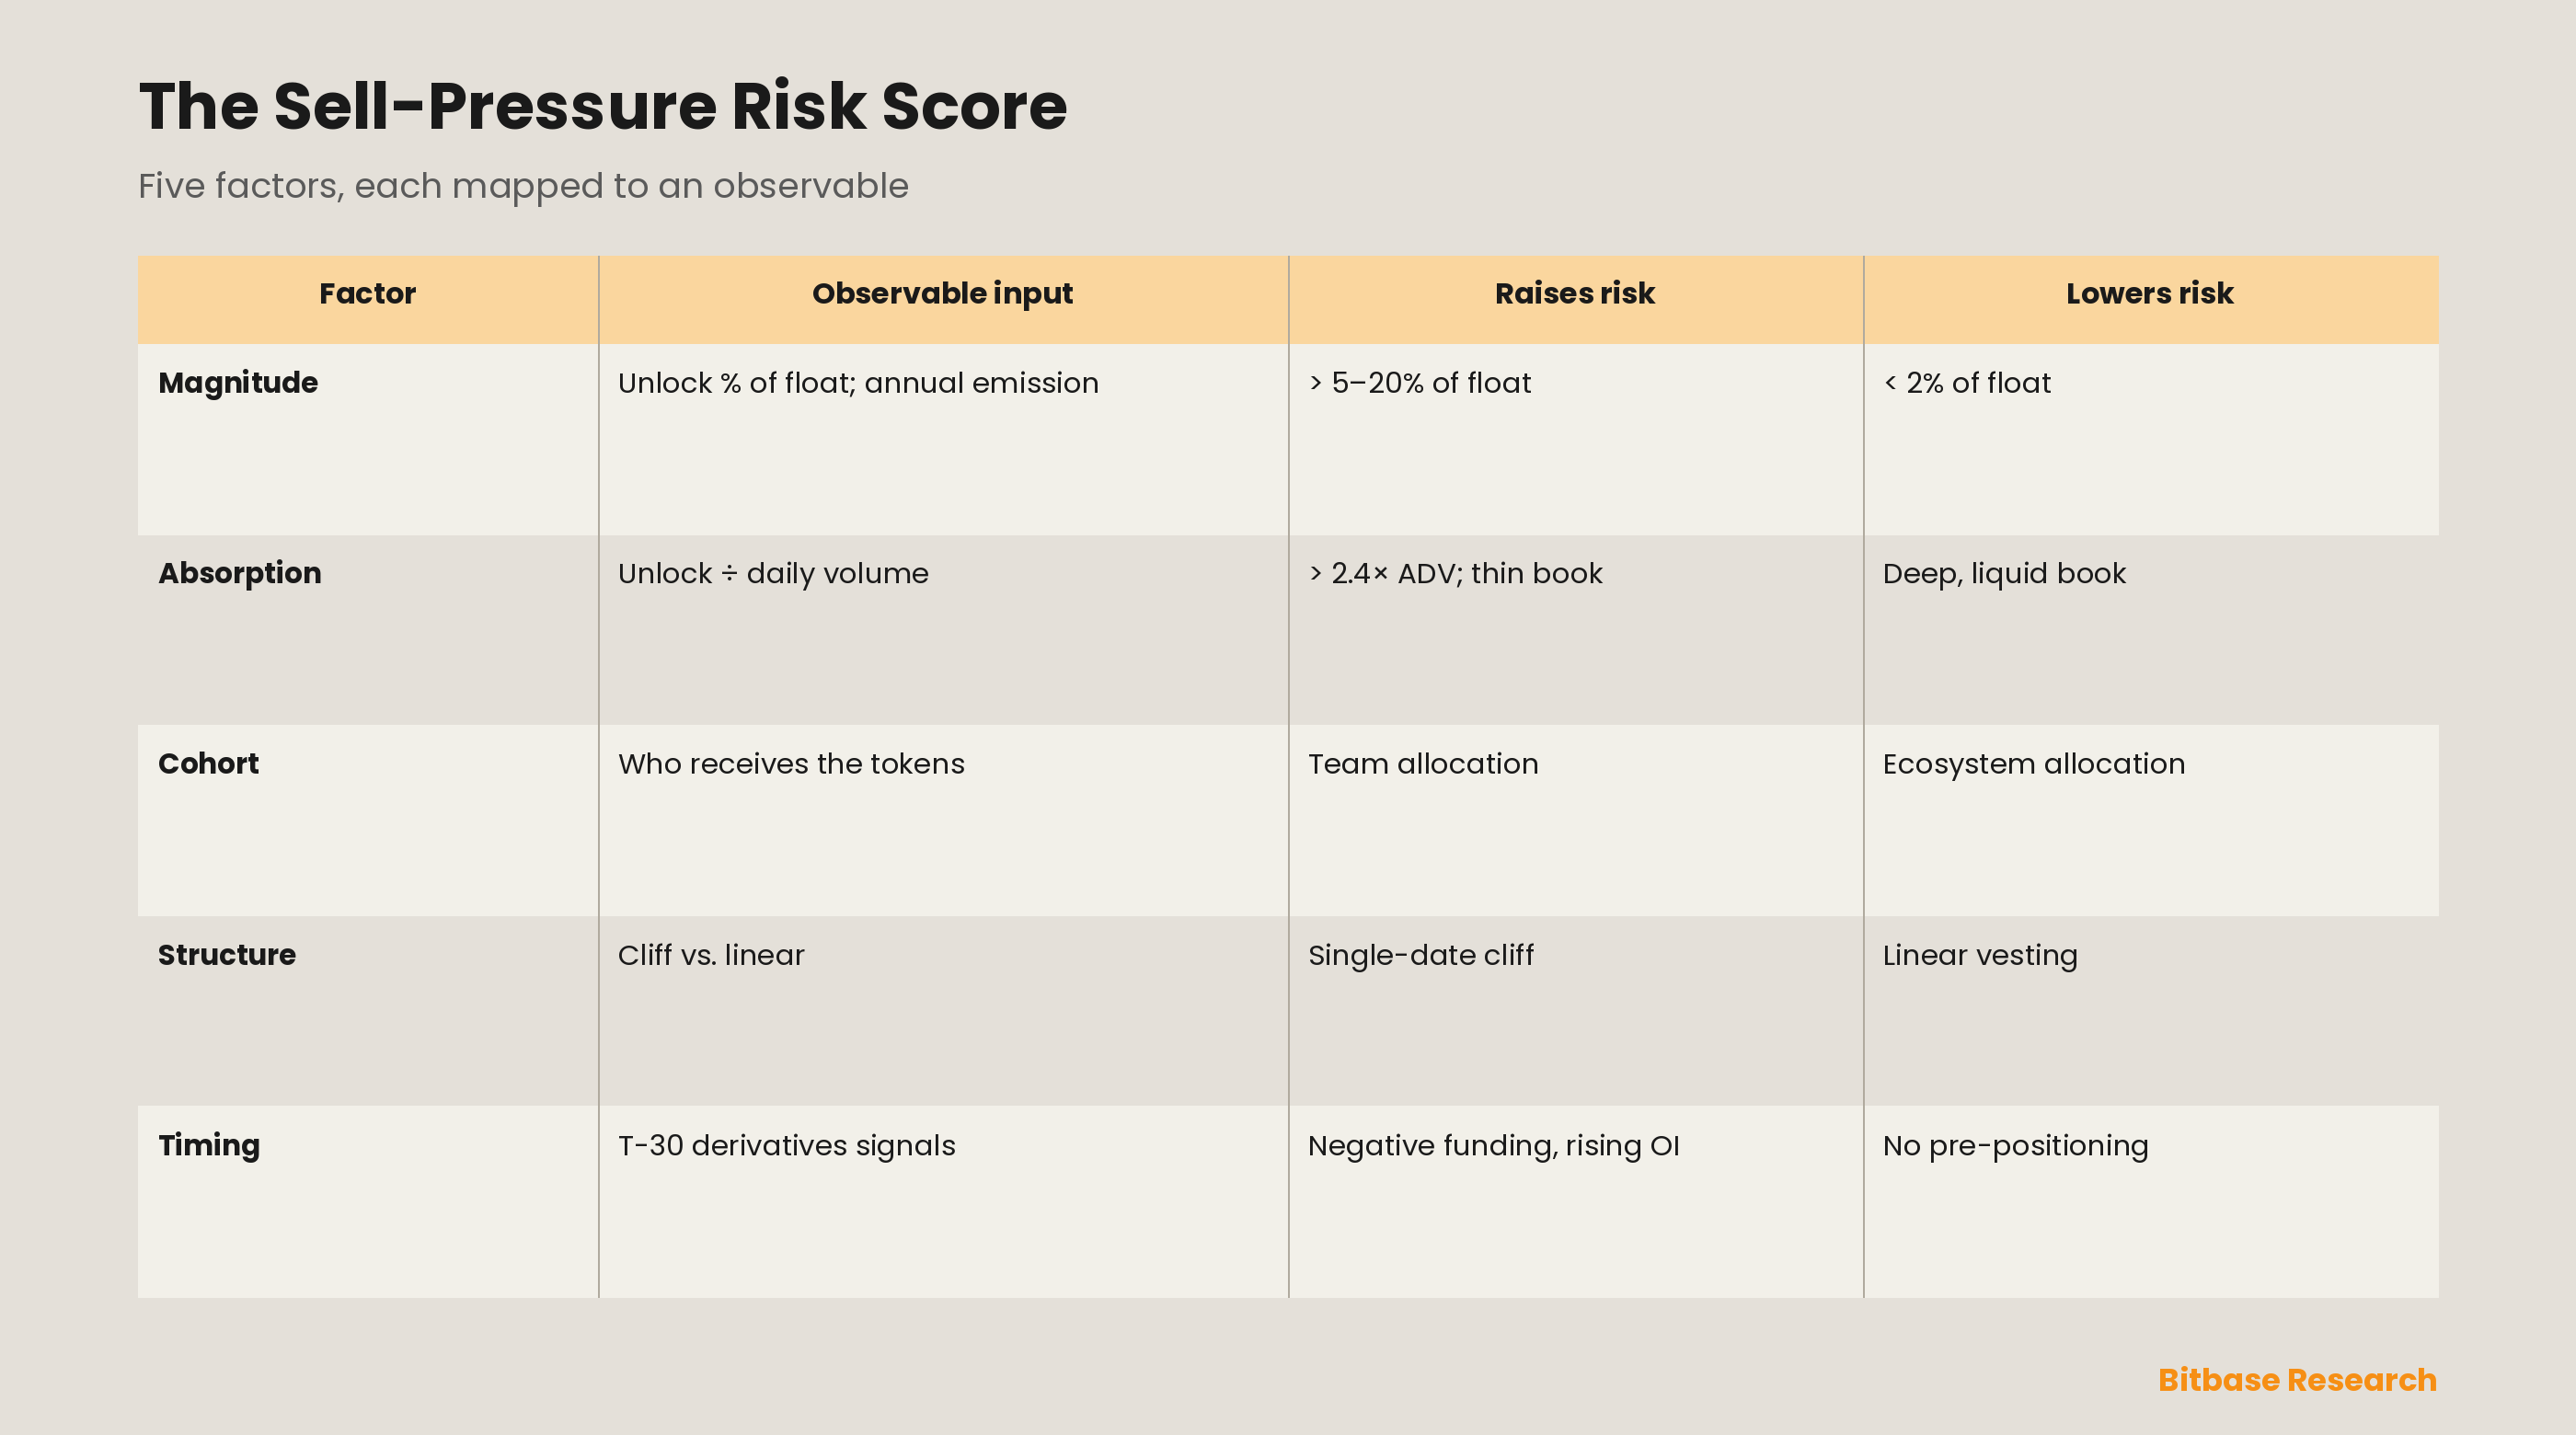
Magnitude (stock and flow). Size relative to what already trades, not the dollar headline. As a stock, releases below ~2% of float are usually minor, above ~5% create significant pressure, and above ~20% enter a severe-dilution zone where sharp reactions are close to a rule — the 2026 PUMP and CONX cliffs crossed that line [18][19]. As a flow, annualized emission relative to float measures the persistent overhang, the metric Binance Research used to size the ~US$80 billion demand gap [2].
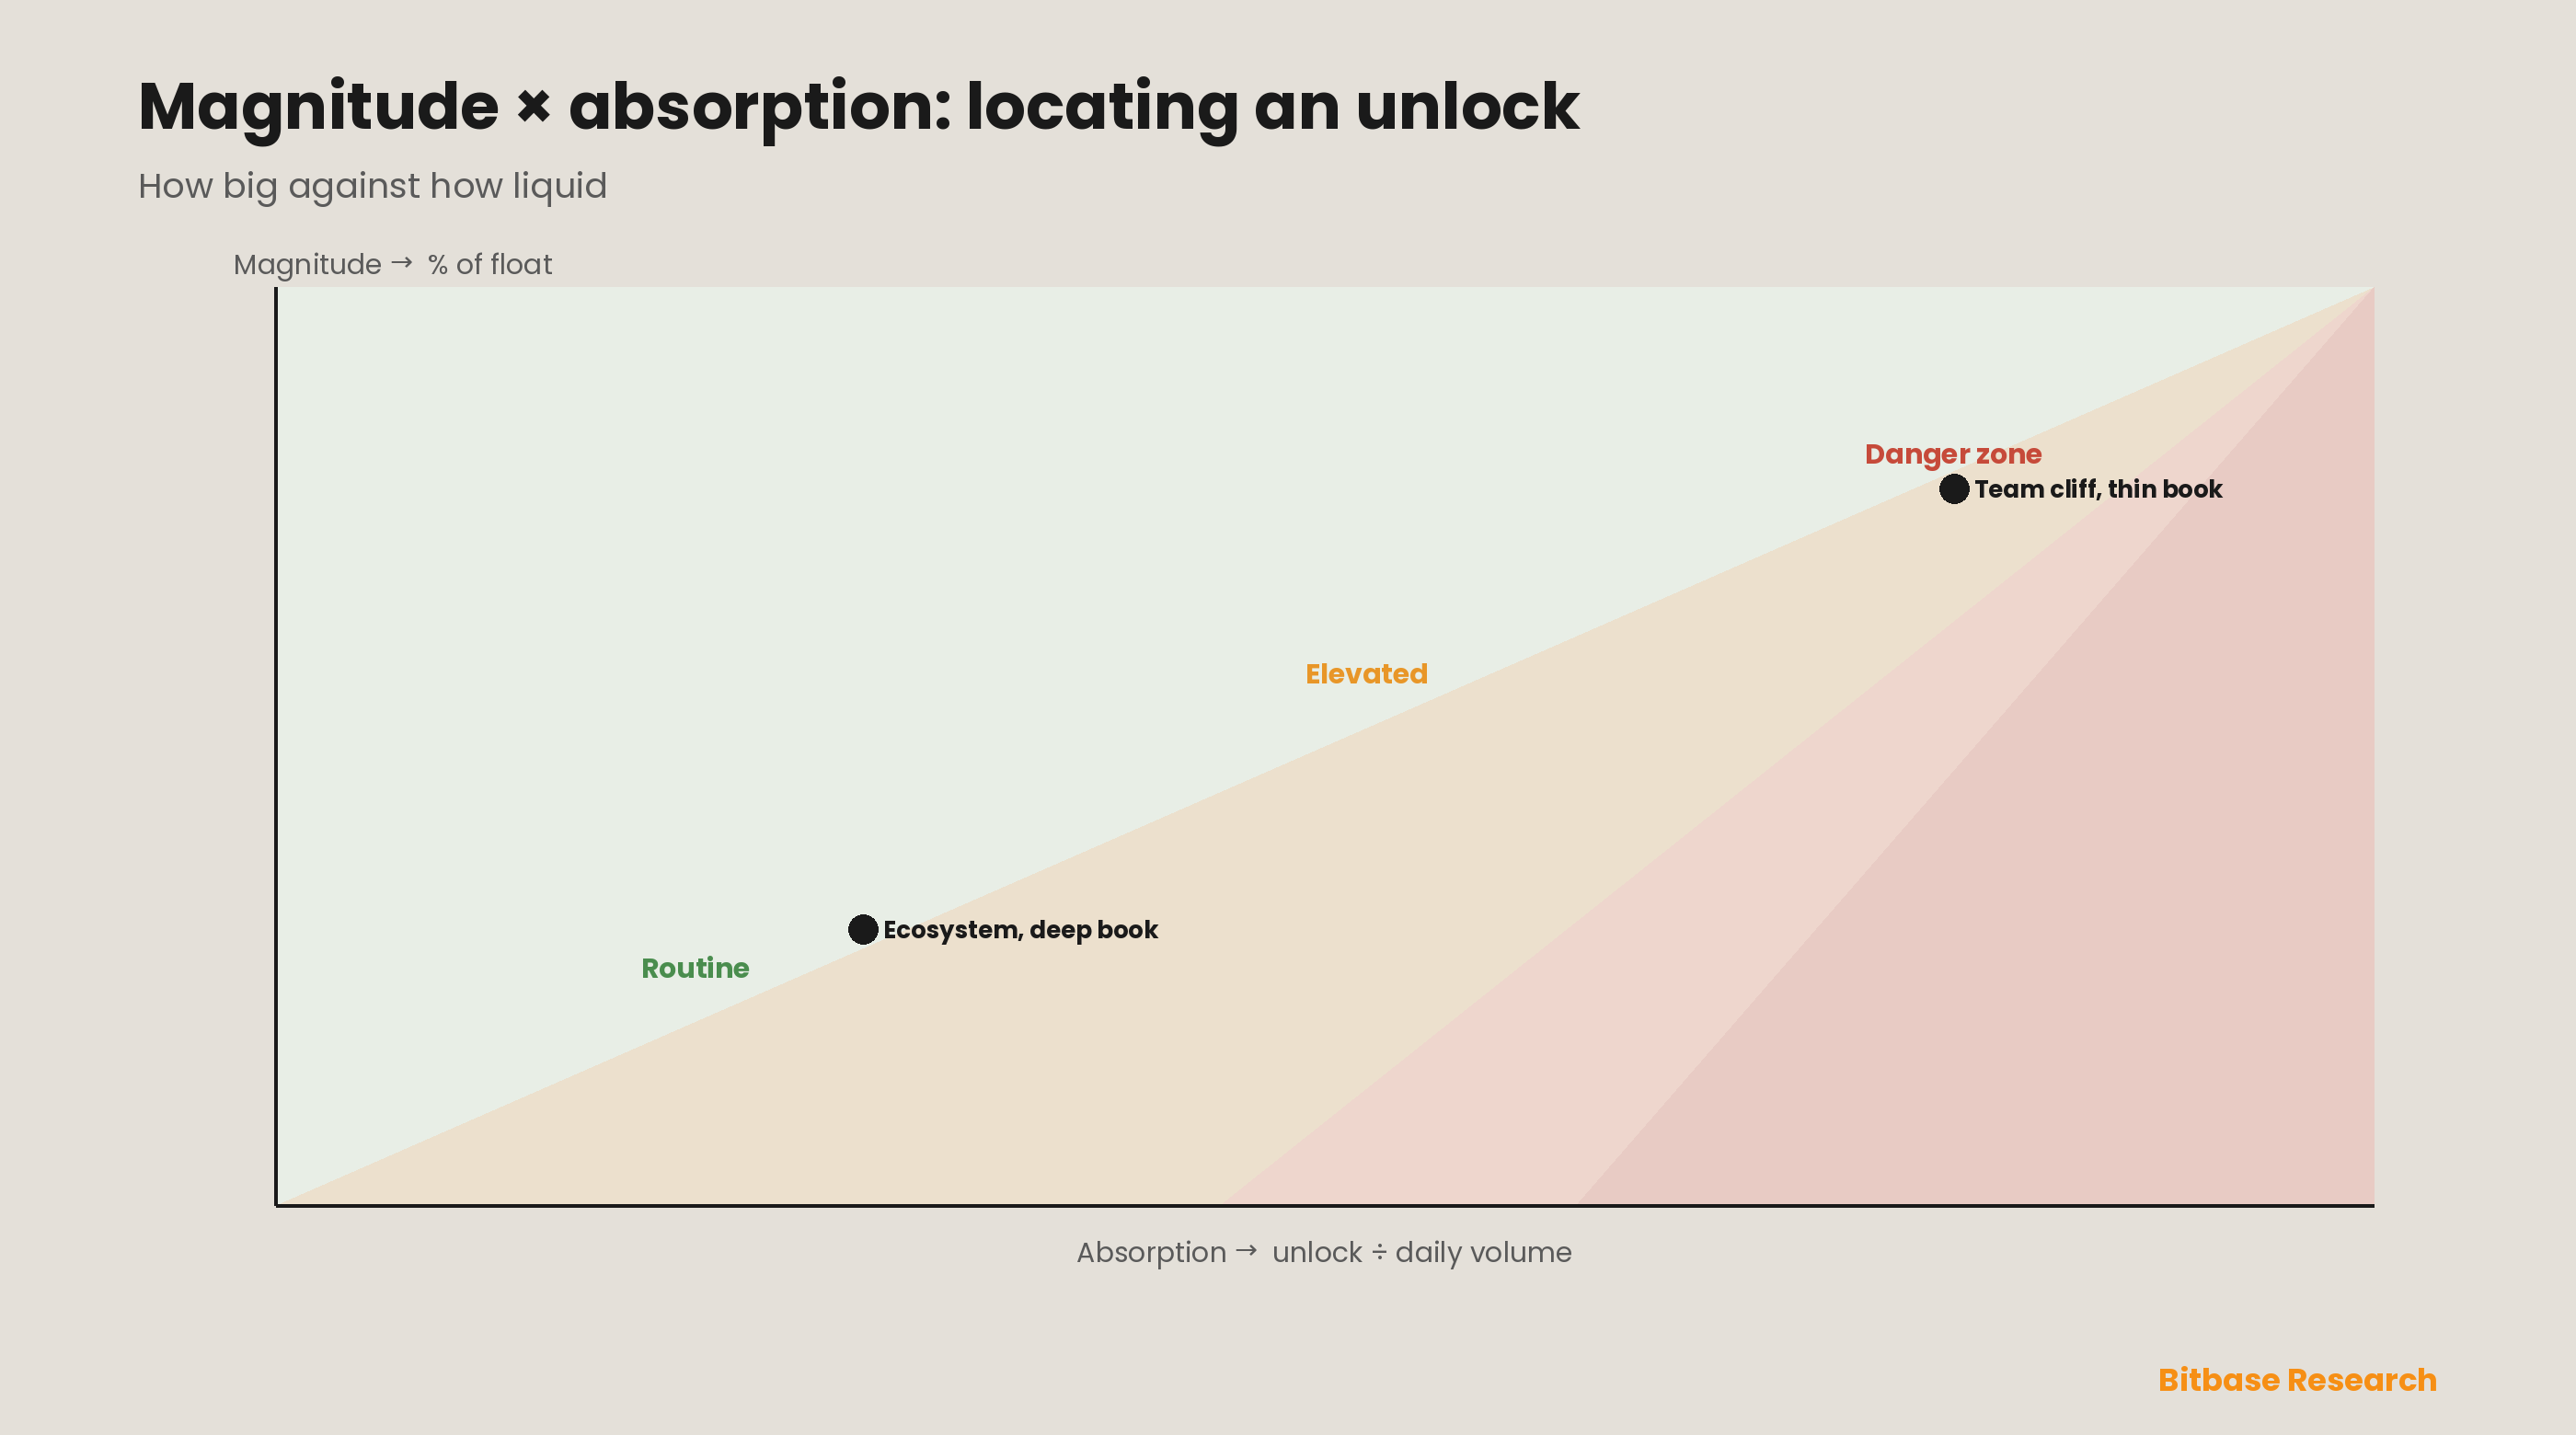
Absorption. The unlock against average daily volume, Q/V_D, read through the square-root law [8][9]; the factor that rescues the score from naive percentage thinking, best visualised jointly with magnitude since a two-dimensional map of how big against how liquid locates an event far more precisely than either axis alone.
Cohort. The strongest single differentiator, entering as a multiplier: a team allocation lands at the top of the range even at moderate magnitude, because uncoordinated insider selling carries the highest permanent-impact content; an investor allocation is discounted, on the evidence that these holders hedge and transact off-book; an ecosystem allocation is discounted furthest and can flip the sign [1]. Resisting the dollar headline to ask whose tokens these are is the framework's single highest-value habit.
Structure. Read through Almgren–Chriss: a cliff maximises temporary impact by concentrating the meta-order, a linear schedule amortises it into a persistent flow [7]. All else equal a cliff scores higher near-term risk than the same amount released linearly, while the linear schedule trades a single shock for a longer overhang.
Timing. Because declines typically begin up to 30 days before the date [1], the risk is a window that opens at roughly T-30, not a point — and, crucially, that window is observable in the derivatives complex (Part 6). Timing does not change whether an unlock is risky; it changes when you should already have acted on the other four factors.
Composed, the factors yield a ranking rather than false-precision: a large ecosystem cliff scores below its headline (cohort discount dominates high magnitude); a mid-size team cliff into a thin book scores at the top (magnitude, absorption and cohort stack, and the cliff maximises temporary impact); a large investor linear release scores middling, its residual risk showing up as a persistent flow rather than an event. Same five questions, defensible ordering, every time.
Part 6 · Reading the tape: the derivatives complex as an anticipation gauge
The 30-day pre-drift is not a mood; it is a cost-minimising response, and that makes it legible. A holder facing a scheduled unlock has a cheap alternative to selling spot: hedge with perpetual futures. At roughly 0.02% funding per eight hours, a two-week hedge costs on the order of 0.84% of notional — trivial against the double-digit drawdown a large unlock can produce — so rational holders hedge rather than dump, and that hedging pressure is the pre-date weakness [15][17]. The behavioural finding of Part 3 has a mechanical cause.
Because the hedge lives in derivatives, anticipation leaves fingerprints in the T-30 window. Funding rates turning and staying negative signal a crowded short/hedge — perp holders paying to be short [15][16]. Open interest building into the date shows how much capital sits in that imbalance; funding tells you the running cost of the imbalance, open interest its size, and together they say far more than either alone [16]. Basis (perp below spot) and spiking spot borrow rates round out the picture [15][17]. When a token approaches an unlock with negative funding, rising open interest, a soft basis and elevated borrow, the market is pricing the event in real time — and the absence of those signals ahead of a large unlock is itself information, often a thinly-followed name where the impact is not yet discounted.
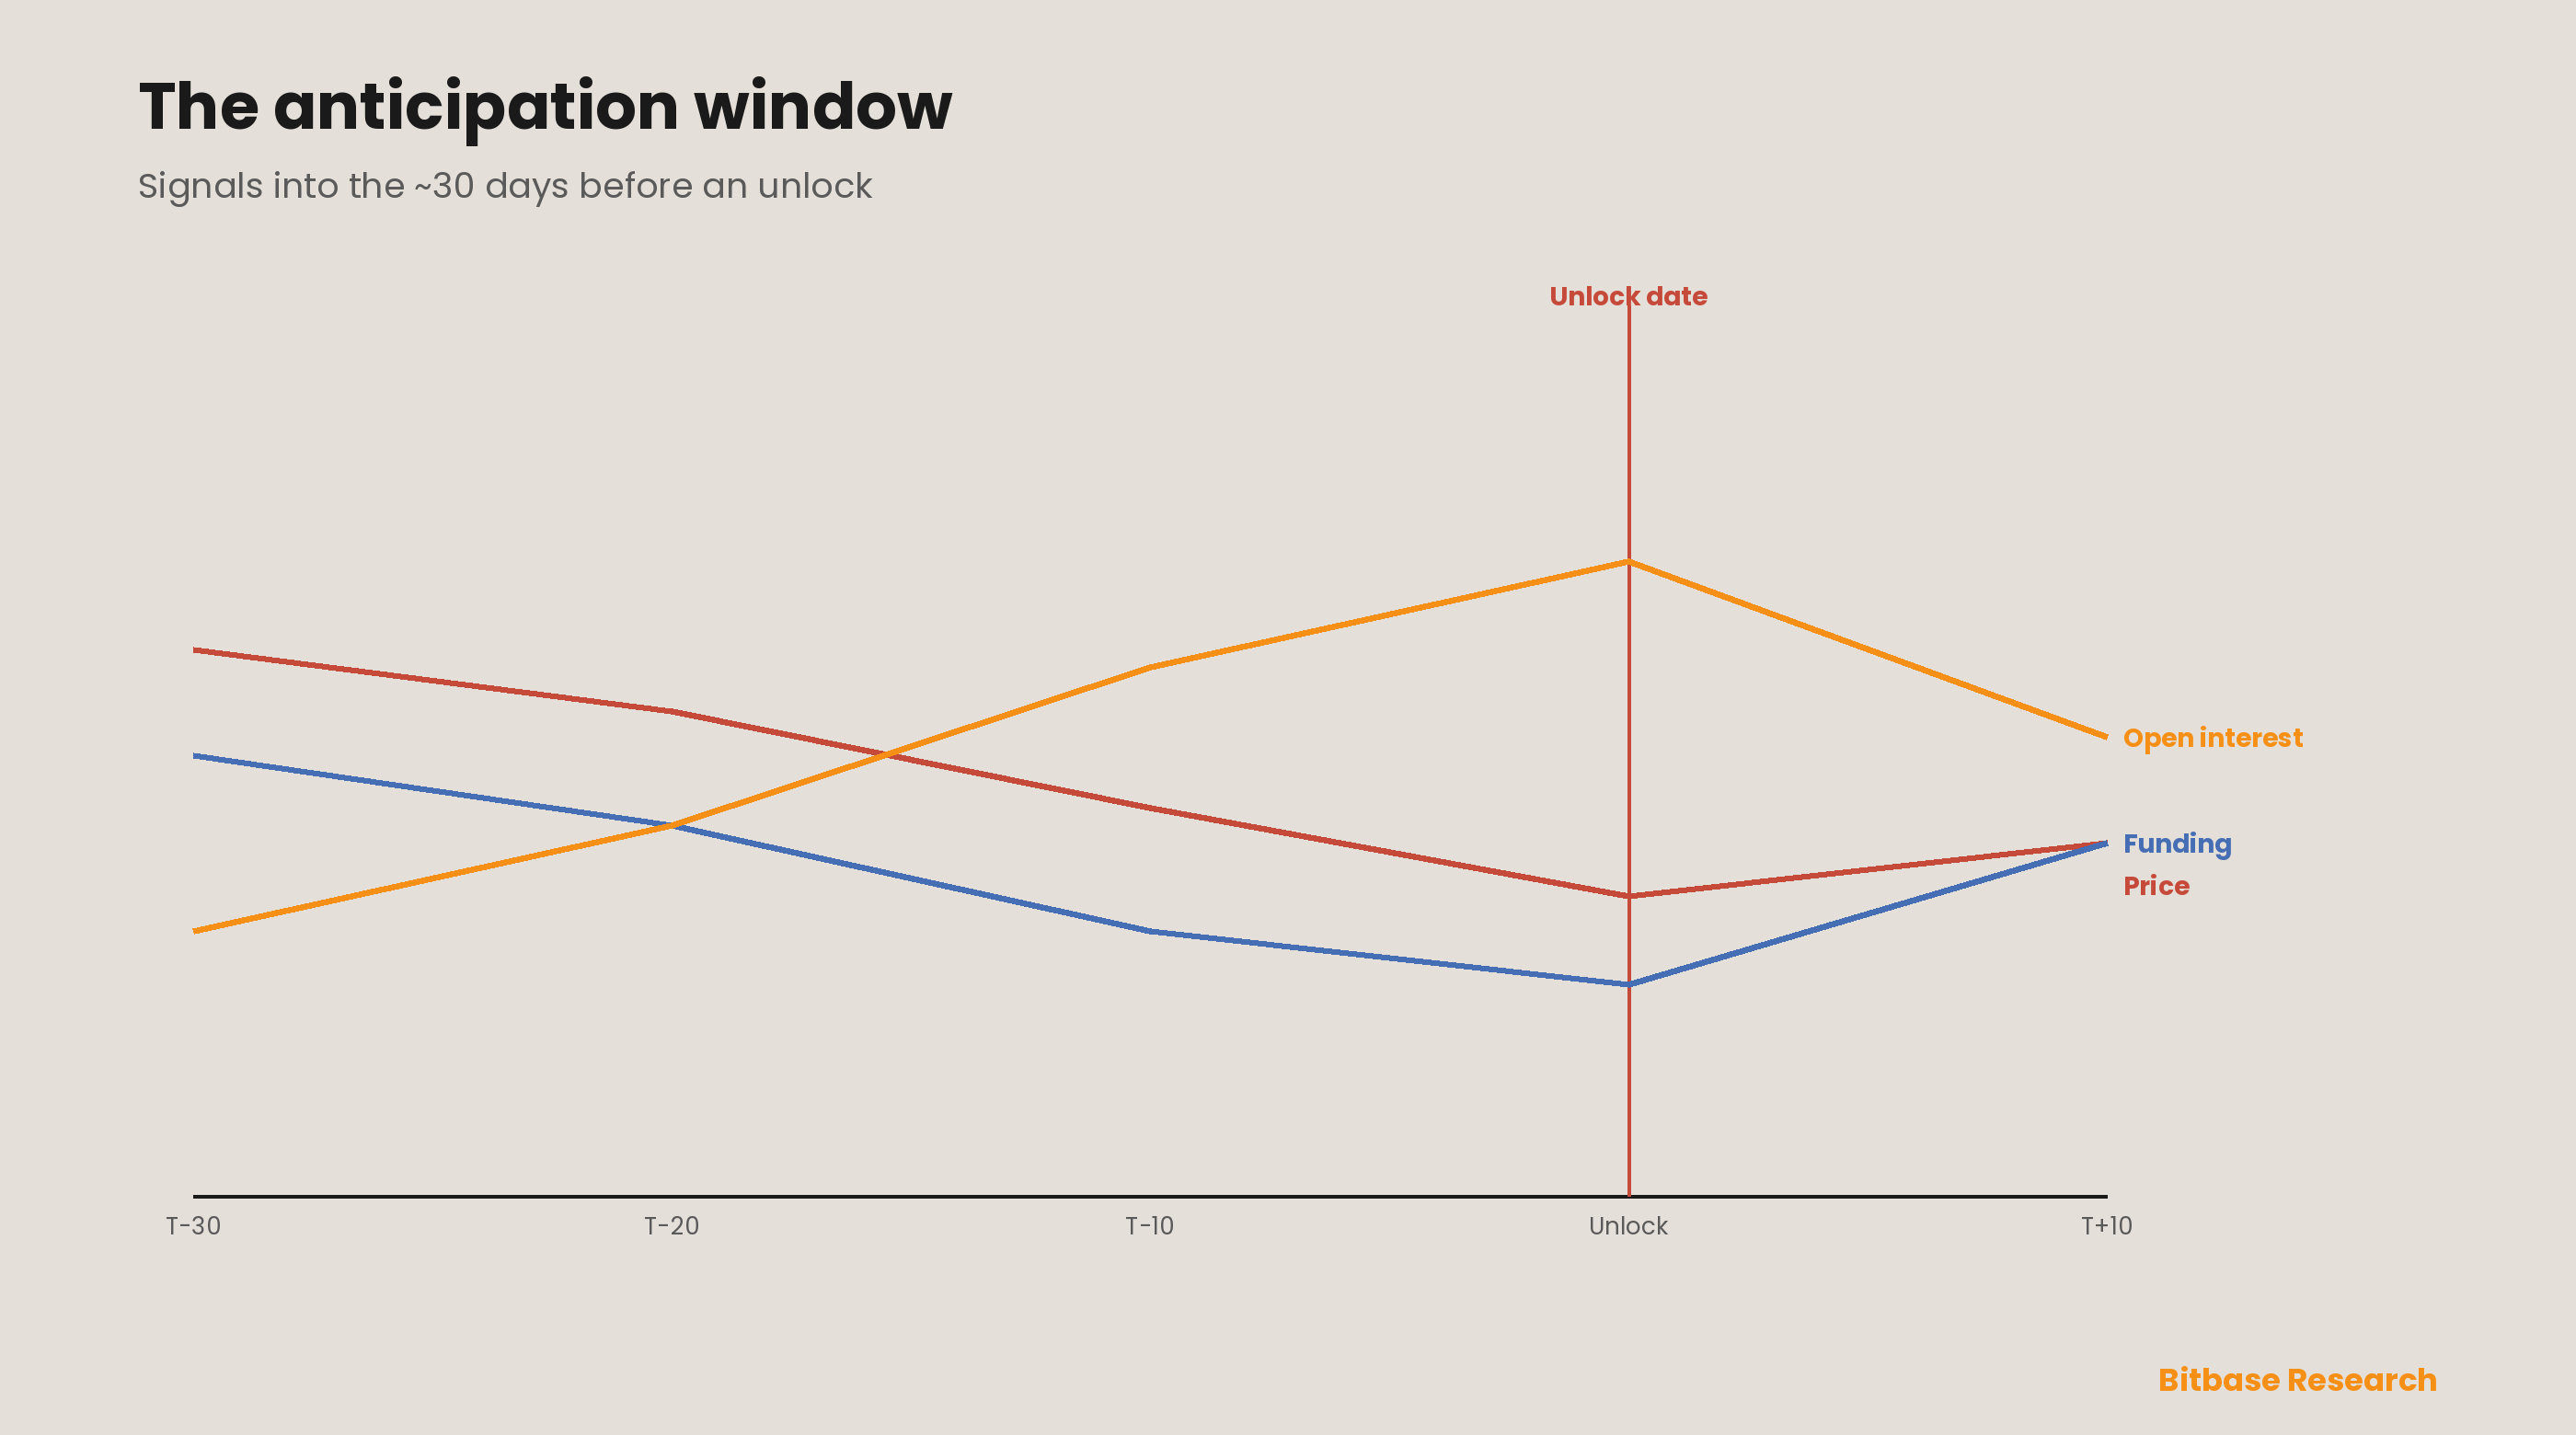
This lens explains the two behaviours that most confuse observers. The quiet unlock — a large, well-telegraphed release that passes with a shrug — is the reflexive equilibrium: anticipation was so efficient that price fully adjusted before the date [1][14]. The post-date relief rally is its mirror: once the overhang clears and hedges unwind (shorts covering, longs re-established), the removal of a known risk can lift price even as float has just expanded, the pattern visible in OP's post-unlock recoveries where fundamentals held [11]. Both are invisible to a framework that watches only the date and the size; both are legible to one that watches the derivatives complex. The edge is in the residual — the events the crowd has not efficiently priced — not in the base rate it already knows.
Part 7 · Applying the score to 2026
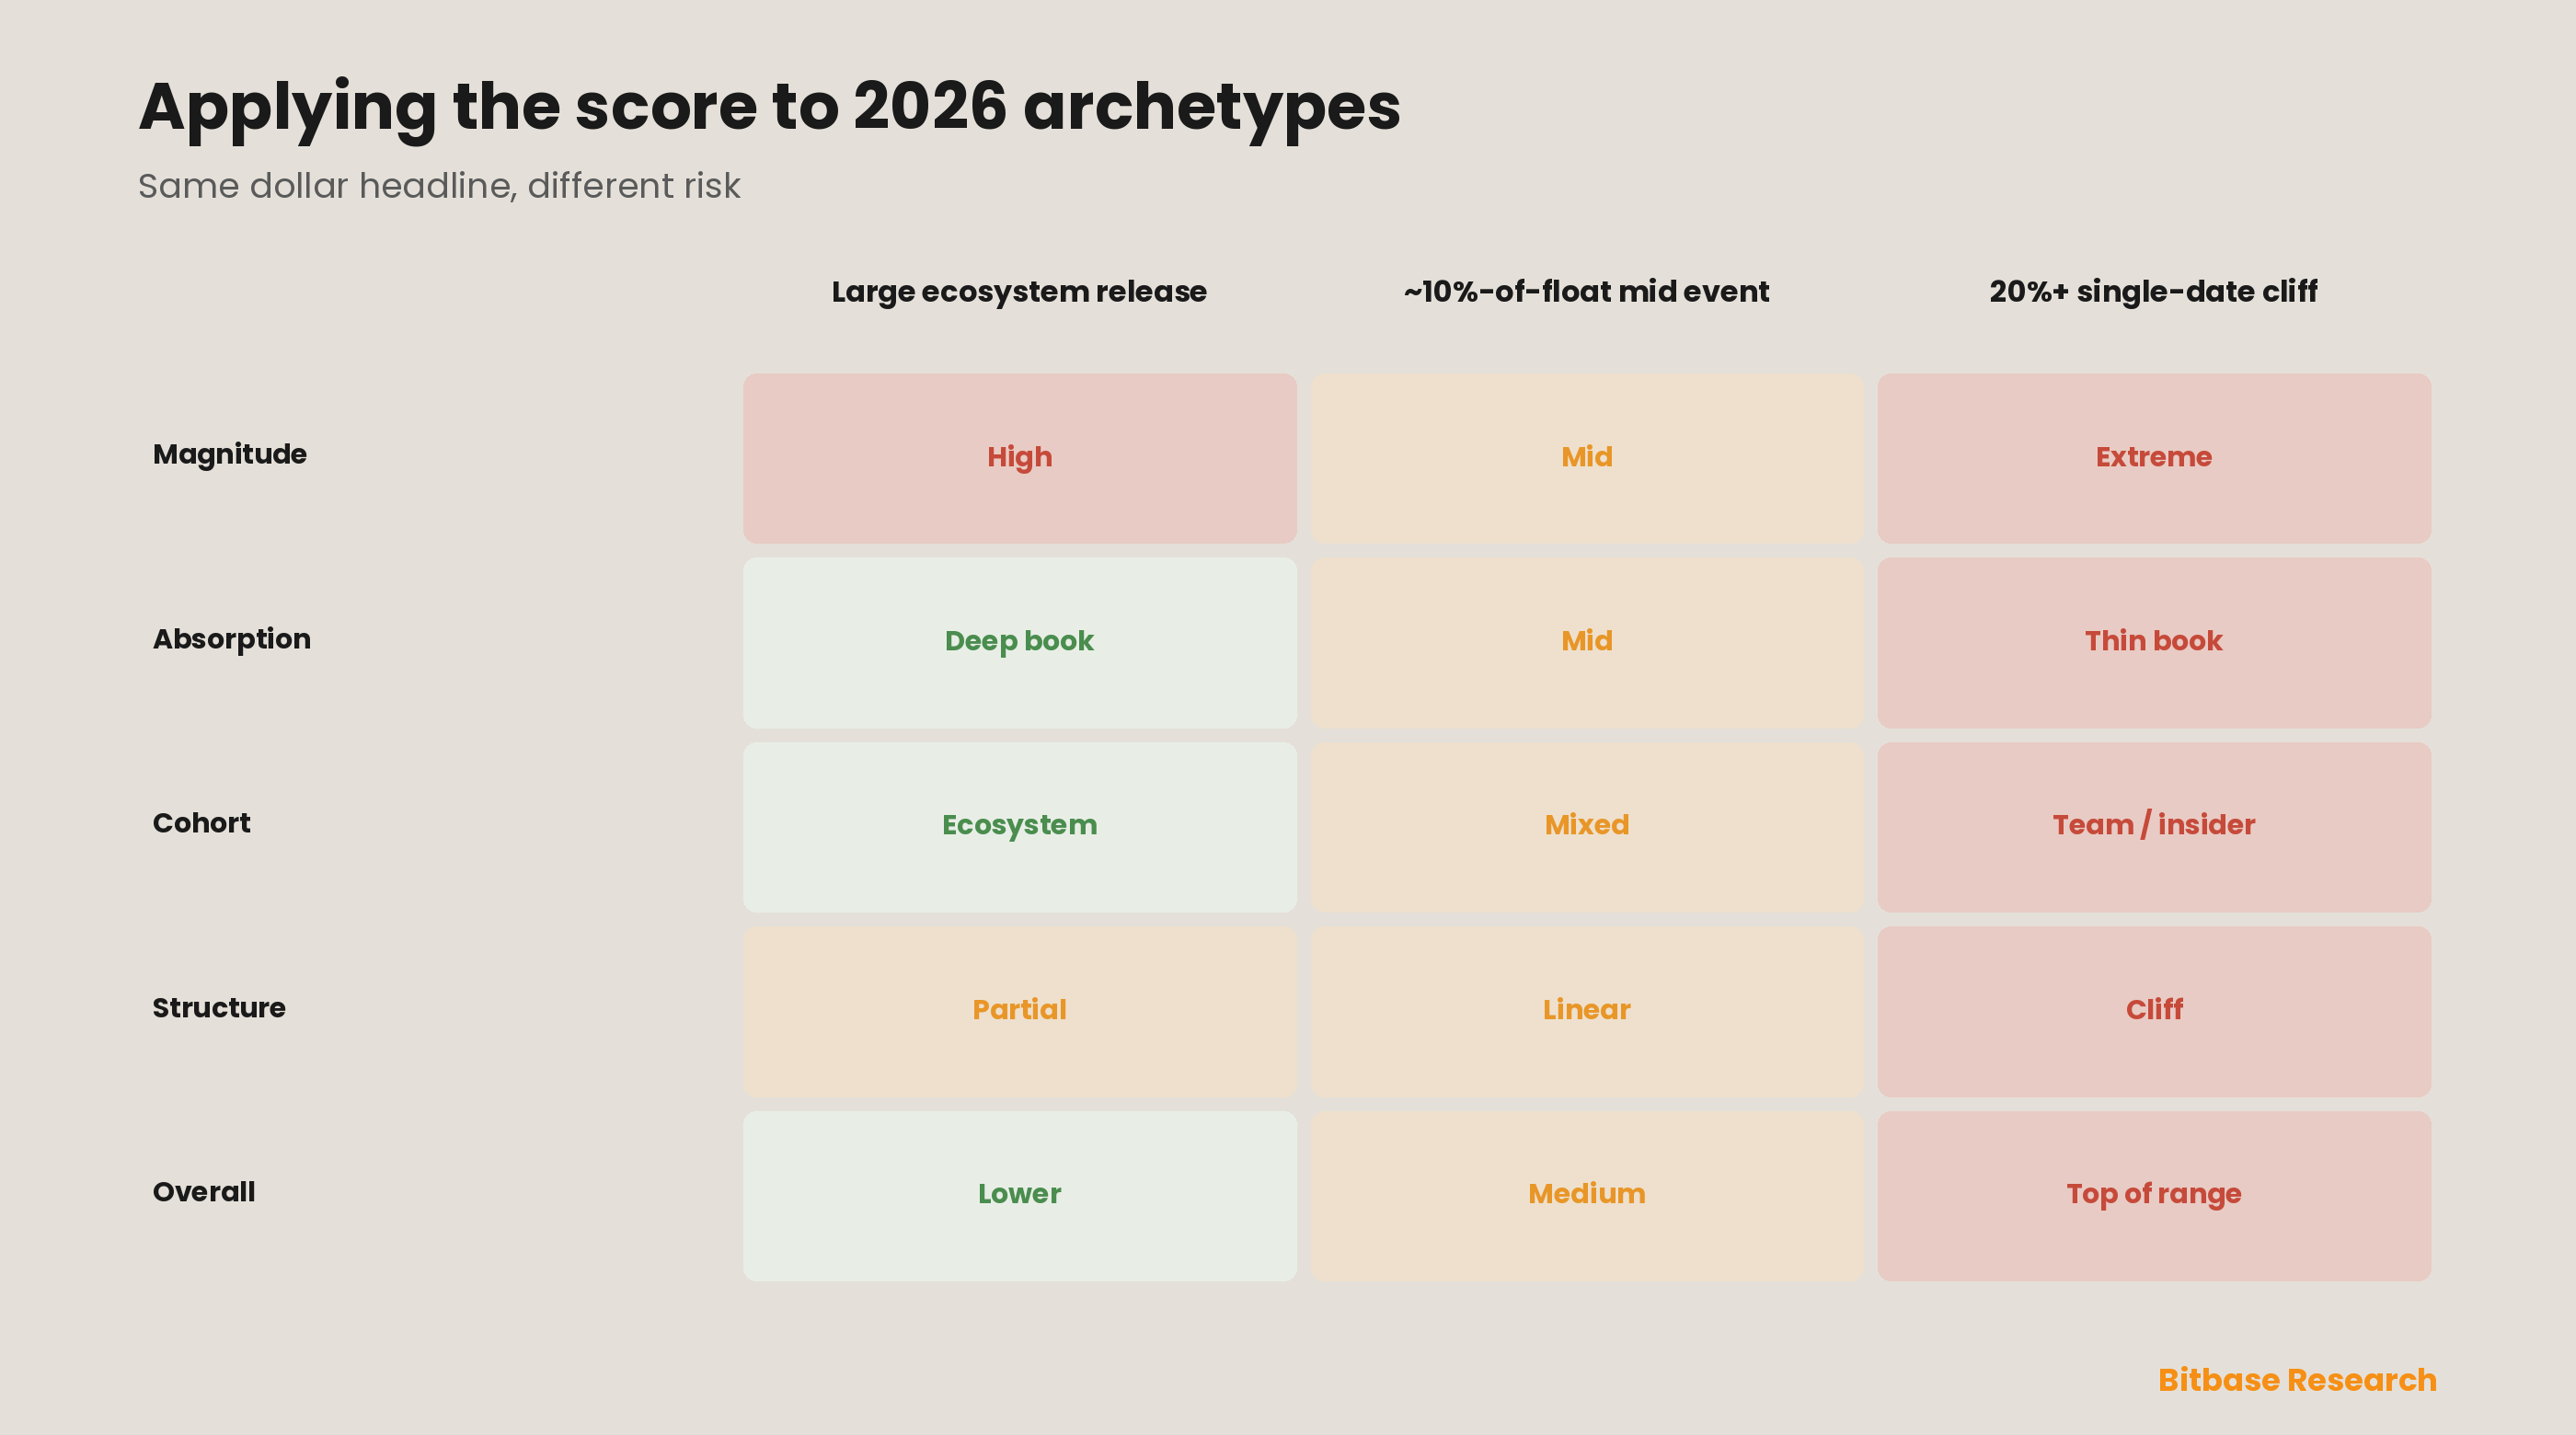
A framework proves its worth by ranking, and 2026 supplied a stress test. March alone carried more than US$6 billion of scheduled unlocks, led by a single US$4.18 billion release that was roughly 69% of the month's total, with later months adding multi-billion-dollar waves [18][19][20][27]. Read through dollar headlines these blur into "a lot of supply"; read through the five factors they separate.
Three archetypes from the calendar make the point. A very large ecosystem release scores well below its headline — magnitude high, but the cohort multiplier pulls hard in its favour — and the analyst's follow-up is to verify the tokens are genuinely deployed rather than relabeled team supply [1]. A single-date cliff crossing 20% of float, as PUMP and CONX did, scores at the top of the range: extreme stock magnitude, cliff structure maximising temporary impact, and, if it lands in a thin book, a failing absorption test all point the same way, and the derivatives tell would be expected to light up well before the date [18][19]. A near-10%-of-float release such as RAIN's — around US$896 million, one of the largest single unlock values in the 2026 dataset [30] — sits in between, its final score hinging on cohort and on how its size compares to that token's daily volume, i.e. squarely on the absorption axis [19][20]. The specific verdicts matter less than the method: the same five questions, plus the derivatives cross-check, produce a defensible ordering that lets a reader triage a crowded calendar instead of reacting to whichever number is largest.
Part 8 · Limits and honest failure modes
A framework earns trust by naming what it cannot do. The score is a lens for supply-side pressure and is silent on the demand that meets it: a strong narrative, a major listing, or a broad market bid can absorb an unlock the score rates high-risk, while a weak tape can make a low-risk unlock feel brutal — market-wide sentiment is the multiplier the score cannot see, and it is often decisive [2].
Four further limits deserve to be stated as plainly as the framework itself. Data quality: vesting schedules are public [12][13], but recipient labels — team versus investor versus ecosystem — are sometimes ambiguous or self-reported, and since cohort is the strongest factor, a "team" allocation dressed as "ecosystem" defeats the apparatus [1]. Reflexivity and decay: because the base rate is widely known and tooled, the most-watched unlocks are efficiently pre-priced, so the live edge concentrates in less-followed names and in cohort/absorption mislabeling rather than in headline events everyone is already short [11][14]. Model humility: serious practitioners model unlock impact stochastically — Delphi's sell-pressure simulator uses Monte-Carlo paths and confidence bands — precisely because a point estimate of a nonlinear, sentiment-dependent process is false precision, which is why our score is deliberately an ordinal ranking, not a cardinal prediction [14]. Scope: the score ranks relative risk; it is not a price target and cannot tell you what the current price already reflects. Used as a checklist it sharpens judgement; used as a crystal ball it will disappoint.
Conclusion · From a calendar to a discipline
Token unlocks reward preparation precisely because they are scheduled, public, mechanically driven, and — on the weight of evidence from both crypto and the equity lock-up literature — negative far more often than not, with the weakness usually beginning a month before the date [1][3]. But the base rate is where analysis starts, not where it ends. Beneath it sits the physics of market impact, which turns "unlock ÷ daily volume" from a rule of thumb into a derived, nonlinear absorption cost and makes cliff-versus-linear a matter of temporary versus amortised impact [7][8]. Around it sits the derivatives complex, which turns the 30-day anticipation window from folklore into a readable set of signals and explains both the quiet unlock and the relief rally [15][16]. Between them, the five-factor Sell-Pressure Risk Score converts a wall of upcoming unlocks into a ranked list: size the event against float and against daily volume, weight the cohort heavily, classify the structure, and open the risk window at T-30 while watching funding, open interest, basis and borrow for the market's own verdict.
The deeper foundations these events act on — how vesting schedules and unlock cliffs are engineered, how treasury and ecosystem reserves are carved out of supply, and how circulating float diverges from total supply and FDV — are each worth understanding in their own right, because the score is only as good as the reader's grasp of the mechanics it scores. Treat it as a discipline for ranking supply risk, never as a prediction of price, and always alongside the demand-side and market context no supply framework can capture.
References
[1] Keyrock, From Locked to Liquidity: What 16,000+ Token Unlocks Teach Us (analysis of 16,000+ unlock events). keyrock.com
[2] Binance Research, Low Float & High FDV: How Did We Get Here? (May 2024), with 2025-cohort token-performance data. binance.com
[3] Field, L. C. & Hanka, G. (2001), "The Expiration of IPO Share Lockups," Journal of Finance 56(2), 471–500. onlinelibrary.wiley.com
[4] Ofek, E. & Richardson, M. (2000), The IPO Lock-Up Period: Implications for Market Efficiency and Downward Sloping Demand Curves, NYU Stern working paper. researchgate.net
[5] Bradley, D., Jordan, B., Roten, I. & Yi, H. (2001), "Market Reaction to the Expiration of IPO Lockup Provisions," Journal of Financial Research. researchgate.net
[6] Kyle, A. S. (1985), "Continuous Auctions and Insider Trading," Econometrica 53(6), 1315–1335. econometricsociety.org
[7] Almgren, R. & Chriss, N. (2000), "Optimal Execution of Portfolio Transactions," Journal of Risk 3(2), 5–39.
[8] Bouchaud, J.-P., The Square-Root Law of Market Impact. bouchaud.substack.com
[9] Strict Universality of the Square-Root Law in Price Impact Across Stocks: A Complete Survey of the Tokyo Stock Exchange (2024). arxiv.org
[10] Kyle, A. S. & Obizhaeva, A. A., The Market Impact Puzzle / Market Microstructure Invariance. nes.ru
[11] Kim, H., The 72-Hour Shock? Preliminary Evidence from 52 Token Unlock Events on Binance, SSRN working paper. papers.ssrn.com
[12] Tokenomist, Token Unlocks — Vesting Schedules & Release Data. tokenomist.ai
[13] CoinMarketCap, Token Unlocks and Vesting Schedules. coinmarketcap.com
[14] Delphi Digital, Token Sell-Pressure Simulator. sellpressure.xyz
[15] Coinbase, "Understanding Funding Rates in Perpetual Futures." coinbase.com
[16] OSL, "Funding Rates Explained: How Perpetual Futures Fees Signal Market Pressure." osl.com
[17] BloFin Academy, "How to Hedge Spot Crypto With Perpetuals." blofin.com
[18] KuCoin, "Large Token Unlocks: Price Impact and 2026 Supply Pressure." kucoin.com
[19] CoinGabbar, "Major Token Unlocks Schedule (2026)." coingabbar.com
[20] Unlocks.app, "Unlocks Activity in July 2026." insights.unlocks.app
[21] Unchained, "Who’s to Blame for the Underperformance of Low Float, High FDV Tokens?" unchainedcrypto.com
[22] Loeb, T. F. (1983), "Trading Cost: The Critical Link Between Investment Information and Results," Financial Analysts Journal 39(3).
[23] Torre, N. (1997), BARRA Market Impact Model Handbook (origin of the square-root impact specification).
[24] Gabaix, X., Gopikrishnan, P., Plerou, V. & Stanley, H. E. (2006), "Institutional Investors and Stock Market Volatility," Quarterly Journal of Economics 121(2).
[25] Messari, Token unlocks, vesting and supply schedules (research library). messari.io
[26] CryptoRank, Cryptocurrency Vesting — Token Unlock calendar. cryptorank.io
[27] DropsTab, Crypto Token Unlocks and Vesting Schedules. dropstab.com
[28] Cointelegraph, "It’s Time to Bring Back Low-FDV Token Sales and Fair Community Launches." cointelegraph.com
[29] CryptoSlate, "VC Funding Is Back — and It May Be Setting Up the Next $97B Token Unlock Wave." cryptoslate.com
[30] CryptoRank & DropsTab combined unlock datasets used for 2026 event magnitudes (RAIN, WhiteBIT, PUMP, CONX, ARB, OP). cryptorank.io
Methodology and disclosure: This report synthesises published empirical research on token unlocks (principally a large-sample study of 16,000-plus events [1] and an early 52-event academic study [11]); the equity lock-up-expiration literature used as a structural analog [3][4][5]; the market-microstructure literature on price impact (the Kyle linear model [6], the Loeb–Torre–Bouchaud square-root law and its cross-asset confirmations [8][9][22][23], the Almgren–Chriss temporary/permanent decomposition [7], and market-microstructure invariance [10][24]); public 2026 vesting-calendar data [12][13][18][19][20][26][27]; and standard perpetual-futures funding mechanics [15][16][17]. The thresholds cited (≈2%, 5% and 20% of circulating supply; ≈2.4× average daily volume; the ~30-day anticipation window; cohort effects including the ≈+1.18% average for ecosystem unlocks; ~US$155B of 2024–2030 unlocks and the 12.3% average MC/FDV of 2024 launches) are drawn from those sources and are illustrative of the framework rather than forecasts for any specific token. The Sell-Pressure Risk Score is an educational, ordinal analytical construct for ranking relative supply risk; it is not a rating, a recommendation, a price target, or a substitute for a project's own audited vesting disclosures.
Disclaimer: This is educational content from Bitbase Research, provided for informational purposes only. It is not investment, trading, tax, or financial advice. Written as of July 2026; token unlock schedules, liquidity and market conditions change continuously, so always rely on the latest official vesting data and do your own research before making any decision.