
Publication date: July 23, 2026 · Bitbase Research
For related Bitbase Research on this subject, see DePIN Basics and Tokenomics.
Executive Summary
Decentralized physical infrastructure networks (DePIN) are the crypto sector where the gap between narrative and cash flow is finally measurable, and that makes them the sector where a disciplined evaluation framework pays off most. By early 2026 the category carried a token market capitalization around US$19 billion across some 650 projects and more than two million active nodes, and — critically — it was producing roughly US$150 million per month in demonstrable on-chain revenue paid by real customers for storage deals, compute jobs, data credits and mapping services [1][2]. That is real money, on the order of US$1.8 billion annualized, which is exactly why DePIN cannot be evaluated the way a pre-revenue token is: it has a top line, and a top line demands a discipline for reading it. The World Economic Forum projects the addressable market could surpass US$3.5 trillion by 2028, but a trillion-dollar TAM is a reason to build the discipline, not a substitute for it [3].
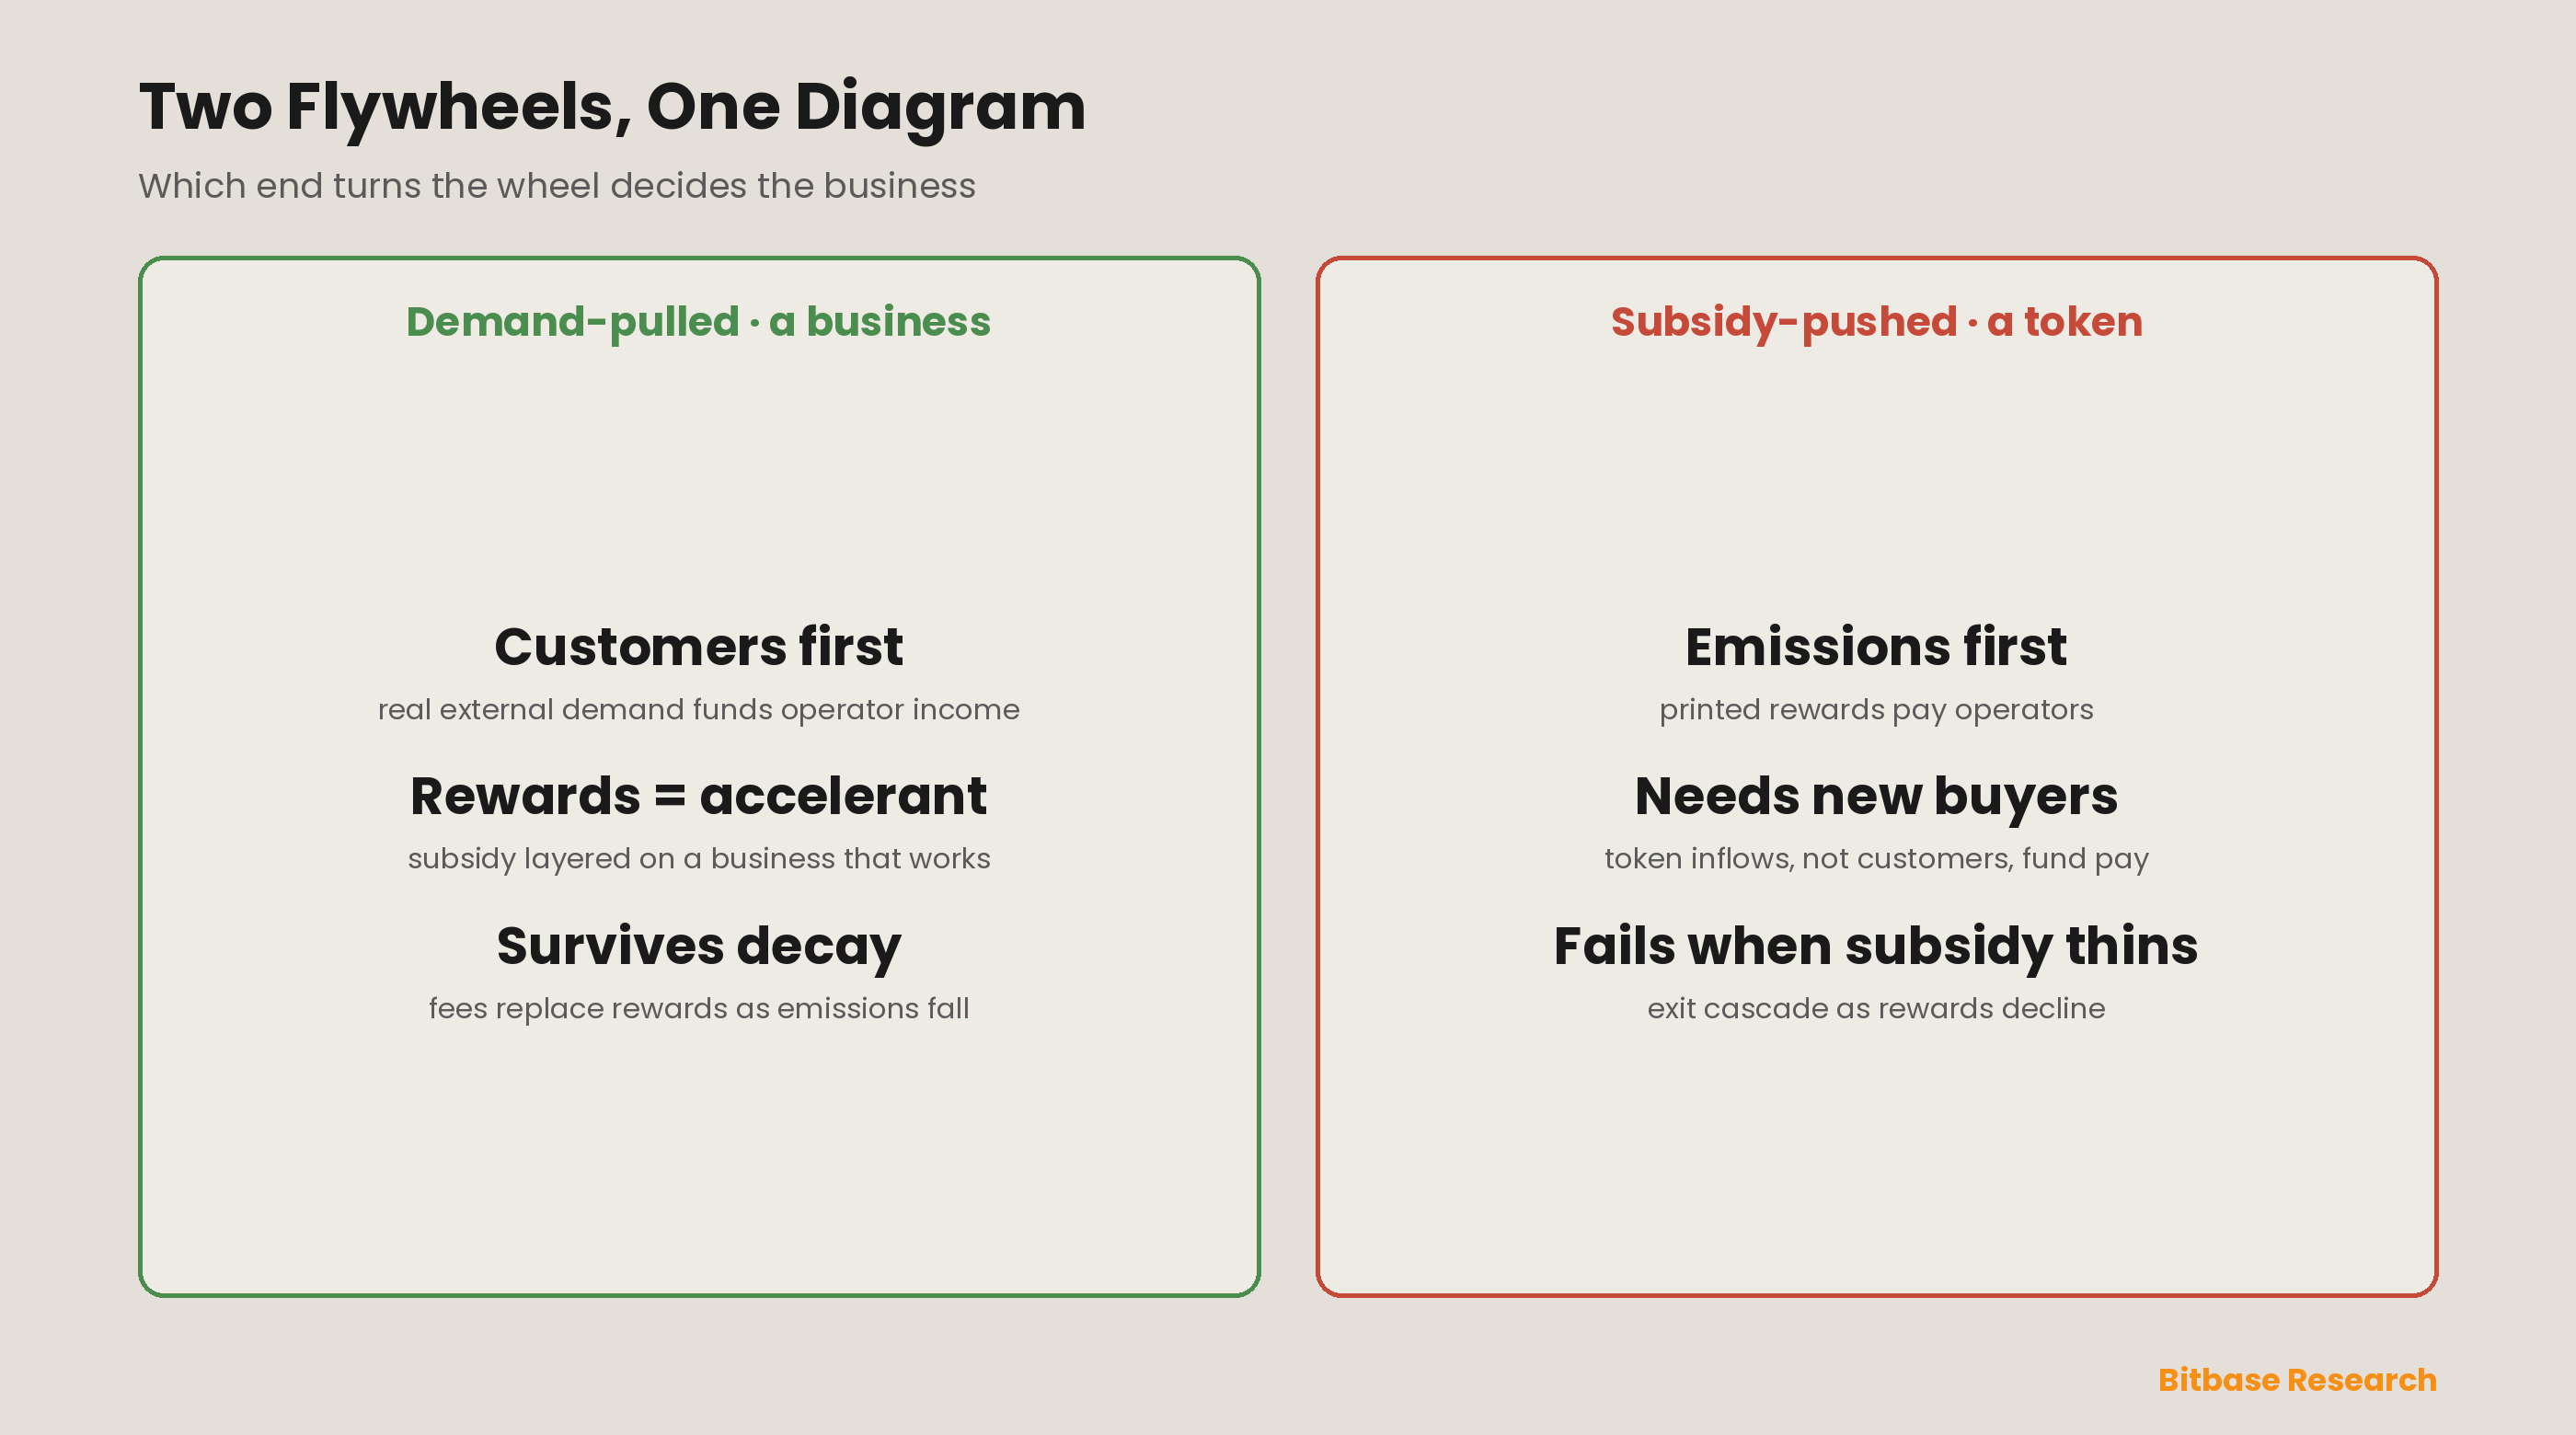
This report supplies that discipline in one central distinction: the difference between demand pulling a network forward and token emissions pushing it from the supply side. Every DePIN runs a flywheel — token rewards attract hardware operators, operators supply a service, the service attracts demand, demand generates revenue, and revenue supports the token that pays the operators — but the flywheel can be turned from either end, and which end dominates decides whether the network is a business or a subsidy scheme [8]. A demand-pulled flywheel is a company; a subsidy-pushed one is a token that requires a permanent supply of new buyers to keep paying operators, and it fails the moment that supply thins [8][10]. The framework's job is to measure, for any DePIN, how much of its flywheel turns on real demand versus printed rewards.
To make that measurable, the report centers on one metric and two grading axes. The metric is demand coverage — the share of operator compensation funded by real service fees rather than emissions — with a widely used threshold: networks where fees exceed roughly 50% of operator pay have entered the "revenue era," while those still paying operators mostly in freshly minted tokens remain in the "subsidy phase" [11]. Around that metric sit two axes: the quality of demand-side revenue (real fiat-denominated customers versus token speculators) and the sustainability of supply-side emissions (whether operator economics survive as rewards decay). The clearest sign the sector is maturing along exactly these lines is Akash's March 2026 launch of a Burn-Mint Equilibrium that automatically buys and burns AKT whenever customers pay for compute, converting an inflationary emission model into a deflationary, demand-linked one [7]. Everything here is educational analysis, not investment advice.
Part 1 · The Flywheel and Its Two Directions
Precision about the DePIN flywheel is the foundation for everything else, because the flywheel is genuinely the right mental model — it just has a direction that most descriptions omit. The canonical loop is: token rewards attract supply (people buy hardware and run nodes to earn tokens); supply creates a useful service (coverage, compute, storage, maps); the useful service attracts demand (customers who need it); demand creates revenue, often by burning the token to mint usage credits; and that revenue supports the token's value, which attracts more supply [8][9]. Drawn as a circle, every DePIN looks identical. The difference — the entire difference — is which arrow is doing the work.
A demand-pulled flywheel starts from customers: real, external demand exists, revenue flows in, and that revenue is what makes operating a node profitable, so the token rewards are a bootstrapping accelerant layered on top of a business that would function without them. A subsidy-pushed flywheel starts from emissions: token rewards are attractive enough that operators join to earn and sell them, supply grows, and the network hopes demand shows up before the emissions that fund operator income run out or inflate away. The structural point, stated plainly in the sector's own literature, is that external demand pulling the flywheel forward is not the same as token incentives pushing from the supply side, and demand-driven flywheels are structurally more durable than subsidy-driven ones [8]. This is not a moral distinction — every network bootstraps with incentives, and token rewards are a legitimate and often necessary way to solve the cold-start problem of physical infrastructure [12]. It is a timing distinction: a healthy DePIN uses subsidy to reach real demand and then transitions its operator payments onto that demand, while an unhealthy one never makes the transition and runs on subsidy until the subsidy fails.
Part 2 · The Core Metric: Demand Coverage
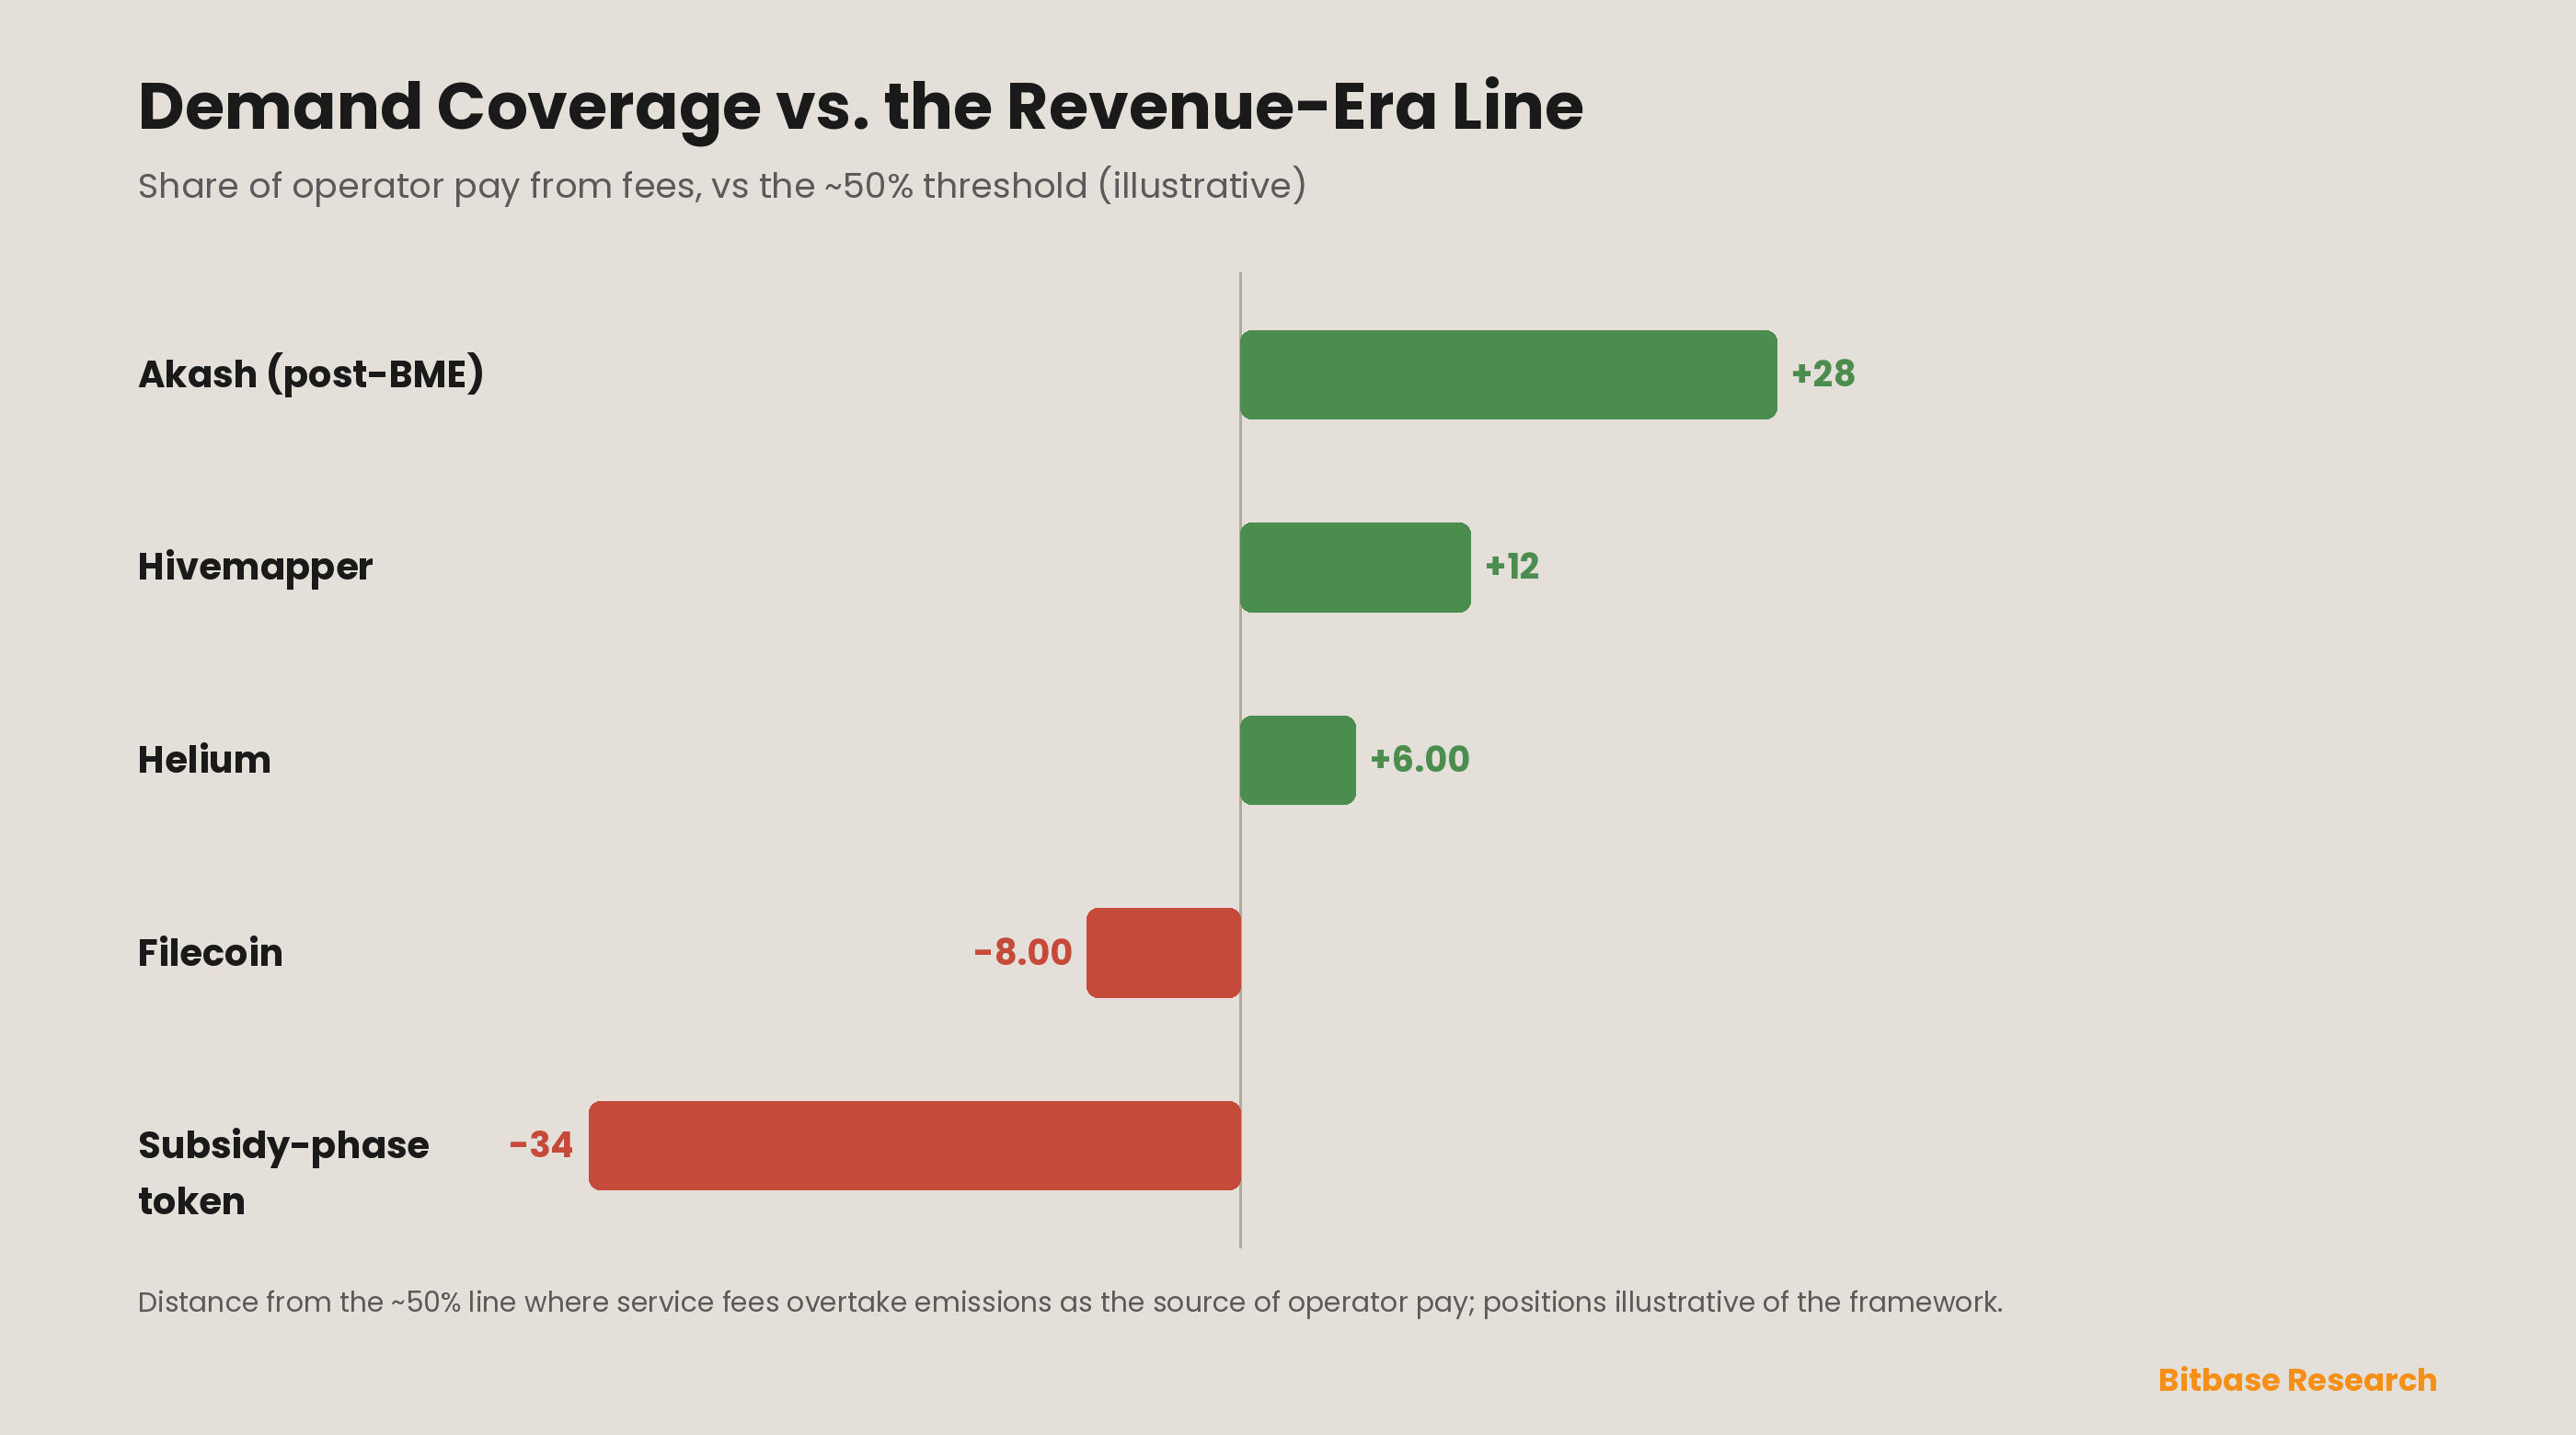
To turn the pull-versus-push distinction into a number, the framework centers on a single ratio — demand coverage, the share of operator compensation funded by real service fees rather than by emissions. The logic is direct: if operators are paid mostly in tokens the network prints, their income depends on new buyers absorbing those tokens, and the network is subsidy-pushed; if operators are paid mostly from fees real customers pay, their income depends on demand, and the network is demand-pulled. The sector has converged on a usable threshold: networks where service fees exceed roughly 50% of operator compensation have entered the "revenue era," while those where emissions still dominate remain in the "subsidy phase" [11]. Fifty percent is not a magic number, but it is a meaningful line, because it marks the point at which a network could, in principle, survive a complete halt of emissions without operators fleeing.
The mechanism that makes demand coverage real rather than cosmetic is how DePIN monetizes demand: in the well-designed networks, customers pay in fiat-denominated usage credits that are created by burning the network's native token — Helium's Data Credits are the archetype — so real demand becomes a continuous, structural buy-and-burn of the token, with governance-calibrated issuance and collateral forming the economic architecture [9]. This is why Akash's March 2026 Burn-Mint Equilibrium matters as more than a headline: by automatically buying and burning AKT whenever a customer pays for compute, it hard-wires demand coverage into the token, directly linking scarcity to usage and replacing an inflationary emission model with a deflationary, demand-driven one [7]. Reading demand coverage, then, is a matter of tracing whether the token's sinks (burns for usage credits, fees) are funded by customers or by the same emissions that are its sources — and a network whose only meaningful token sink is speculation, no matter how large its node count, sits at a demand coverage near zero.
Part 3 · Demand-Side Revenue Quality
Demand coverage tells you how much of operator pay is funded by fees; the next question is whether that demand is high quality, because not all revenue is equal and DePIN offers several ways to manufacture the appearance of it. High-quality demand is external, fiat-denominated, and paid by customers who need the service for reasons unrelated to the token — the enterprises buying Hivemapper's street-level map data because they need fresh maps, whose payments drove the network's annualized revenue from about US$500,000 in August 2025 to roughly US$18 million by early 2026, a 36-fold increase that no token incentive could manufacture [5]. Helium's expansion into mobile service, monetized through partnerships with carriers like T-Mobile and DISH, is the same pattern: revenue that comes from a real telecom use case, reaching roughly US$12 million in a single quarter, up 45% year over year [4]. This is the revenue that matters, because it does not depend on crypto sentiment and it persists through drawdowns — networks prioritizing real, sustainable cash flow over inflationary rewards consistently show superior pricing resilience during market consolidations [1][18].
Low-quality demand is the opposite, and the framework has to name its forms. There is token-recycled demand, where the "customers" are largely participants inside the ecosystem paying with tokens they earned as operators, so the revenue is really emissions taking a lap; there is grant-funded demand, where usage is paid for out of the project's own treasury to seed a dashboard; and there is speculative demand, where the token's only real sink is people buying it to bet on the network rather than to use it. Each inflates the demand-coverage numerator without adding an external customer, which is exactly why the quality question is inseparable from the quantity one. The discipline is to trace the money to its source: revenue that originates outside the token economy — fiat from an enterprise, a carrier, a data buyer — is the asset; revenue that originates inside it is emissions wearing a customer's coat. Filecoin illustrates the honest middle: with network utilization around 31% of its built capacity, it has genuine external storage demand, but a large gap between capacity and use, which is precisely the kind of demand-quality signal the framework is built to read [6].
Part 4 · Supply-Side Unit Economics
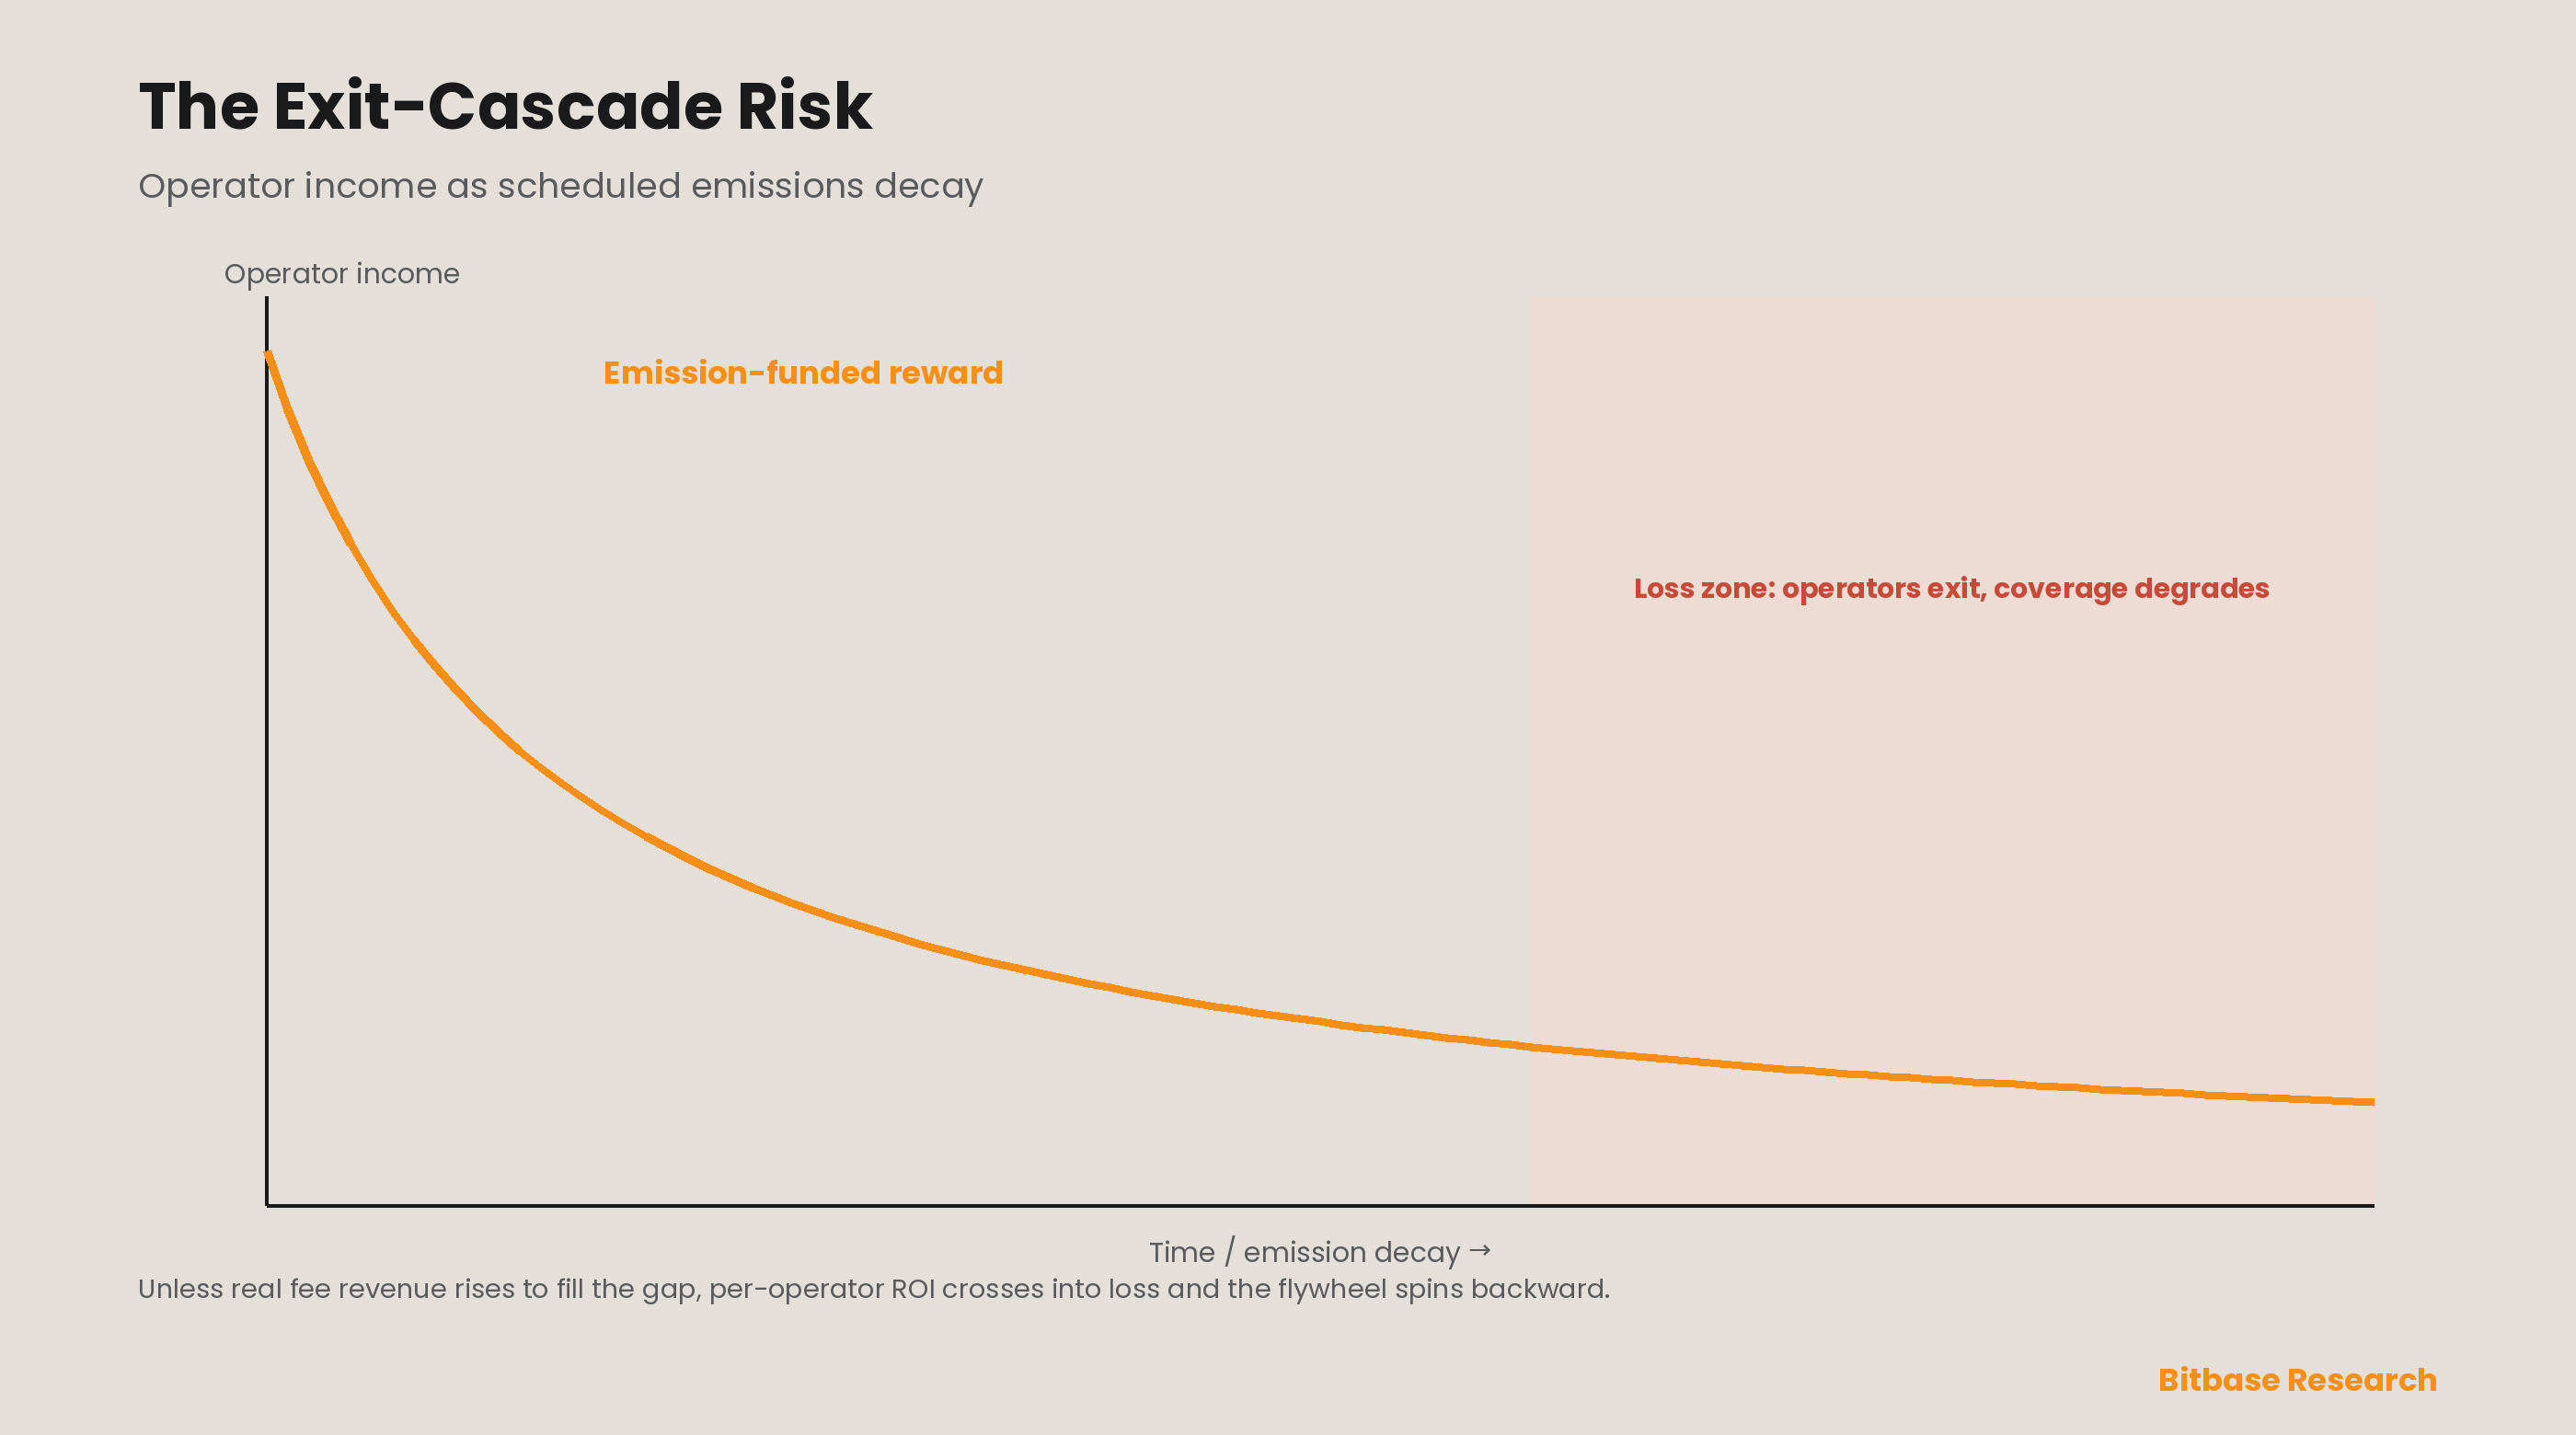
Demand is only half the flywheel; the other half is whether operating a node actually pays, and this supply-side unit economics is where subsidy-pushed networks quietly break. An operator's decision is an investment calculation: hardware and running costs on one side, token-plus-fee rewards on the other, and a network is only stable if that calculation clears for enough operators to sustain the service. The danger is that in a subsidy-pushed network, the reward side is dominated by emissions that are, by design, scheduled to decline — and as emissions fall, operator income falls with them unless real fee revenue rises to fill the gap. When it does not, operator ROI turns negative, operators shut down or sell hardware, coverage degrades, and the degraded service attracts even less demand: an exit cascade that is the mirror image of the bootstrapping flywheel, spinning the wheel backward [10].
Two specific unit-economics failure conditions deserve to be read directly off a project's data. The first is emission inflation eroding operator purchasing power: if the network prints tokens faster than demand creates sinks for them, each operator's token rewards buy less over time even if the nominal count is stable, and rational operators exit before the rewards collapse to zero. The second is quality-demand mismatch, where operator growth — driven by attractive early emissions — outpaces actual customer demand, so the fixed reward pool is split among ever more operators and per-operator income falls regardless of the token price, a slow starvation that looks like success on a node-count chart right up until operators leave [10]. Both conditions are why node count is one of the most misleading DePIN metrics: two million active nodes is impressive only if demand has grown to pay them, and a rising node count against flat demand is not adoption but a deepening liability. The framework's supply-side test is therefore always per-operator: is the marginal operator's ROI, on realistic fee-plus-emission income net of costs, positive and improving as emissions decay — or is the network adding operators it cannot afford to keep?
Part 5 · The Three Failure Modes
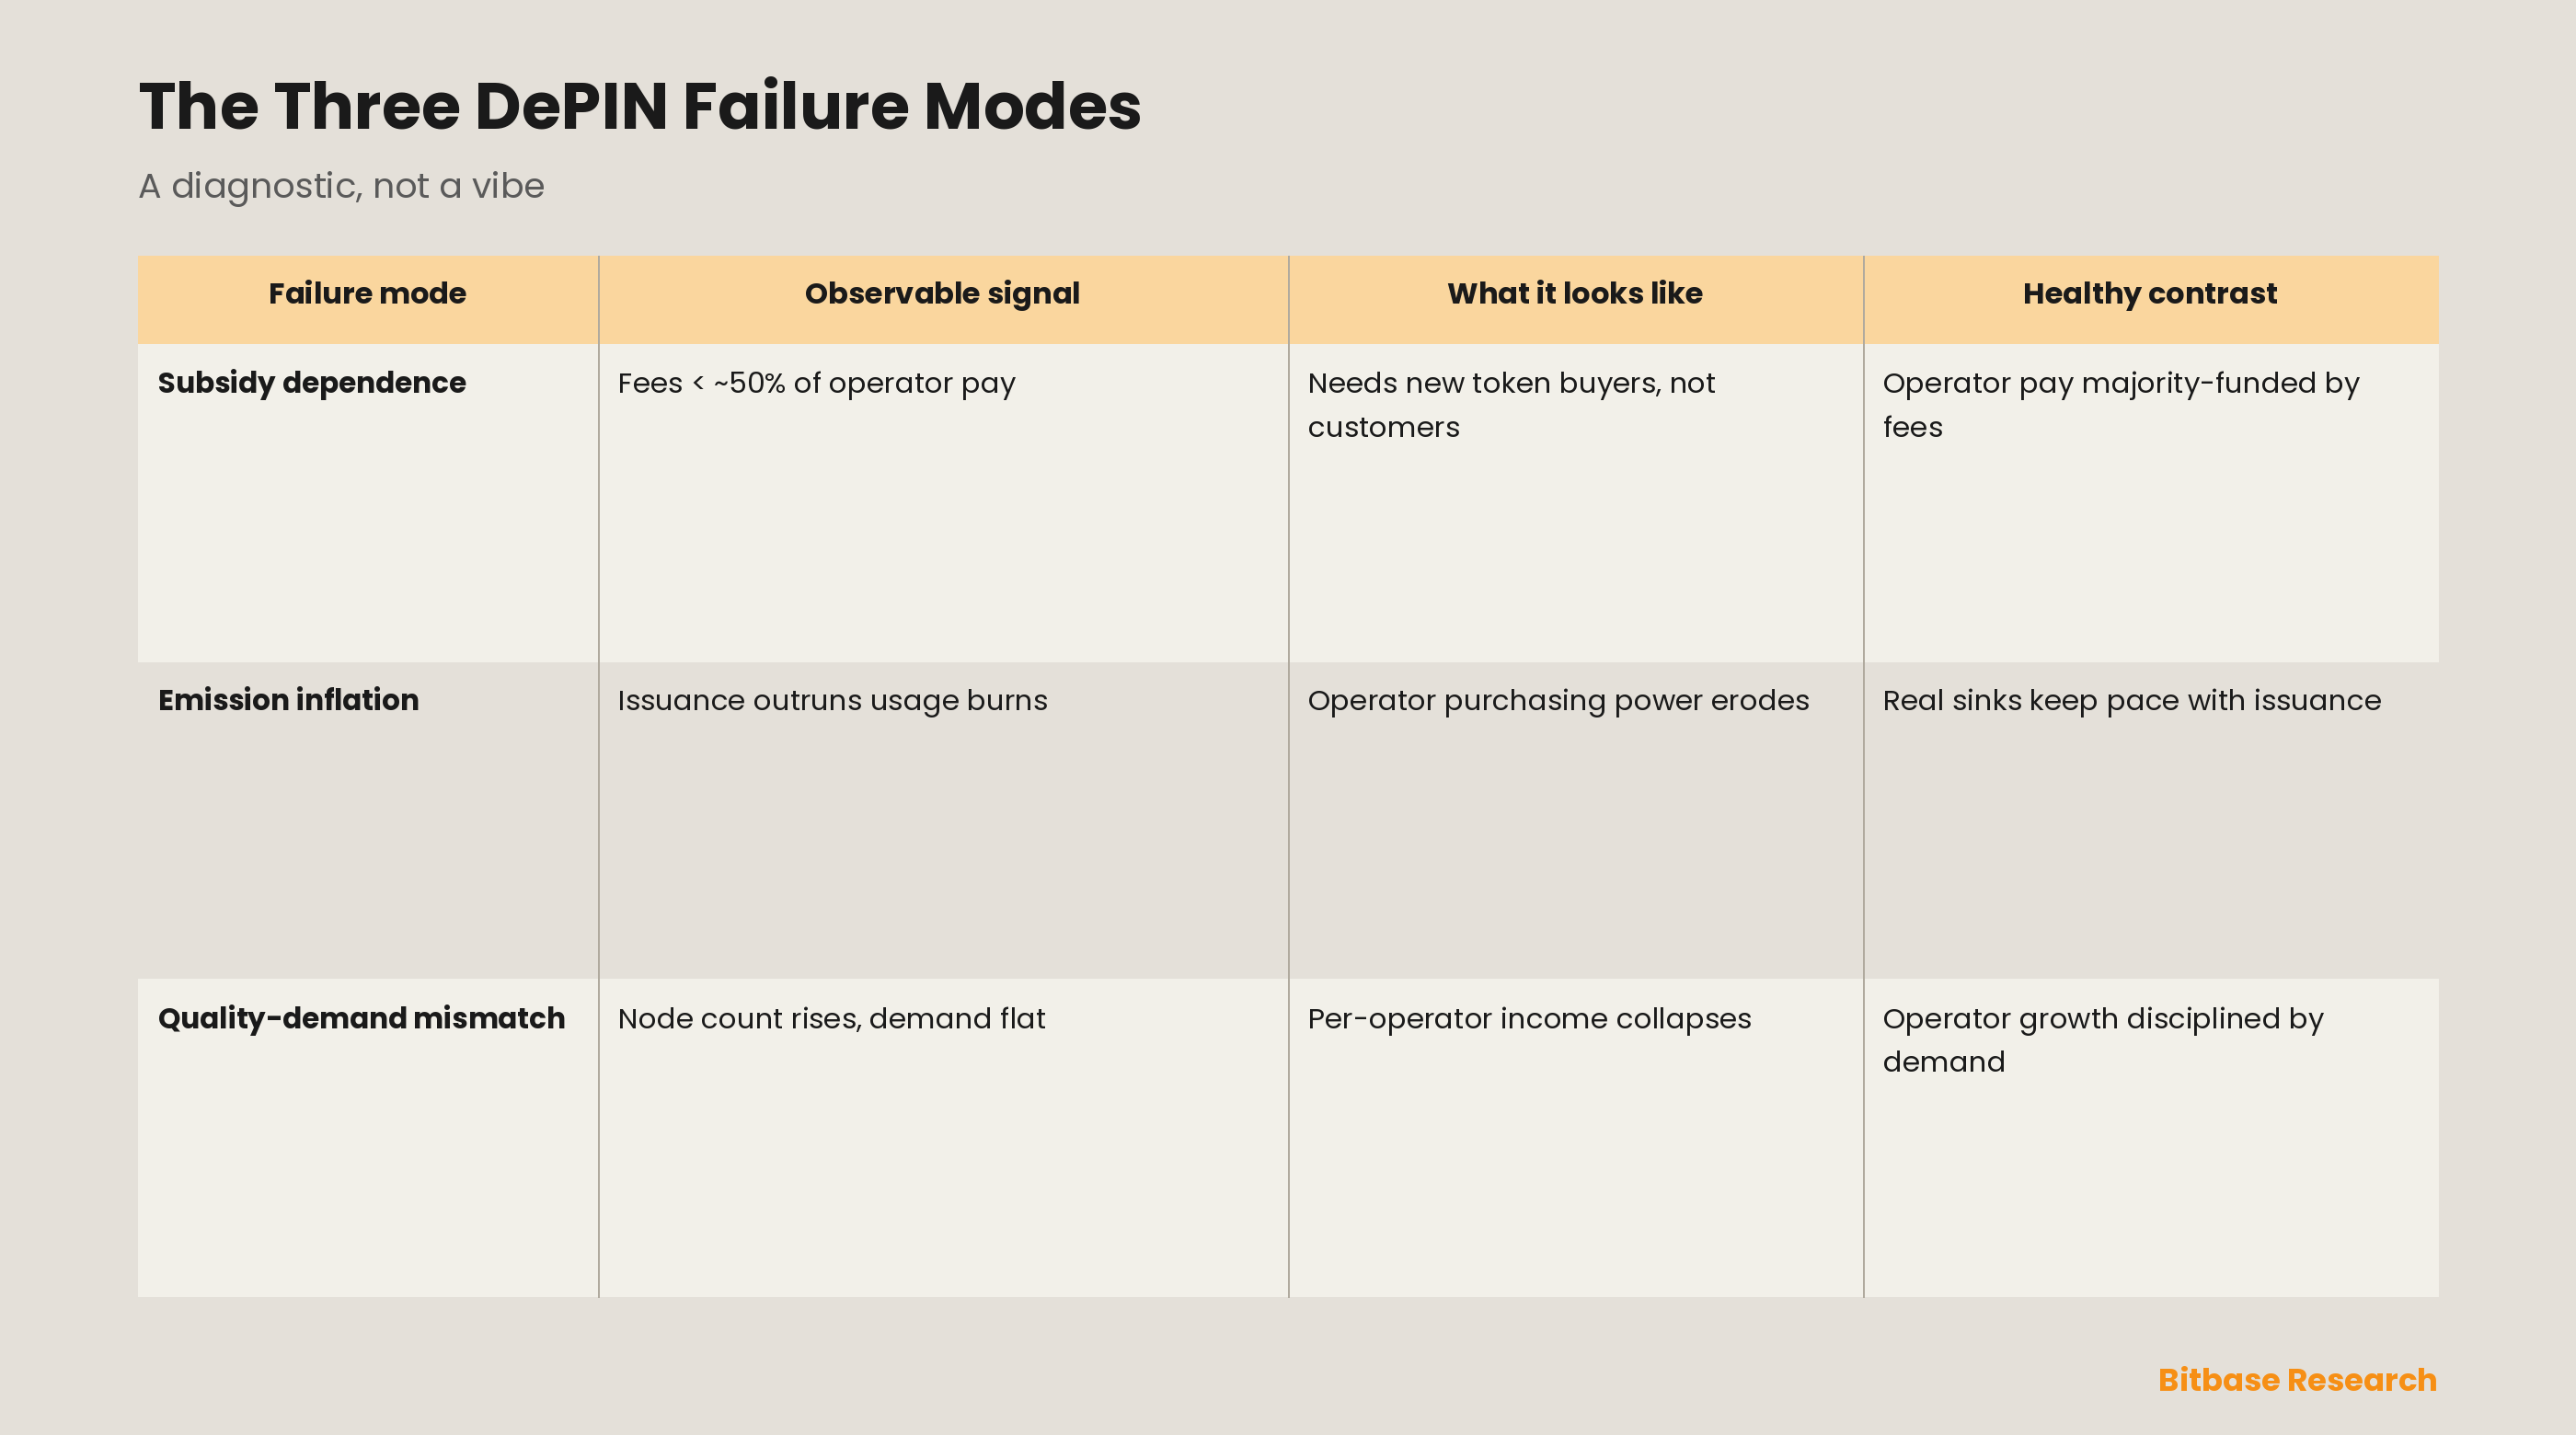
The framework's demand and supply analyses converge on three concrete failure modes, and naming them turns the evaluation from a vibe into a checklist. The first is subsidy dependence: the network requires a continuous supply of new token buyers rather than real customers to sustain reward values, so operator income is ultimately funded by token inflows, not service revenue — the defining property of a subsidy-pushed flywheel, and the one that demand coverage measures directly [8][10]. A network in deep subsidy dependence can post large node counts and even large "revenue" for years, right up until the marginal new buyer stops arriving. The second is emission inflation: the schedule prints tokens faster than usage burns them, eroding operator purchasing power and, past a threshold, triggering the exit cascade of Part 4 [10]. The third is quality-demand mismatch: operator supply, pulled in by early rewards, grows faster than paying demand, collapsing per-operator economics even when headline metrics rise [10].
These three are not independent; they compound. Subsidy dependence makes a network vulnerable to emission inflation, because a network that cannot fund operators from fees has no cushion when emissions must decline; and both feed quality-demand mismatch, because generous early emissions over-recruit operators against demand that subsidy cannot conjure. The healthy contrast is a network that has broken all three at once — one whose operator pay is majority-funded by fees (defeating subsidy dependence), whose token sinks from real usage keep pace with or exceed issuance (defeating emission inflation), and whose operator growth is disciplined by actual demand rather than reward farming (defeating quality-demand mismatch). Akash's move to buy-and-burn on customer payment is a direct structural attack on all three, because it makes real demand, rather than a fixed emission schedule, the thing that sets token scarcity and therefore operator reward value [7]. The framework's contribution is to insist an analyst check each mode separately, because a network can pass one and fail another, and the failure that kills it is usually the one the headline metric hides.
Part 6 · Grading Across the Sector
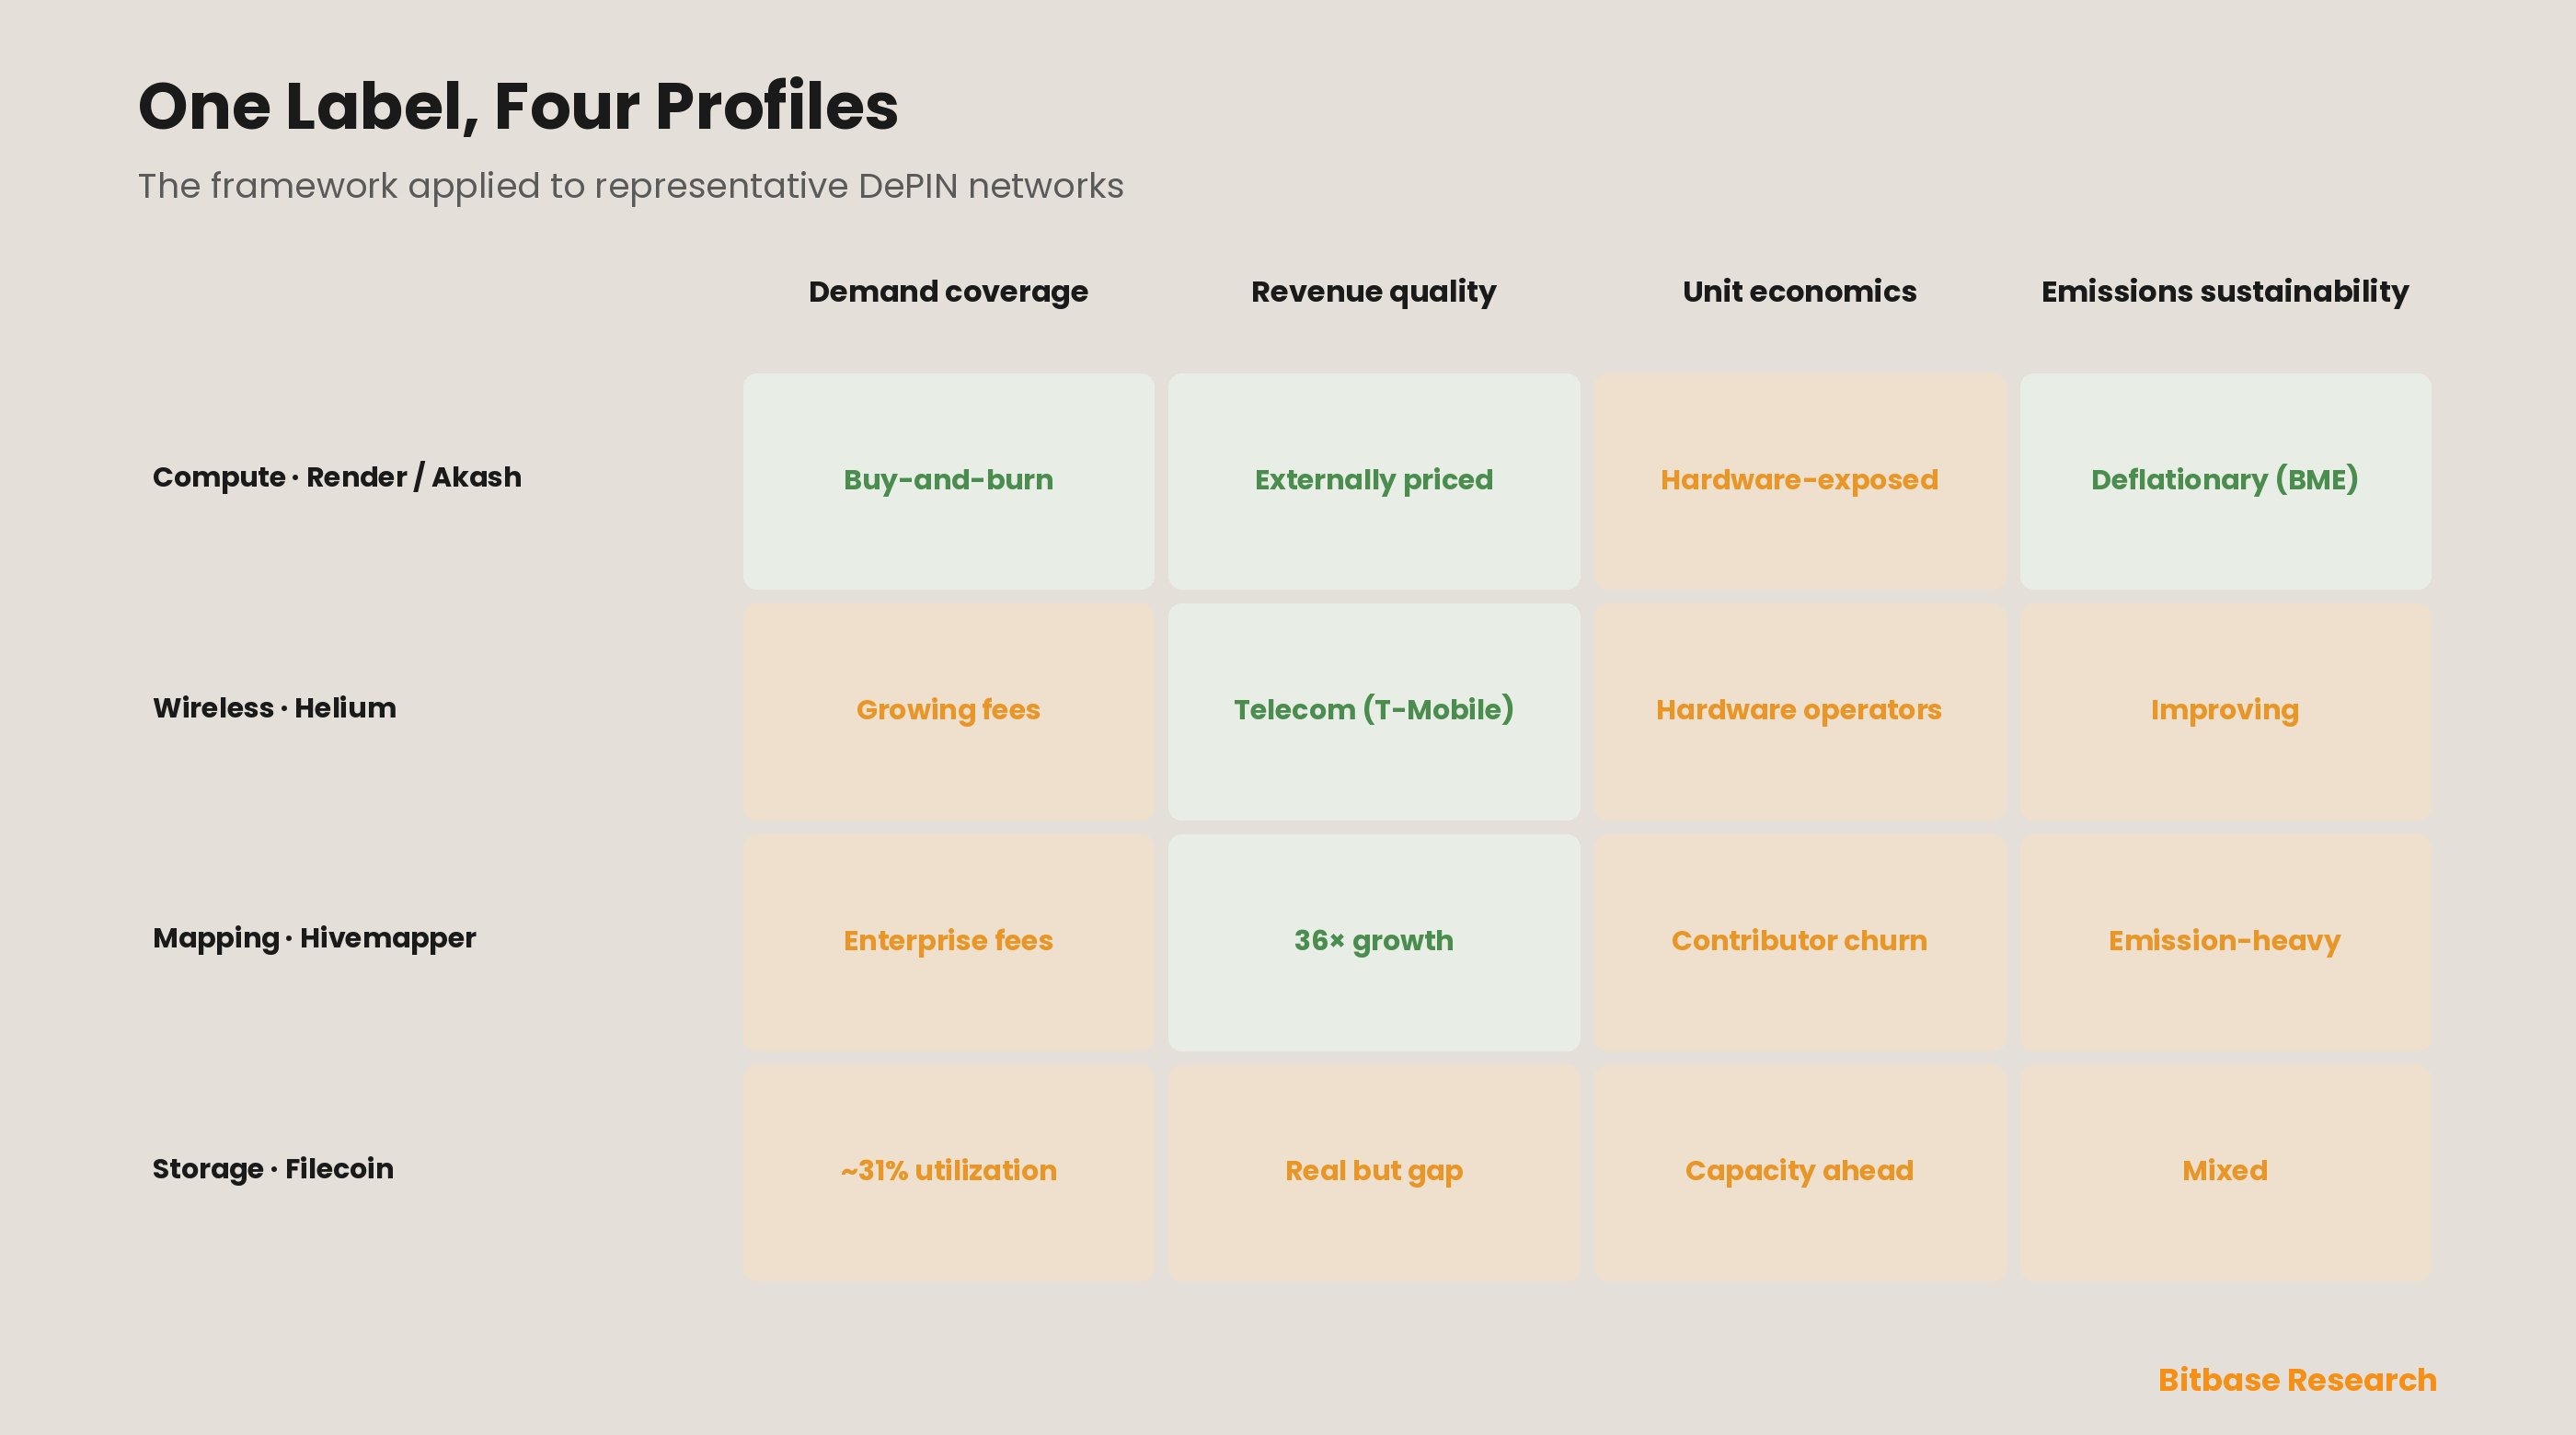
A framework proves itself by grading real networks, and the 2026 DePIN sector finally has enough revenue disclosure to try. The exercise runs each network through the same four questions — demand coverage, demand-side revenue quality, supply-side unit economics, and emissions sustainability — and lets the differences fall out rather than ranking by market cap or node count. Compute networks lead on demand quality because their revenue is externally priced and their pivot to real cash flow is furthest along; Render's roughly US$38 million of monthly revenue and Akash's hard-wired buy-and-burn place them near the revenue-era end of the demand-coverage axis, though the analyst's next step is to confirm the burn is funded by external customers rather than intra-ecosystem recycling [7][17]. Wireless and mapping networks like Helium and Hivemapper score well on demand-side quality — real telecom and enterprise-mapping customers, revenue growing 45% and 36-fold respectively — but must be checked on supply-side unit economics, since physical-hardware operators are the most exposed to emission decay [4][5]. Storage networks like Filecoin present the demand-quality gap directly, with genuine external demand but utilization around 31% of capacity, a signal that supply was built ahead of demand and that per-operator economics depend on that gap closing [6]. The specific grades matter less than the method: four questions, applied identically, separate a network monetizing real demand from one still printing its way to a node count.
Part 7 · Limits and Honest Failure Modes
An evaluation framework earns trust by naming what it cannot do, and this one has clear boundaries. The largest is that DePIN is genuinely early, and real infrastructure legitimately takes years to reach demand-funded operation — a framework anchored in present demand coverage will mark down a network that is correctly using subsidy to build toward large future demand, exactly as a strict revenue screen would have dismissed early cloud or early telecom [3][12]. The demand-coverage ratio is a discipline against subsidy that never transitions, not a verdict against subsidy that is doing its job; it ranks relative health today and must be read alongside a judgment about whether the addressable demand is real and reachable, which no ratio can supply.
Four further limits deserve to be as visible as the framework. Data quality and comparability: "revenue" is reported inconsistently across DePIN — gross versus net of token burns, fiat versus token-denominated, customer versus intra-ecosystem — and demand coverage is only as honest as the revenue figure feeding it, so a network that books recycled tokens as revenue defeats the measure [8][10]. Demand attribution: distinguishing external customers from token-recycled or grant-funded demand often requires data projects do not fully disclose, making the demand-quality axis partly a matter of informed inference rather than clean measurement [1]. Emission-schedule opacity: supply-side unit economics depend on the forward emission curve and operator cost base, both of which vary by hardware and geography and are rarely disclosed cleanly, so the exit-cascade risk is estimated, not observed [10][14]. Sector reflexivity: DePIN trades as a narrative bloc, so networks rise and fall together on sentiment regardless of the fundamentals the framework measures, meaning the edge is in relative selection within the sector rather than timing the theme [1]. As a checklist for ranking networks by the durability of their flywheel, the framework is sharp; as a predictor of any single token's price, it is a probability, not a promise.
Conclusion · Which End Turns the Wheel
DePIN rewards the analyst who asks which end of the flywheel is doing the work. Every network draws the same circle — rewards to supply to service to demand to revenue to token — but only a demand-pulled flywheel is a business, and a subsidy-pushed one is a token that must keep recruiting buyers to pay its operators [8]. The single metric that separates them is demand coverage, the share of operator pay funded by real fees rather than emissions, with the revenue era beginning where that share clears roughly half [11]. Around it, demand-side quality asks whether the fees come from external customers or recycled tokens, and supply-side unit economics asks whether the marginal operator's ROI survives the emission decay that every subsidy schedule builds in [5][10]. Run every network through the same four questions, watch for the three failure modes — subsidy dependence, emission inflation, quality-demand mismatch — and treat a rising node count against flat demand not as adoption but as the exit cascade waiting to happen.
The deeper primitives these judgments rest on — how token emissions and vesting are engineered, how a network's circulating supply and fully diluted value diverge, and how burn-and-mint or fee mechanisms actually accrue value from usage to the token — are each worth understanding in their own right, because the demand-coverage read is only as good as the reader's grasp of the tokenomics underneath it. Treat the framework as a discipline for ranking DePIN networks by whether real demand or printed emissions turns their flywheel, never as a price forecast, and always alongside a judgment about the size and reachability of the demand no supply metric can conjure.
References
[1] KuCoin, DePIN Crypto Sector 2026: How Decentralized Physical Infrastructure Surpassed Oracles; SpotedCrypto, DePIN Sector Guide 2026. kucoin.com
[2] BlockEden.xyz, DePIN March 2026 Reality Check: 650 Projects, $19B Market Cap, Revenue; pen-caforr, DePIN 2026: Helium, Hivemapper, and the $15B Decentralized Infrastructure Boom (~$150M/month real revenue). blockeden.xyz
[3] World Economic Forum, DePIN total addressable market projected to surpass US$3.5 trillion by 2028 (cited in sector guides). spotedcrypto.com
[4] Helium Network revenue: US$13.32M annualized (2025), ~US$12M Q1 2026 (+45% YoY), T-Mobile / DISH partnerships. alphagaindaily.com
[5] Hivemapper revenue growth from ~US$500K (Aug 2025) to ~US$18M annualized (early 2026), enterprise mapping demand. pen-caforr.org
[6] Filecoin: market cap ~US$1.74B, 687M FIL circulating, network utilization ~31% of built capacity. alphagaindaily.com
[7] Akash Network Burn-Mint Equilibrium (March 2026): automatic buy-and-burn of AKT on customer payment, deflationary demand-linked model. blockeden.xyz
[8] KuCoin, Understanding the Crypto Investment Flywheel: DePIN, AI & RWA; CryptoAdventure, Why DePIN Tokenomics Are Harder Than They Look (demand-pull vs supply-push; durability). kucoin.com
[9] Coinpaprika, DePIN & Tokenized Infrastructure: Where Physical Meets Digital (fiat-denominated usage credits via token burn; Data Credits model). coinpaprika.com
[10] CryptoAdventure, Why DePIN Tokenomics Are Harder Than They Look (three failure modes: subsidy dependence, emission inflation, quality-demand mismatch). cryptoadventure.com
[11] SpotedCrypto / sector analyses: service fees exceeding ~50% of operator compensation mark the transition from "subsidy phase" to "revenue era." spotedcrypto.com
[12] Blockworks Research, Decentralized Physical Infrastructure Networks: Embracing the Power of Token Incentives to Bootstrap Networks. app.blockworksresearch.com
[13] Decentralized Physical Infrastructure Networks (DePIN) Tokenomics, ResearchGate working paper (economic architecture of DePIN incentives). researchgate.net
[14] Blockchain Council, Tokenomics 101: Designing Supply, Vesting, Emissions, and Incentives for Sustainable Growth. blockchain-council.org
[15] BlockEden.xyz, DePIN's Revenue Pivot: From Token Subsidies to Real AI Compute Revenue, April 12, 2026. blockeden.xyz
[16] RZLT, 7 DePIN Projects Generating $10M+ Revenue (and What You Can Learn From Them). rzlt.io)
[17] Own Your Mind, Render vs Akash vs io.net 2026: Revenue, Burns & Tokenomics (Render ~US$38M monthly revenue). ownyourmind.ai
[18] AInvest, DePIN and Crypto Gaming as 2026's Undervalued Rebound Play (pricing resilience of cash-flow networks in consolidations). ainvest.com
[19] BingX, What Are the Top 10 DePIN Crypto Projects to Know in 2026? (sector map across compute, wireless, storage, mapping, energy). bingx.com
[20] Altrady, DePIN Explained: A 2026 Guide for Crypto Traders (node counts, subsector definitions). altrady.com
[21] CoinMarketCap, Token Unlocks and Vesting Schedules (emission and vesting context underlying DePIN supply). coinmarketcap.com
[22] Messari, State of DePIN research (sector revenue and node metrics methodology). messari.io
Methodology and disclosure: This report synthesizes public DePIN sector data as of early-to-mid 2026 (token market capitalization ~US$19B across ~650 projects and 2M+ nodes [1][2]; ~US$150M monthly on-chain revenue [2]; the WEF ~US$3.5T 2028 TAM projection [3]; project figures for Helium [4], Hivemapper [5], Filecoin [6], Akash [7][15] and Render [17]) and the DePIN tokenomics literature (the demand-pull-vs-supply-push flywheel [8], burn-mint / usage-credit mechanics [9], the three failure modes [10], the ~50% demand-coverage threshold [11], and incentive-bootstrapping theory [12][13][14]). The demand-coverage metric, the demand-quality and emissions-sustainability axes, and the three-failure-mode diagnostic are educational, ordinal analytical constructs for ranking relative flywheel durability within the DePIN sector; the network positions shown in the figures are illustrative of the framework rather than precise measurements, and the cited numbers illustrate the framework rather than forecast any token's price. Nothing here is a rating, a recommendation, or a price target.
Disclaimer: This is educational content from Bitbase Research, provided for informational purposes only. It is not investment, trading, tax, or financial advice. Written as of July 2026; DePIN network revenues, node counts, emission schedules and market conditions change continuously, so always rely on the latest primary data and do your own research before making any decision.