Publication date: July 23, 2026 · Bitbase Research
For related Bitbase Research on this subject, see The Dual-Track Divergence of Crypto Derivatives Infrastructure.
Executive Summary
The crypto derivatives book has grown large enough that it now predicts its own unwind. With perpetual-futures open interest above US$80 billion across the top venues in 2026, the leverage layer is no longer a sideshow to spot — it is where the market's conviction is financed, and a financed conviction leaves a trail [1][2]. That trail is readable in four public signals: the funding rate that reveals which side is paying to hold its position, the open interest that reveals how much capital is committed to it, the ratio of spot to derivatives volume that reveals whether a move is backed by real buying or only by leverage, and the liquidation map that reveals where forced exits are stacked. Read separately, each is a familiar indicator. Read together as a positioning-stress model, they flag the setups where the market is most likely to be forced to move — the squeeze.
The core insight is that a crowded, one-sided, leverage-financed position is not a strong hand but a fragile one, because the same leverage that expresses conviction also mandates the exit. When funding turns sharply negative — as it did in early 2026, dropping to about −6% and matching the most negative reading in three months — it is not simply "bearish": it is a signal that shorts are crowded and paying dearly to stay short, which is the precise fuel for a short squeeze if price stops falling [3]. The mirror configuration, positive funding with longs crowded above their liquidation clusters, is the fuel for a downside cascade. The positioning-stress model exists to distinguish a trend that is confirmed by rising open interest and healthy spot participation from one that is merely crowded and financed by leverage that must eventually unwind — and to locate, on the liquidation map, the price levels where that unwind will accelerate.
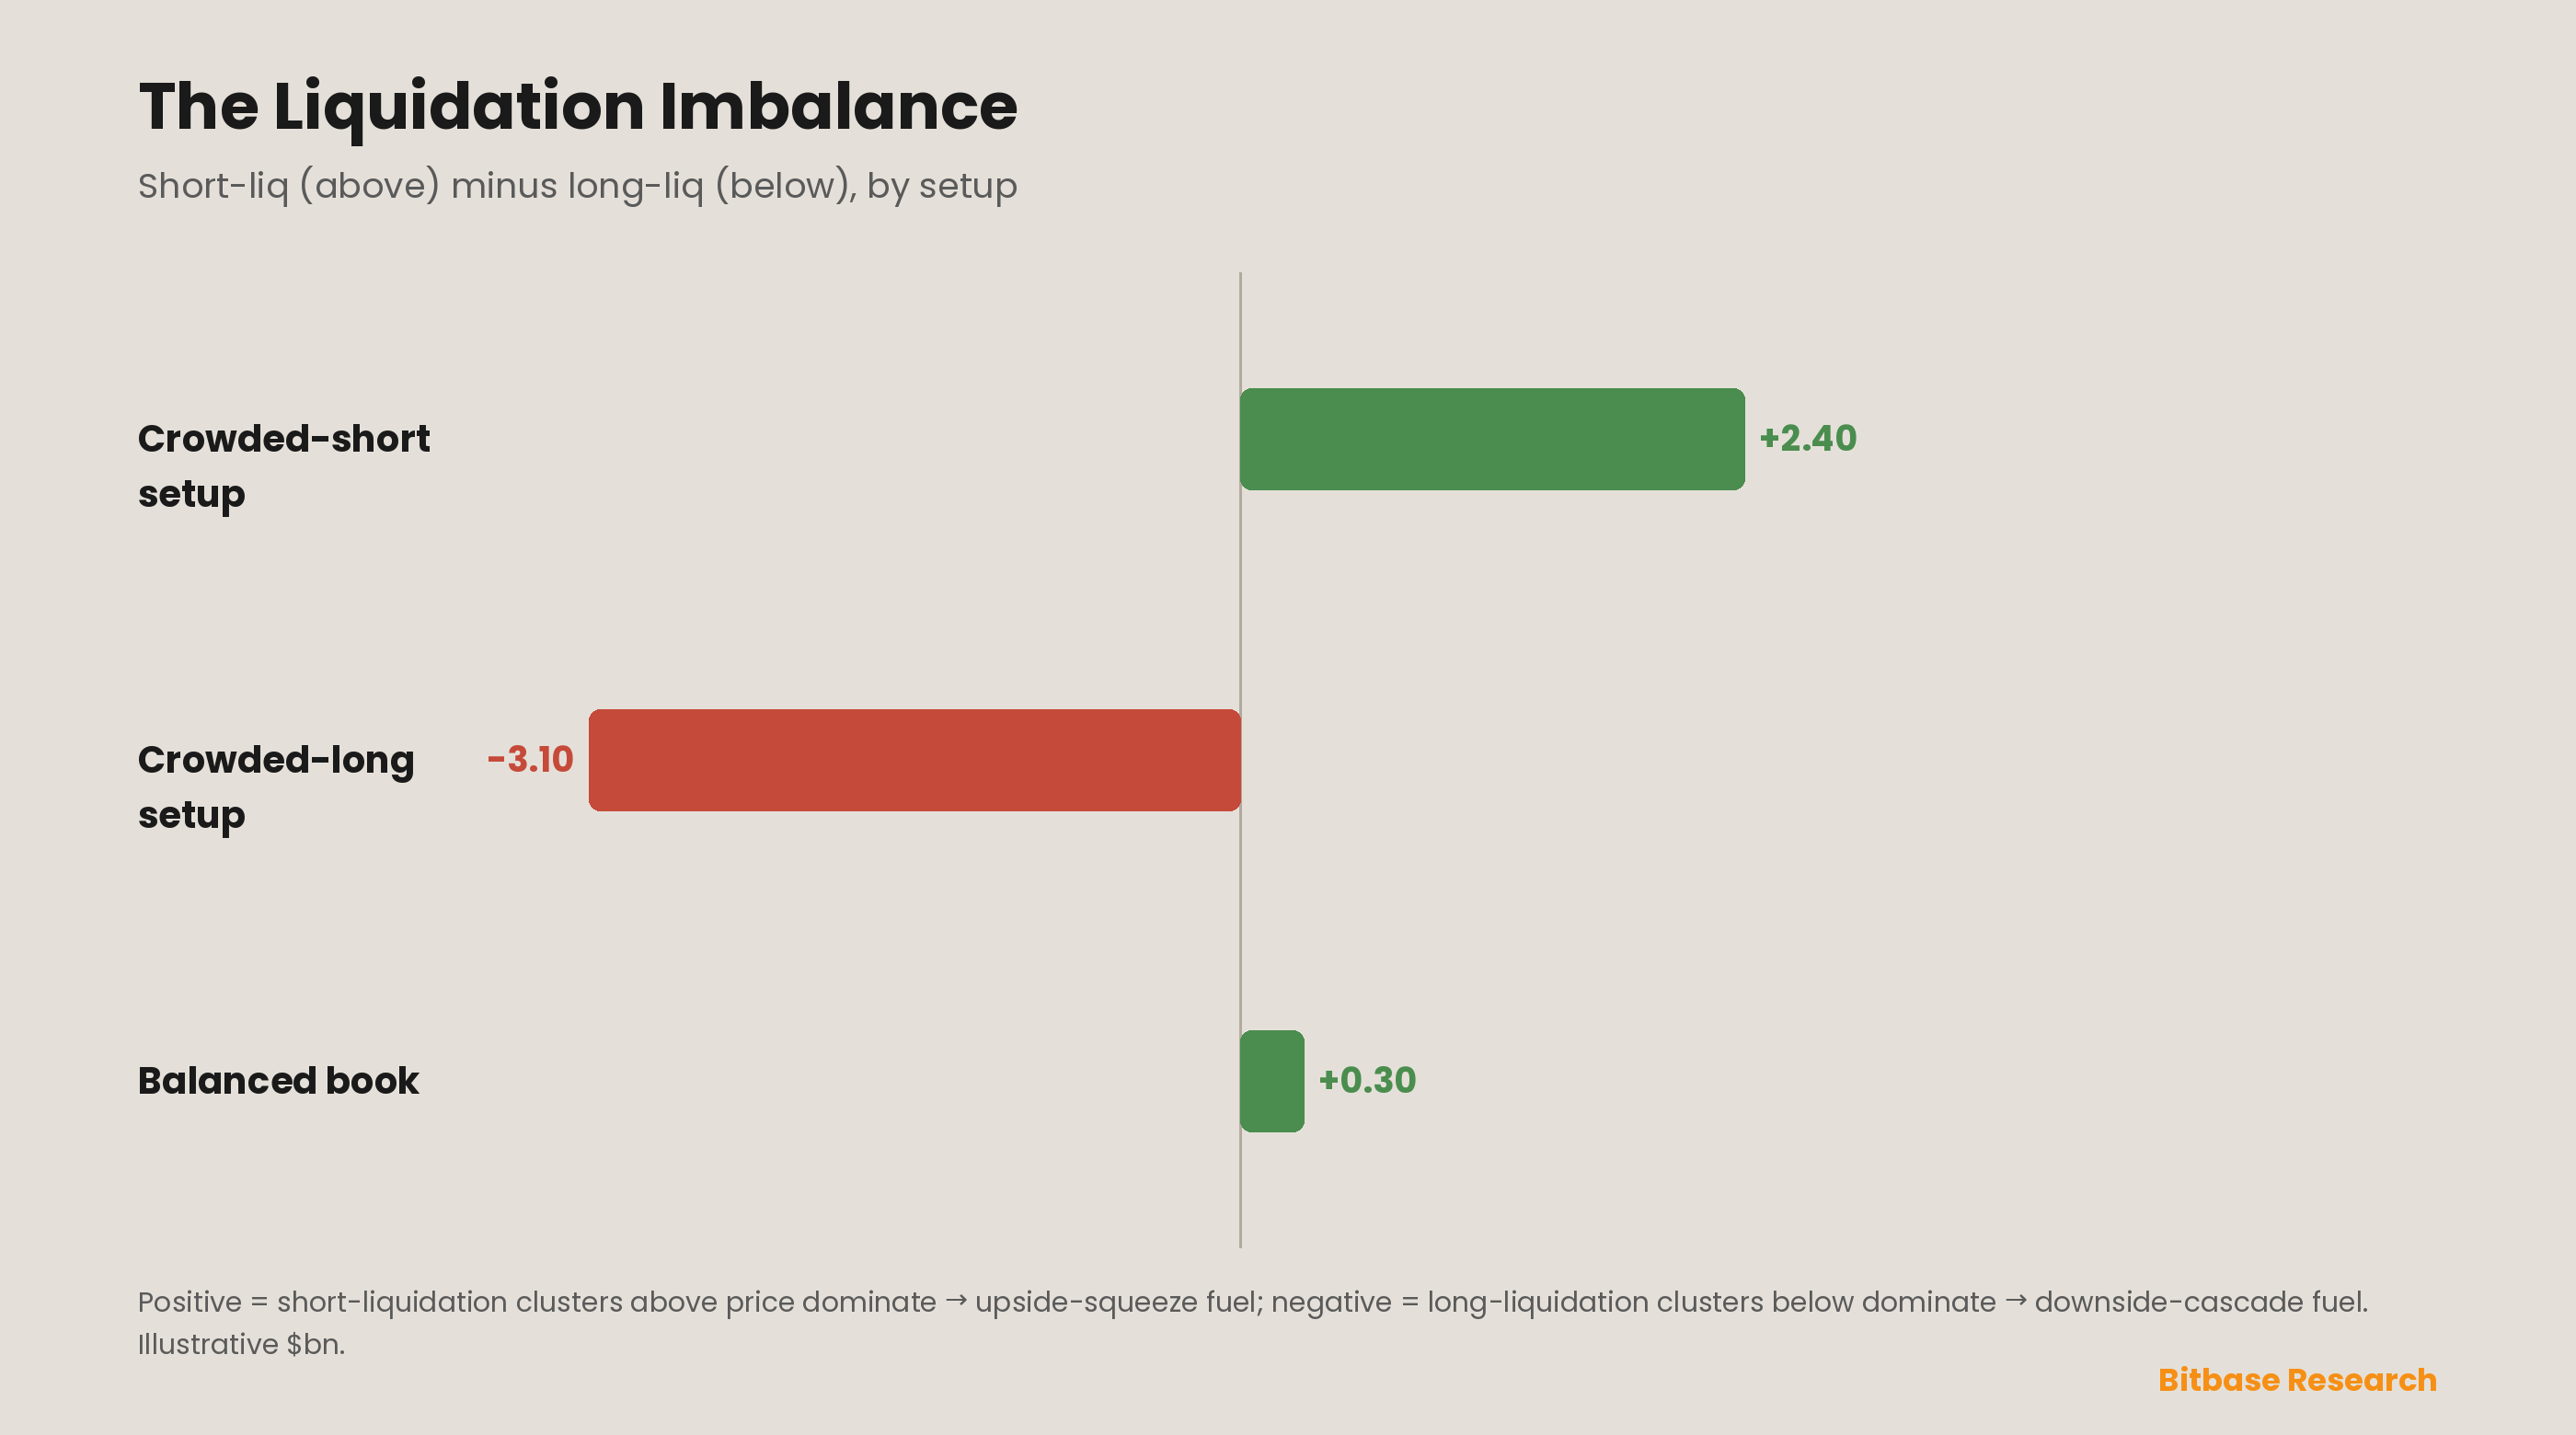
This report builds the model from its four components and shows how they combine. The single most underused of them is the liquidation imbalance: when the bright bands of long-liquidation dollar volume below price dwarf the short-liquidation bands above, the leverage book is long-biased and vulnerable to a downside cascade, and the opposite clustering precedes upside squeezes [4][6]. Around it, funding-rate divergence times the crowd, open-interest build-up sizes it, and the spot-to-derivatives volume ratio checks whether the move has any real demand underneath. The output is not a price forecast but a stress reading — a way to flag when the derivatives book is loaded for a violent move and in which direction the forced flow will run. Everything here is educational analysis, not investment advice.
Part 1 · Positioning Stress: Why the Book Predicts Its Own Unwind
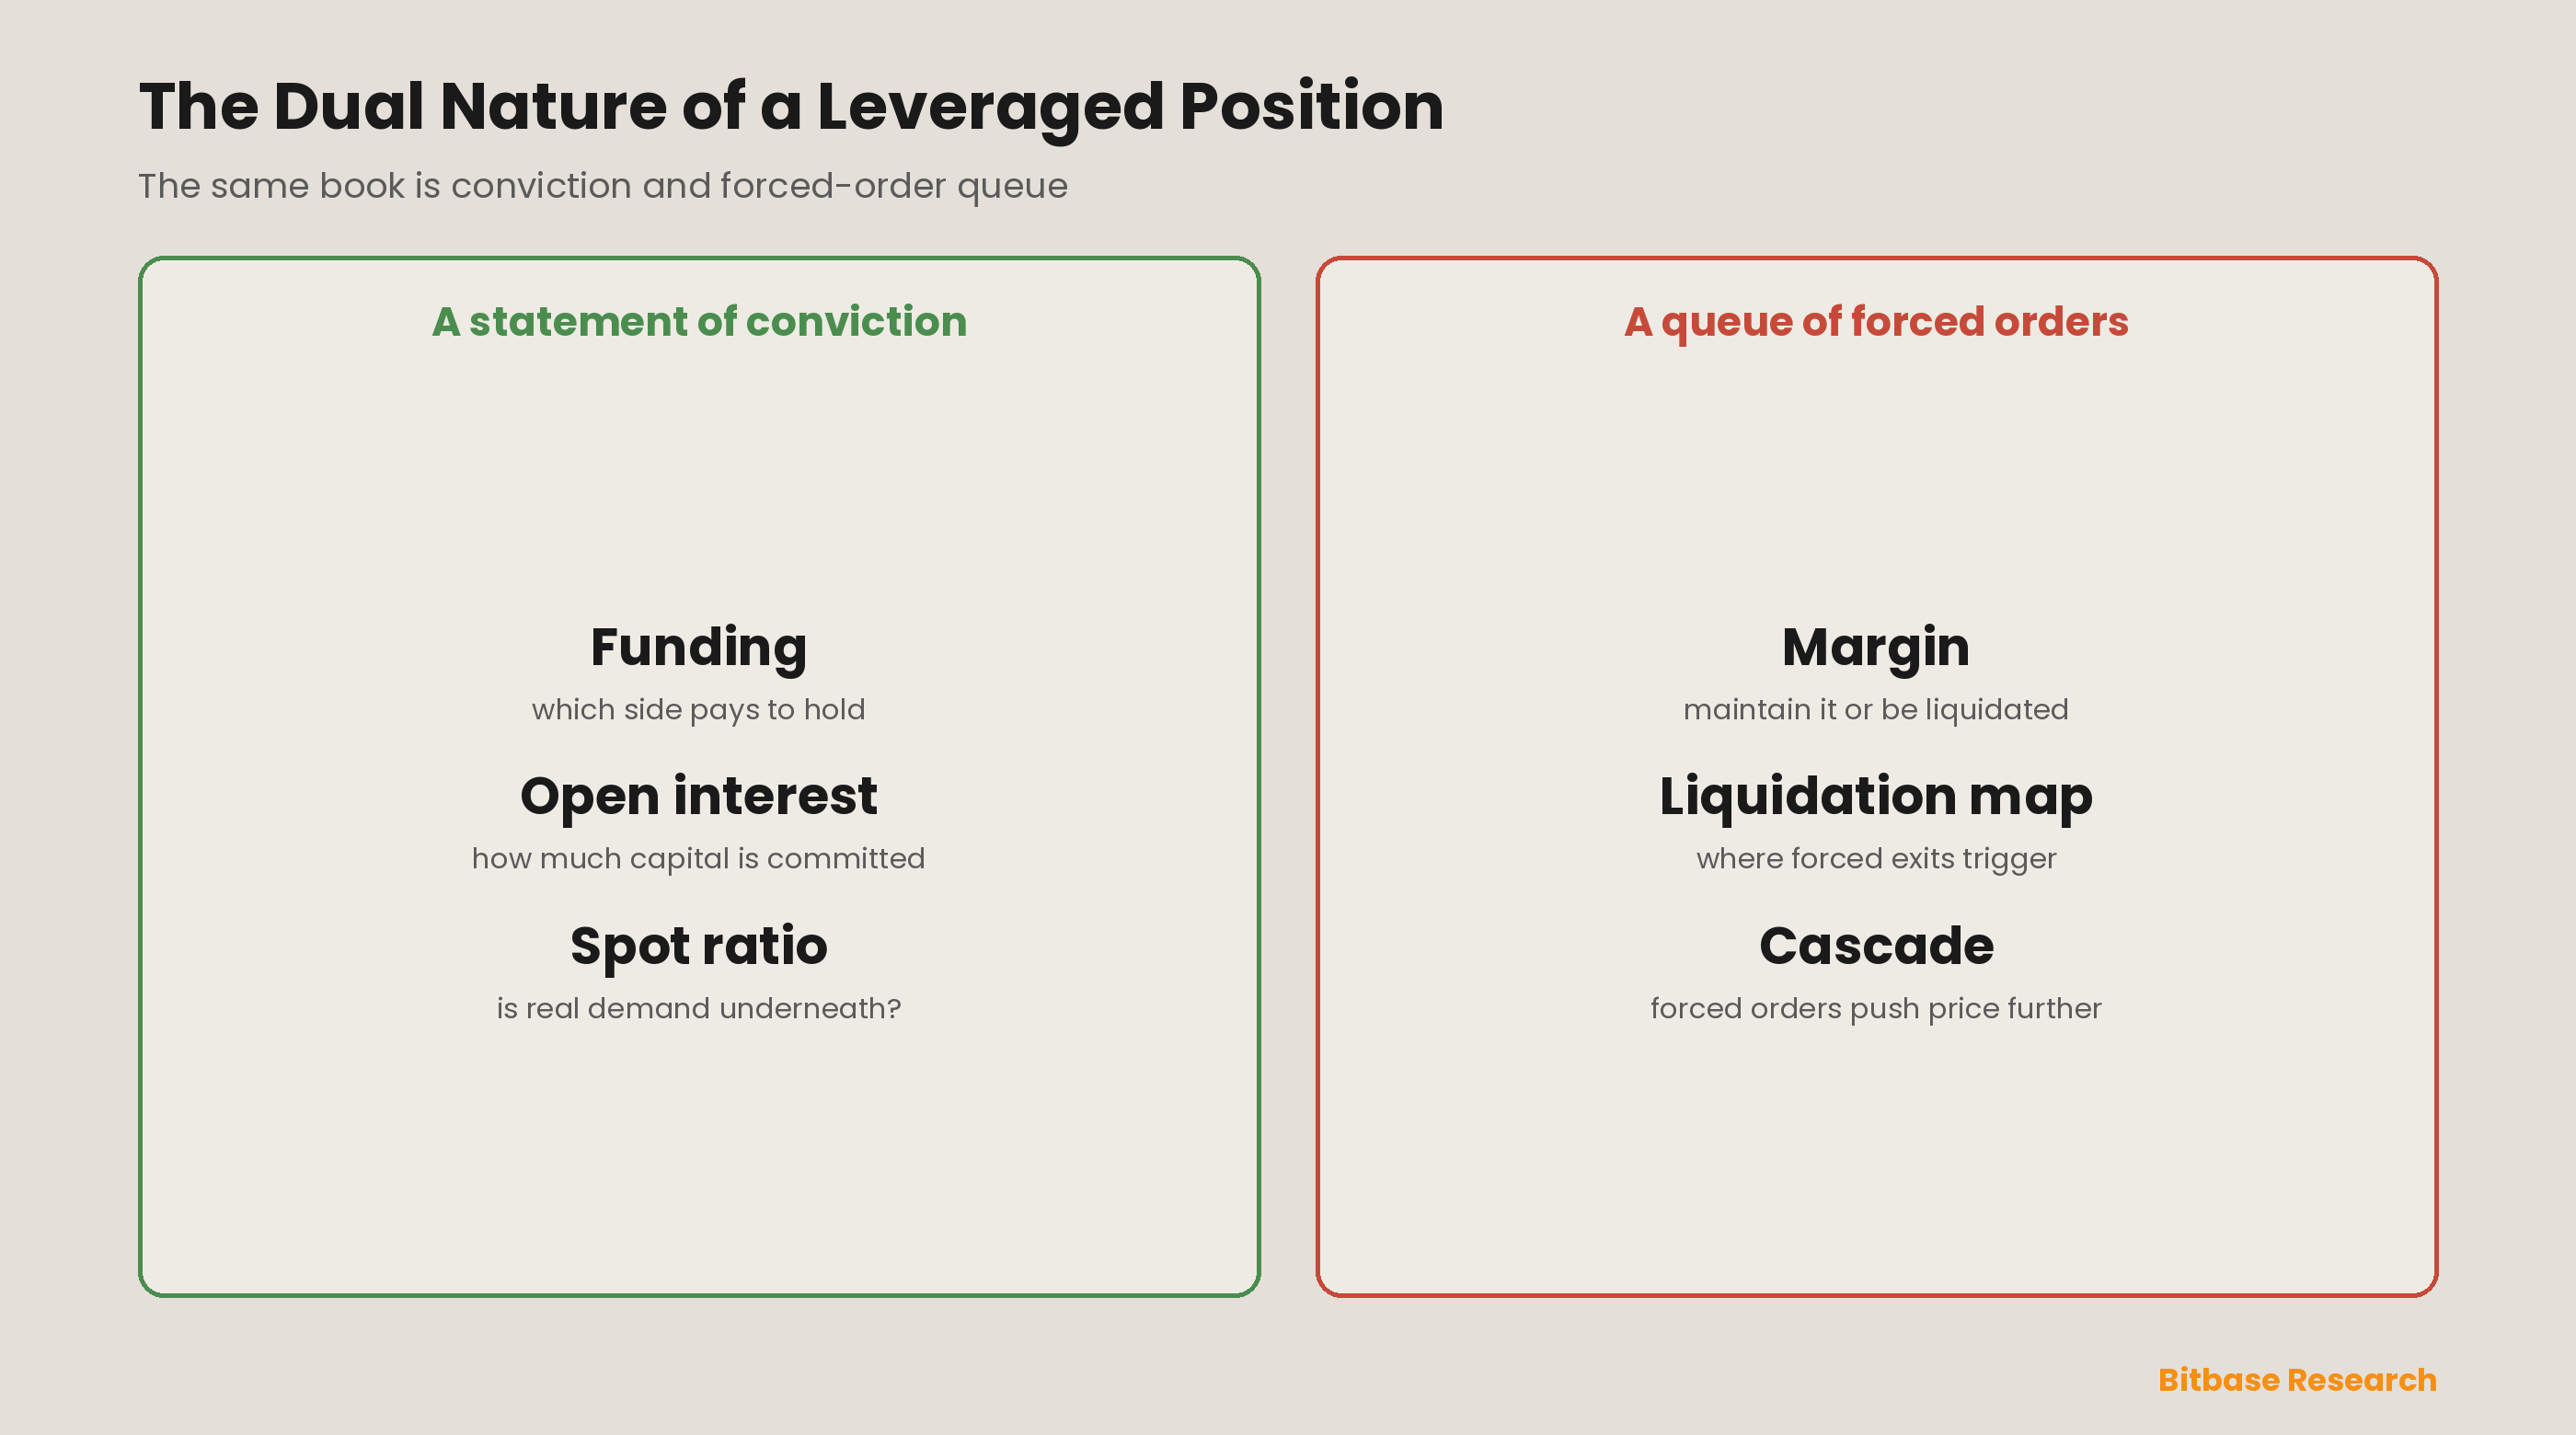
Precision about what a derivatives position is comes before any signal built on it. A perpetual future is a leveraged, expiryless bet tethered to spot by the funding mechanism, and a leveraged position carries an obligation the underlying asset does not: it must maintain margin, and if it cannot, it is liquidated — closed by force at the market, regardless of the holder's conviction [7][12]. This is the property that makes the derivatives book self-predictive. A large, one-sided, highly leveraged position is simultaneously a statement of conviction and a queue of forced orders waiting for a price trigger, and the market can see the queue. Positioning stress is the measure of how loaded that queue is and how close price sits to setting it off.
The reason this matters more in crypto than almost anywhere else is the sheer size and visibility of the leverage layer. With perpetual open interest above US$80 billion and every major venue publishing funding, open interest and liquidation data in near real time, the positioning of the crowd is not a secret to be inferred — it is a public dataset, aggregated by tools like CoinGlass into funding heatmaps, open-interest series and liquidation maps [1][2]. That transparency changes the game: sophisticated participants and algorithms actively hunt the "hidden liquidity" that the liquidation map reveals, pushing price toward the levels where the largest clusters of forced exits will trigger, because a forced exit is a guaranteed counterparty [4]. The positioning-stress model is, in effect, an attempt to read the same map the hunters read — to see where the book is fragile, how it got that way, and what would break it — rather than to predict price from fundamentals it does not depend on in the short run.
Part 2 · Funding Rates: The Price of the Crowd
The funding rate is the first component because it prices the crowd directly. Funding is the periodic payment exchanged between longs and shorts that tethers the perpetual to spot: when the perpetual trades above spot, funding is positive and longs pay shorts; when it trades below, funding is negative and shorts pay longs [7]. The sign tells you which side is dominant and paying to stay there, and the magnitude tells you how expensive that conviction has become. Extreme funding is therefore not a directional signal in the naive sense — it is a crowding signal, and crowding is a setup for reversal. Early 2026 supplied the textbook case: funding dropping to about −6%, the most negative in three months, meant shorts were crowded and paying heavily, which is exactly the condition that precedes a short squeeze if price refuses to fall further [3][10].
Two refinements turn funding from a blunt sentiment gauge into a positioning signal. The first is divergence across venues: funding is set independently on each exchange, capped differently — some at 0.05% per interval, others at 1% or more — so a token whose funding is extreme on one venue but neutral on another is positioned differently than one whose funding is extreme everywhere, and cross-exchange divergence is itself a signal of where the crowding is concentrated and how fragile it is [9]. The second is funding read against open interest, taken up in Part 3: rising funding alongside rising open interest confirms that the crowd is growing and financed, while extreme funding against falling open interest suggests the trend is losing participation and the crowd is thinning — a very different setup [8]. The practical tell that a squeeze is brewing is not extreme funding alone but extreme funding that begins to flip: when price stabilizes after a one-sided run and funding starts neutralizing, the paying side is capitulating, and the unwind of their positions is the squeeze [10]. Funding, in short, tells you who is crowded and how much they are paying to stay; the rest of the model tells you how big they are and where they break.
Part 3 · Open Interest: How Much Conviction Is Financed
Funding names the crowded side; open interest sizes it. Open interest is the total value of outstanding derivatives contracts — the amount of capital committed to open positions — and its change is the second component because it distinguishes a real trend from a leveraged one [11]. The canonical reading is a two-by-two: rising price with rising open interest is a trend financed by new positioning and therefore has fuel and fragility both; rising price with falling open interest is a move on position-closing that is running out of participants; and the same logic inverts for down moves. Crucially, open interest is what converts a funding signal into a stress signal — a large open interest with one side paying heavily means the market is financed in a particular, lopsided way, and it is the size of that commitment that determines how violent the unwind will be if volatility spikes and margin fails [8].
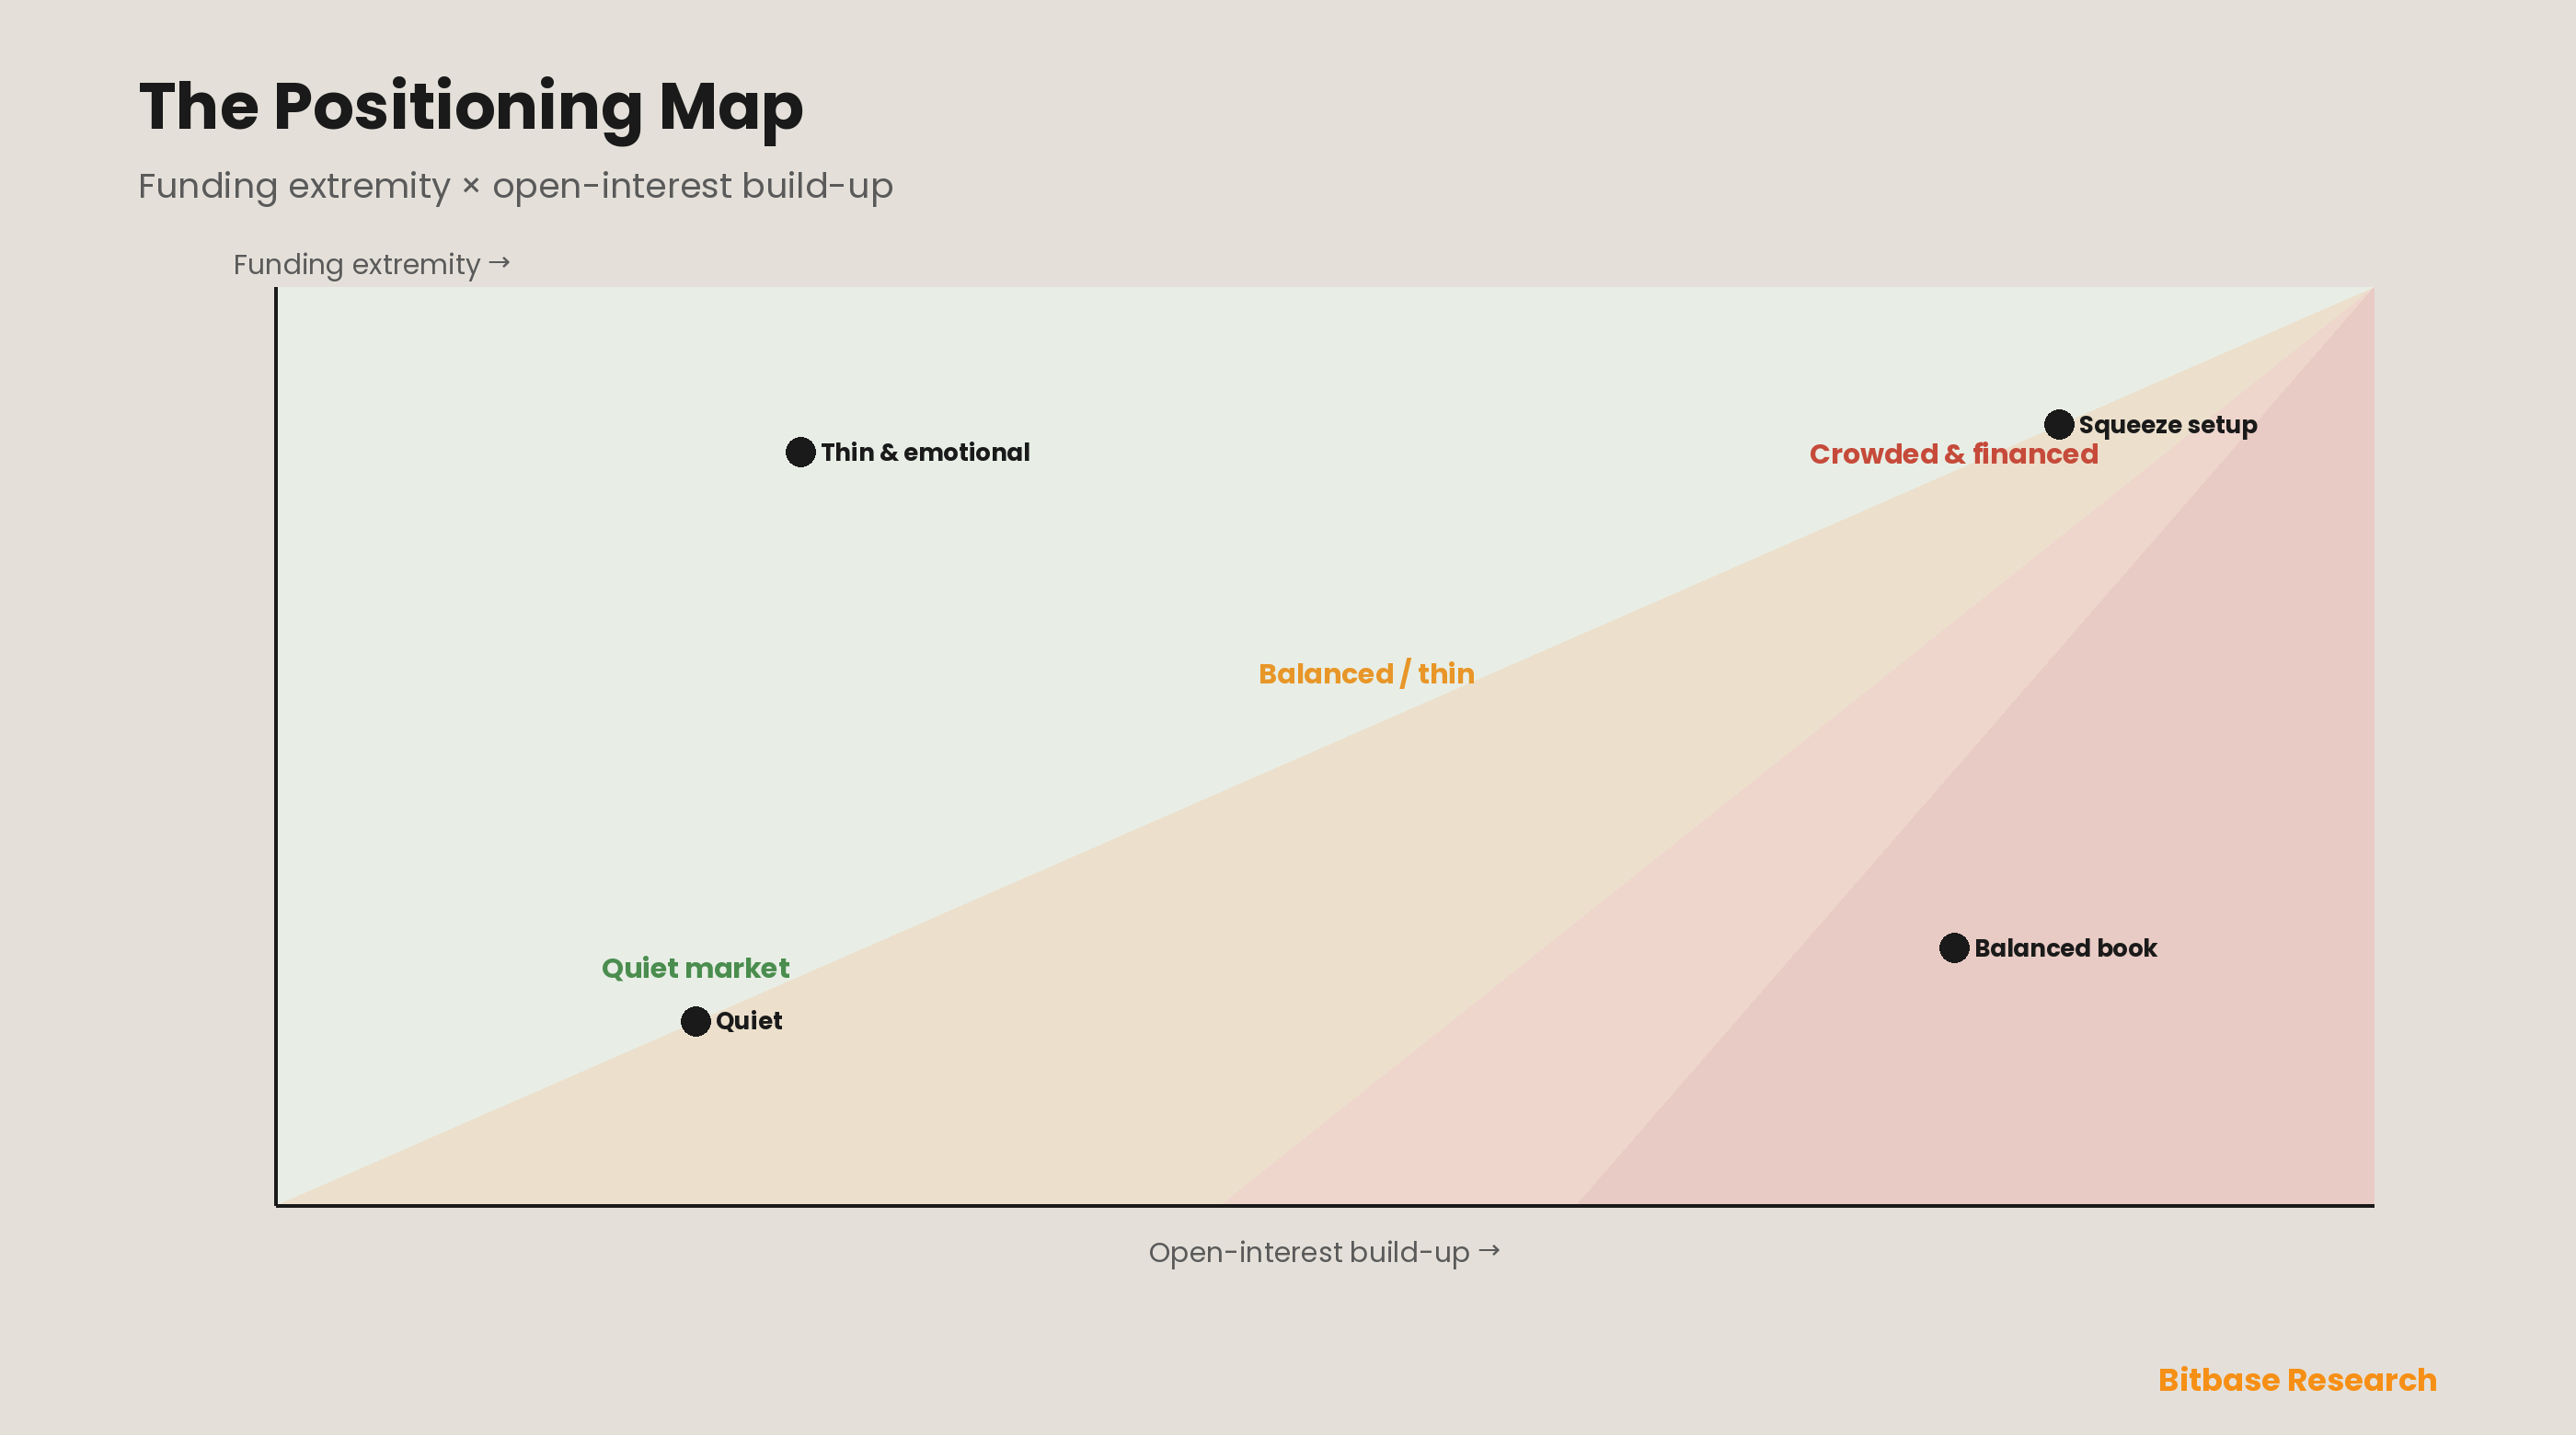
Read together, funding and open interest form the heart of the positioning-stress model, because their combination separates the four states that matter. High open interest with extreme funding is a crowded, financed position — maximum stress, primed for a squeeze in the direction opposite to the crowd. High open interest with neutral funding is a balanced large book — liquid but not obviously fragile. Low open interest with extreme funding is a thin, emotional move — volatile but lacking the mass to cascade. Low open interest with neutral funding is a quiet market. Plotting the two axes together locates any token in this space and turns two familiar indicators into a single positioning read, which is why the model treats funding and open interest not as separate signals but as coordinates. The danger quadrant — high open interest, extreme funding — is where the squeeze lives, because it is the only state in which a large, one-sided, leverage-financed crowd is both big enough to move the market when it unwinds and stressed enough to be forced to.
Part 4 · The Spot/Derivatives Volume Ratio: Real vs. Leveraged Flow
The third component is the reality check the first two cannot supply on their own: the ratio of spot to derivatives volume, which tests whether a move is backed by real buying or only by leverage. Funding and open interest describe the derivatives book in isolation, but a price move driven by genuine spot demand is structurally different from one driven purely by perpetual leverage — the former has an owner who paid in full and need not sell, the latter has a borrower who must maintain margin. When derivatives volume dwarfs spot volume on a given move, the move is leverage-led, and leverage-led moves are the ones most exposed to the positioning stress the rest of the model measures, because they are financed by exactly the contracts that can be force-closed [13]. When spot volume keeps pace or leads, the move has real demand underneath it and is far less likely to reverse on a liquidation cascade.
This ratio is what saves the model from mistaking a crowded derivatives book for a doomed one. A high open interest and extreme funding are only a squeeze setup if the move lacks spot support; the same leverage build-up riding a genuine spot-led trend can persist far longer, because the underlying demand keeps refinancing it. The spot-to-derivatives ratio is therefore the model's demand filter: it downgrades a scary-looking positioning-stress reading when real buying is present and upgrades it when the move is revealed to be leverage all the way down. In practice it is also the component most degraded by data quality — spot volume is inconsistently reported across venues and inflated by wash trading on some — so it is best read as a coarse regime indicator (spot-led, balanced, or leverage-led) rather than a precise number, a caution Part 8 develops. But even coarsely, it answers the one question funding and open interest cannot: is there anyone underneath this move who does not have to sell?
Part 5 · Liquidation Clustering: The Map of Forced Exits
The fourth component turns the abstract stress of the first three into specific price levels, and it is the single most underused signal in the set. A liquidation map transforms the exchange's open-interest, leverage and margin data into a visual overlay on the price chart, showing where clusters of positions will be force-liquidated if price reaches them — the "hidden liquidity" that sits below price as long-liquidation clusters and above price as short-liquidation clusters [4]. These clusters are magnets, because a forced liquidation is a guaranteed market order in a known direction, and price is regularly pushed toward the largest clusters precisely because the liquidity there is certain [4]. The map does not predict direction on its own, but it locates the levels where a move will accelerate, because breaking into a cluster triggers forced orders that push price further into the cluster — a self-reinforcing cascade.
The underused refinement is the imbalance between the two sides. When the dollar volume of long-liquidation clusters below price significantly outweighs the short-liquidation clusters above, the leverage book is long-biased and vulnerable to a downside cascade: a modest drop into the long clusters forces selling that deepens the drop [6]. When short-liquidation clusters above price dominate, the book is short-biased and set up for an upside squeeze — the mirror image, and the configuration that made early 2026's deeply negative funding so combustible [3][6]. This imbalance is the bridge between the positioning read of Parts 2–3 and an actual trade thesis, because it converts "the crowd is stressed" into "the crowd breaks at this level, in this direction, with this much force." A liquidation cascade, once triggered, is the most violent expression of positioning stress, and the map is the only one of the four components that says where it will happen.
Part 6 · The Composite Positioning-Stress Model
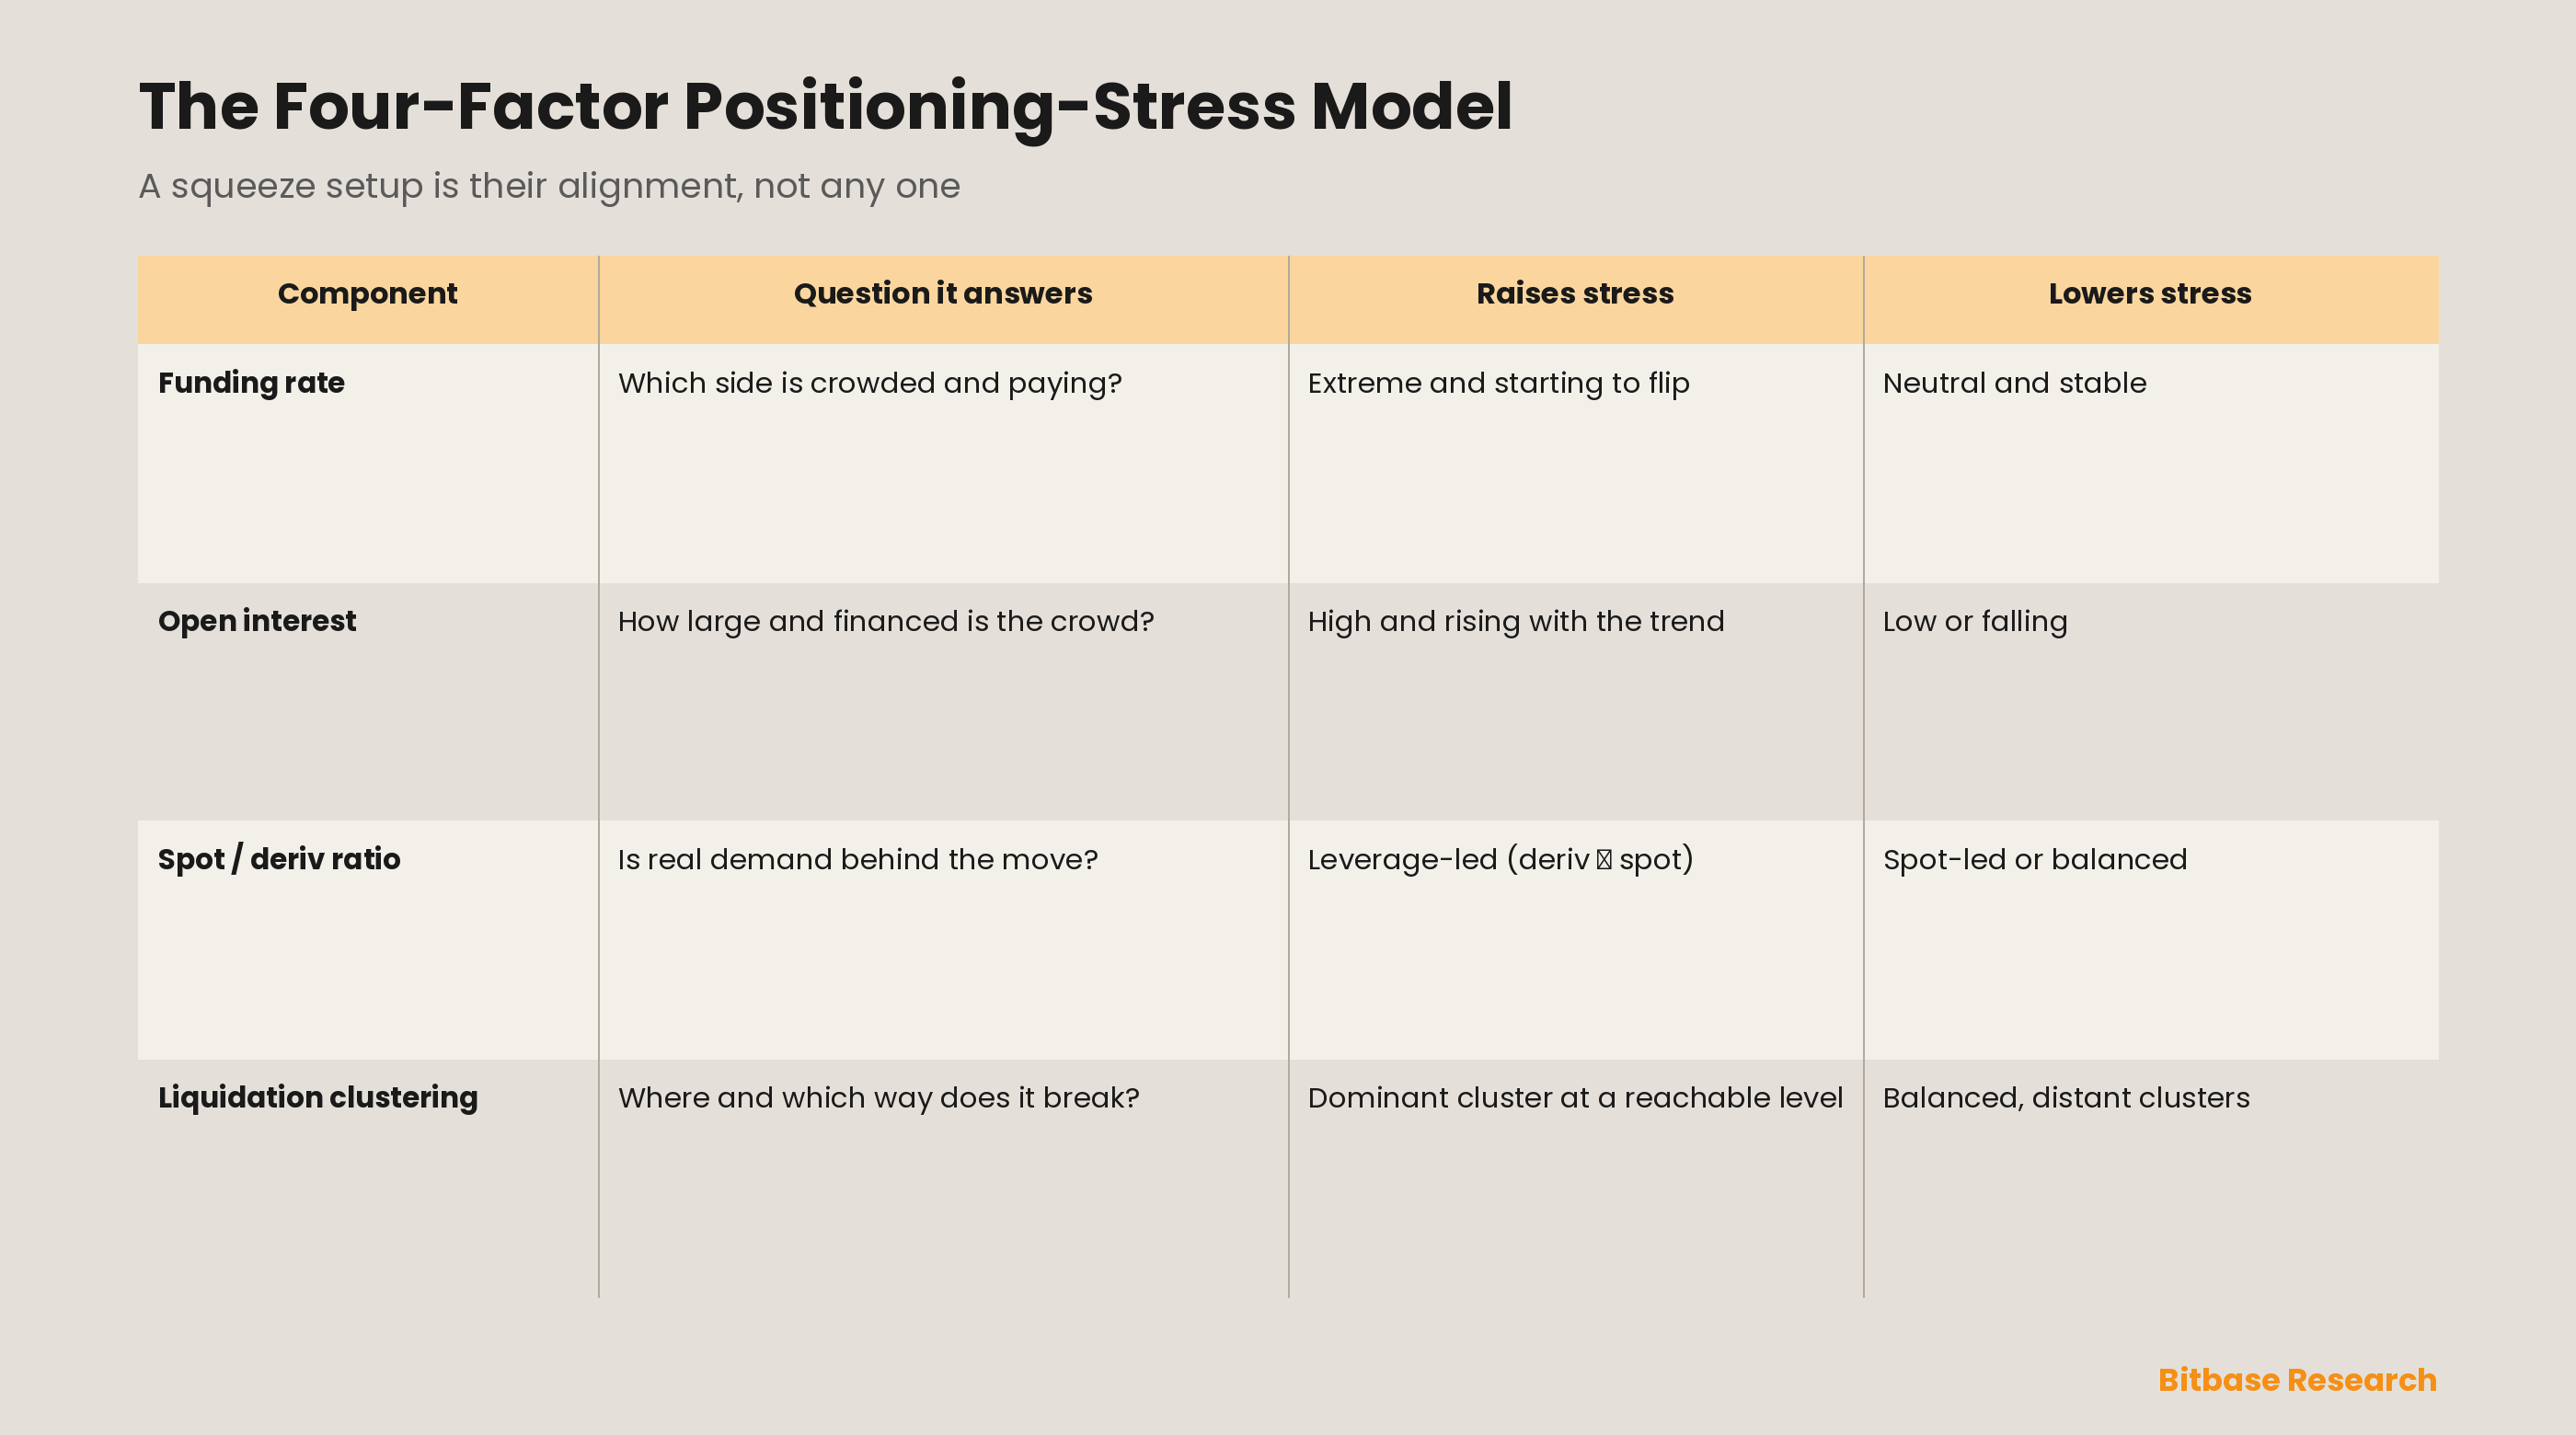
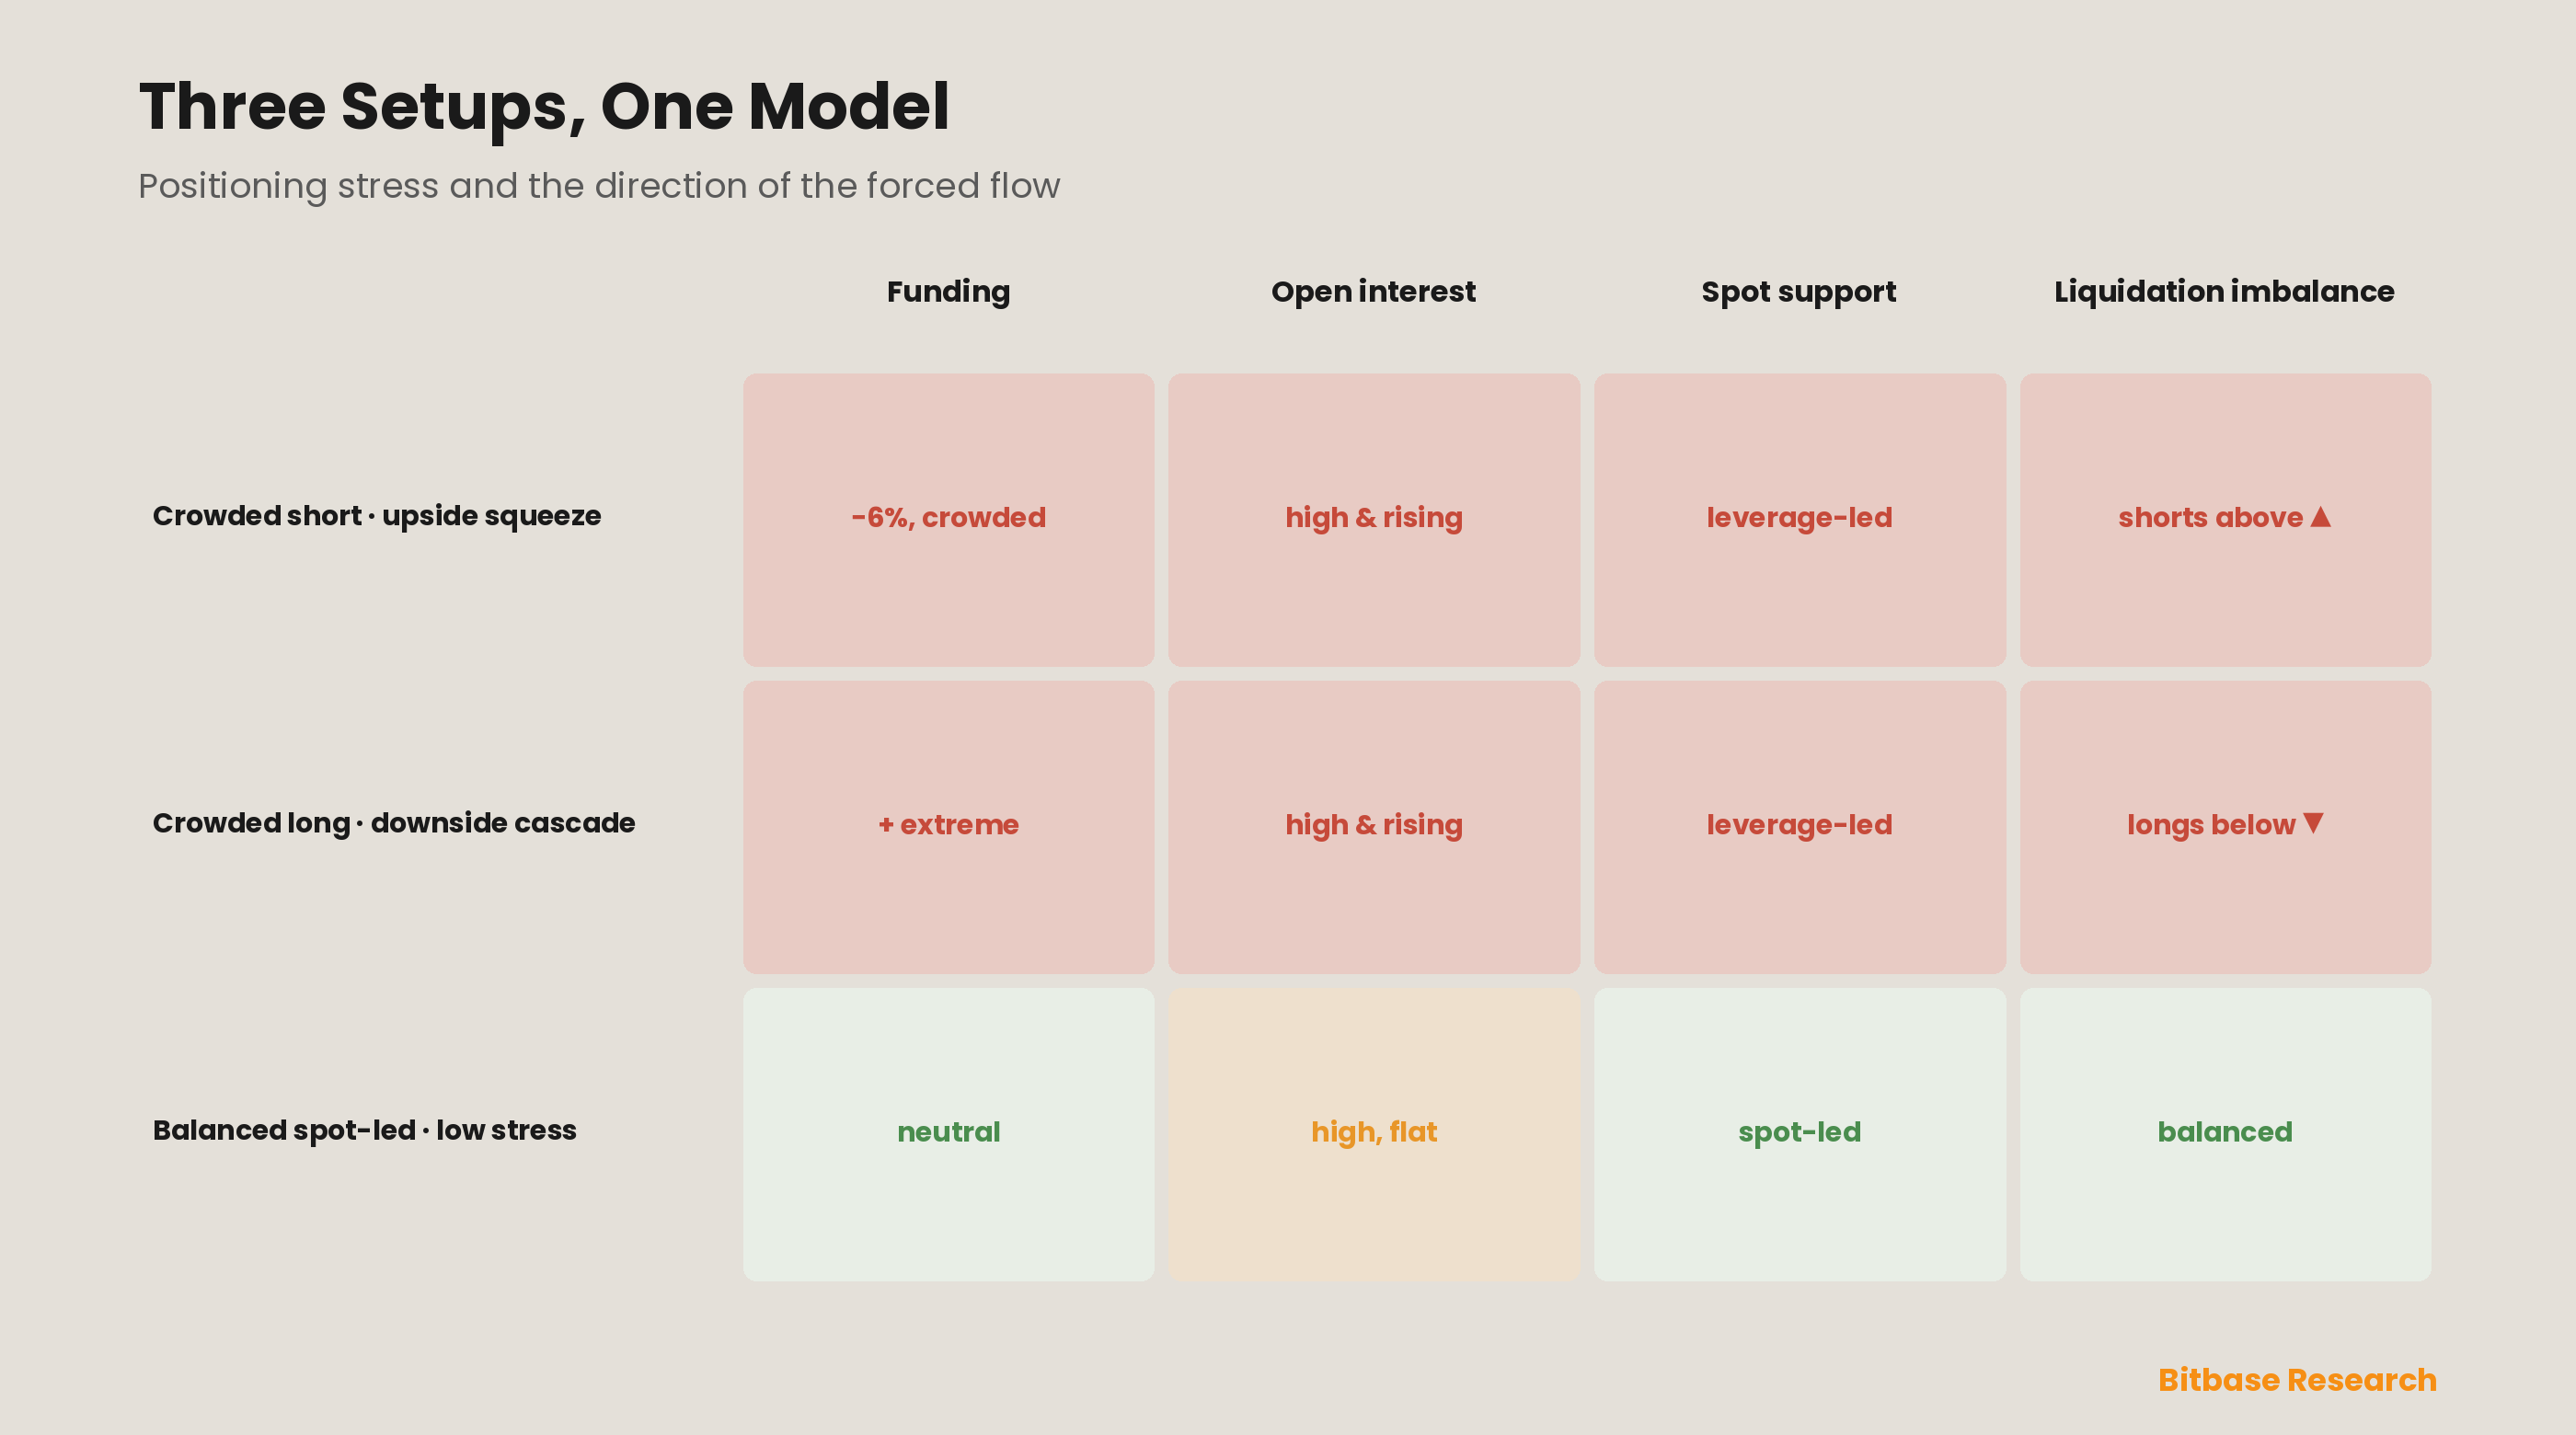
The four components are individually familiar and collectively powerful, because each answers a question the others cannot, and the model combines them into a single stress reading rather than four separate indicators. Funding answers which side is crowded and paying; open interest answers how large and financed that crowd is; the spot/derivatives ratio answers whether real demand backs the move; and liquidation clustering answers where and in which direction the unwind will accelerate. A squeeze setup is not any one of these but their alignment: a crowded side (extreme funding), large and financed (high open interest), unsupported by spot (leverage-led ratio), stacked against a dominant liquidation cluster (imbalance) at a reachable price. When all four point the same way, the positioning-stress reading is high and the direction of the forced flow is defined.
The value of composing them is that each covers the others' blind spots. Extreme funding alone can persist for weeks if open interest is small or spot demand is real; large open interest alone is benign if funding is neutral; a lopsided liquidation map alone is inert until funding and open interest reveal the crowd is stressed enough to reach it. Only the composite flags the genuine setup — and only the composite protects against the most common error, which is trading a single scary indicator in isolation. The model's output is therefore ordinal and directional: not "price will move X%," but "positioning stress is high, the crowd is short, spot is not supporting the decline, and the dominant clusters are above price — the configuration of a short squeeze, pending a catalyst." That last clause matters, because a loaded book does nothing until something pulls the trigger, which is the subject of Part 7.
Part 7 · Reading the Squeeze: The Catalyst That Breaks Equilibrium
A loaded positioning-stress reading is potential energy; a catalyst converts it to kinetic. The model flags where the book is fragile and in which direction it will run, but a crowded, stressed book can sit in equilibrium indefinitely until something forces the first move — and the setups that resolve into the largest squeezes are precisely those where a stretched positioning reading meets a trigger [5]. The recurring catalysts are four. A funding flip — extreme funding beginning to neutralize after a one-sided run — signals the paying side capitulating and is often the squeeze's opening move [10]. A breakout above or below a key level pushes price into the nearest dominant liquidation cluster, and the forced orders there do the rest [4][5]. An unexpected macro event injects the volatility that breaks margin across a stretched book at once. And a large options expiry forces hedging flows that can shove price into the clusters, a mechanical trigger unrelated to sentiment [5].
The practical discipline is to treat the positioning-stress reading and the catalyst as separate questions. The model tells you the book is loaded — high open interest, extreme funding, leverage-led, imbalanced clusters overhead — and that a short squeeze is the configured outcome; the catalyst tells you the timing, and it is far less predictable than the setup. This is why the model is a stress gauge rather than a timing tool: it identifies the setups with the most stored energy, but the release is triggered by events the model does not forecast. The reward for reading it well is not knowing exactly when the squeeze fires but knowing which of the hundreds of tokens are loaded for one and in which direction, so that when a catalyst arrives — a funding flip, a level break, an expiry — the direction and violence of the move are already understood rather than discovered in real time. The edge is in the pre-positioning of attention, not the prediction of the trigger.
Part 8 · Limits and Honest Failure Modes
A positioning model earns trust by naming what it cannot do, and this one has sharp limits. The first is that positioning stress identifies fragility, not timing: a crowded, stressed book can stay crowded and stressed far longer than a leveraged counter-position can survive, and "the shorts are crowded" is not a reason to be long today — it is a reason to expect that when the move comes, it will be violent and in a known direction. Trading the setup without a catalyst is how a correct read on positioning becomes a margin call, because the market can keep the book loaded, and add to it, long past the point of apparent stress.
Four further limits deserve to be as visible as the model. Data quality and venue fragmentation: funding, open interest and liquidation data differ across exchanges, spot volume is inconsistently reported and inflated by wash trading on some venues, and liquidation maps are estimates built from public leverage data, not the exchange's actual margin ledger — so every component is a noisy proxy, and the spot/derivatives ratio is the noisiest [1][9][13]. Reflexivity and hunting: because the liquidation map is public and the levels are known, price is actively pushed toward clusters by participants hunting the guaranteed liquidity, which both validates the map and makes its levels self-fulfilling in ways that complicate any naive fade [4]. Regime dependence: the same positioning reading behaves differently in a trending market, where crowds can stay crowded and add, than in a ranging one, where they snap back — so the model's flag must be read against the broader tape it cannot see. Cross-margin and hidden hedges: a position that looks one-sided on the perpetual book may be hedged in spot, options or another venue, so the apparent crowd may be less exposed than the map suggests, and the imbalance overstated. As a gauge of where the derivatives book is loaded and in which direction it will run when it runs, the model is sharp; as a predictor of when, it is silent.
Conclusion · Reading the Loaded Book
Crypto derivatives reward the analyst who reads the book as a loaded mechanism rather than a sentiment poll. Above US$80 billion of perpetual open interest, the crowd's positioning is a public dataset, and four signals turn it into a stress reading: funding names the crowded side and its cost, open interest sizes and finances it, the spot-to-derivatives ratio tests whether real demand backs it, and the liquidation map locates where the unwind accelerates and in which direction [1][3][6]. Composed, they flag the setups where the market is most likely to be forced to move — a crowded, financed, unsupported position stacked against a dominant cluster — and define the direction of the squeeze before the catalyst arrives [5]. Read them together, weight the liquidation imbalance that most traders ignore, and treat the reading as a map of fragility rather than a timing signal.
The deeper primitives these signals rest on — how the funding mechanism actually tethers a perpetual to spot, how leverage and margin convert a position into a forced order, and how liquidity depth determines whether a cluster breaks into a cascade or absorbs the flow — are each worth understanding in their own right, because a positioning-stress reading is only as good as the reader's grasp of the mechanics that make the book fragile. Treat the model as a discipline for locating where the derivatives book is loaded and in which direction it will run, never as a timer for the trigger, and always alongside the spot and market context that no positioning signal can hold constant.
References
[1] CoinGlass, Crypto Market Data: Derivatives, Funding Rate Heatmap, Open Interest, Liquidation Heatmaps. coinglass.com
[2] The Crypto Basic, Bitcoin Liquidation Heatmap Guide for Beginners 2026 (perpetual open interest above US$80B across top venues). thecryptobasic.com
[3] CoinDesk, "Bitcoin Sets Up Potential Short Squeeze as Funding Plunges to −6%," February 28, 2026 (funding at three-month low; short-squeeze setup). coindesk.com
[4] DEXTools News, How to Read Liquidation Maps in Crypto: 2026 Guide (heatmap from open interest, leverage and margin; hidden liquidity; clusters as magnets). dextools.io
[5] MEXC / DEXTools, Squeeze setups and catalysts (rising open interest plus one-sided positioning near a key level; funding flip, breakout, macro event, options expiry as triggers). mexc.com
[6] DEXTools News, Long-side vs short-side liquidation dollar-volume imbalance as an underused signal (dominant lower clusters → downside cascade; dominant upper clusters → upside squeeze). dextools.io
[7] Coinbase, "Understanding Funding Rates in Perpetual Futures and Their Impact" (funding tethers perpetual to spot; positive = longs pay, negative = shorts pay). coinbase.com
[8] XT Exchange, Market Sentiment in Motion: Using Funding Rates and Open Interest to Trade Altcoin Futures, May 2026 (rising OI + rising funding confirms crowding; falling OI + extreme funding = losing participation). medium.com
[9] Altrady, Crypto Funding Rates Explained for Perpetual Swaps (cross-venue funding divergence; caps from 0.05% to 1%+). altrady.com
[10] MetaMask, How to Monitor Funding-Rate Trends in Perpetual Futures (extremely negative funding = short-squeeze opportunity; funding flipping neutral after stability signals a squeeze brewing). metamask.io
[11] Phemex Academy, How to Use Open Interest to Time BTC Trades — Crypto Futures 2026. phemex.com
[12] D. Ackerer, J. Hugonnier & U. Jermann, Perpetual Futures Pricing, Wharton (funding, tethering and the mechanics of perpetual contracts). finance.wharton.upenn.edu
[13] Cryptowisser, Using Perpetual Futures and Funding Rates to Gauge Market Sentiment, June 2026 (spot-versus-derivatives flow and leverage-led moves). cryptowisser.com
[14] MetaMask, Perpetual Futures Funding: Payment Frequency and Trading Strategies. metamask.io
[15] Cube Exchange, What Is a Funding Rate? cube.exchange
[16] ApeX, Funding Rates: Essentials of Perpetual Futures Trading. apex.exchange
[17] CoinGlass, Funding Rate Heatmap (aggregated cross-venue funding). coinglass.com
[18] Phemex / general microstructure: rising open interest with rising price finances a trend; with falling price it finances a decline; divergence signals exhaustion. phemex.com
[19] OSL, "Funding Rates Explained: How Perpetual Futures Fees Signal Market Pressure." osl.com
[20] A. S. Kyle, "Continuous Auctions and Insider Trading," Econometrica 53(6), 1985 (market impact and forced order flow underpinning cascade mechanics).
Methodology and disclosure: This report synthesizes public crypto-derivatives data and practitioner literature as of mid-2026 (perpetual open interest above US$80B [1][2]; the early-2026 funding move to about −6% and its short-squeeze setup [3]; liquidation-heatmap construction and the long/short imbalance signal [4][6]; funding-rate mechanics and cross-venue divergence [7][9][14][15][16]; funding-with-open-interest readings [8][11][18]; the spot/derivatives flow distinction [13]; and squeeze catalysts [5][10]) together with perpetual-futures pricing theory [12] and market-impact fundamentals [20]. The four-factor positioning-stress model (funding-rate divergence, open-interest build-up, spot/derivatives volume ratio, liquidation clustering) and its squeeze-setup flag are educational, ordinal analytical constructs for locating where the derivatives book is loaded and in which direction it will unwind; the figures and setups shown are illustrative of the framework rather than live signals, and the cited numbers illustrate the framework rather than forecast any market. Nothing here is a rating, a recommendation, a price target, or trading advice.
Disclaimer: This is educational content from Bitbase Research, provided for informational purposes only. It is not investment, trading, tax, or financial advice. Leveraged derivatives carry a high risk of loss. Written as of July 2026; funding, open interest, liquidation data and market conditions change continuously, so always rely on the latest primary data and do your own research before making any decision.