
Day traders do not guess; they lean on strategies and indicators to time their entries and exits. But the tools are widely misunderstood, treated as magic buttons rather than what they are: imperfect readings of the same price action. Understanding the common day-trading strategies and the indicators behind them — and their limits — is what separates a plan from a gamble. Here is an overview of both and how they fit together.
Common day-trading strategies
A few approaches show up again and again. Momentum trading rides a coin that is already moving strongly, aiming to exit before it stalls. Breakout trading enters when price pushes past a level it has struggled to cross. Range trading does the opposite, buying near a support floor and selling near a resistance ceiling while price bounces between them. News-based trading reacts to events that move the market fast.
The key indicators
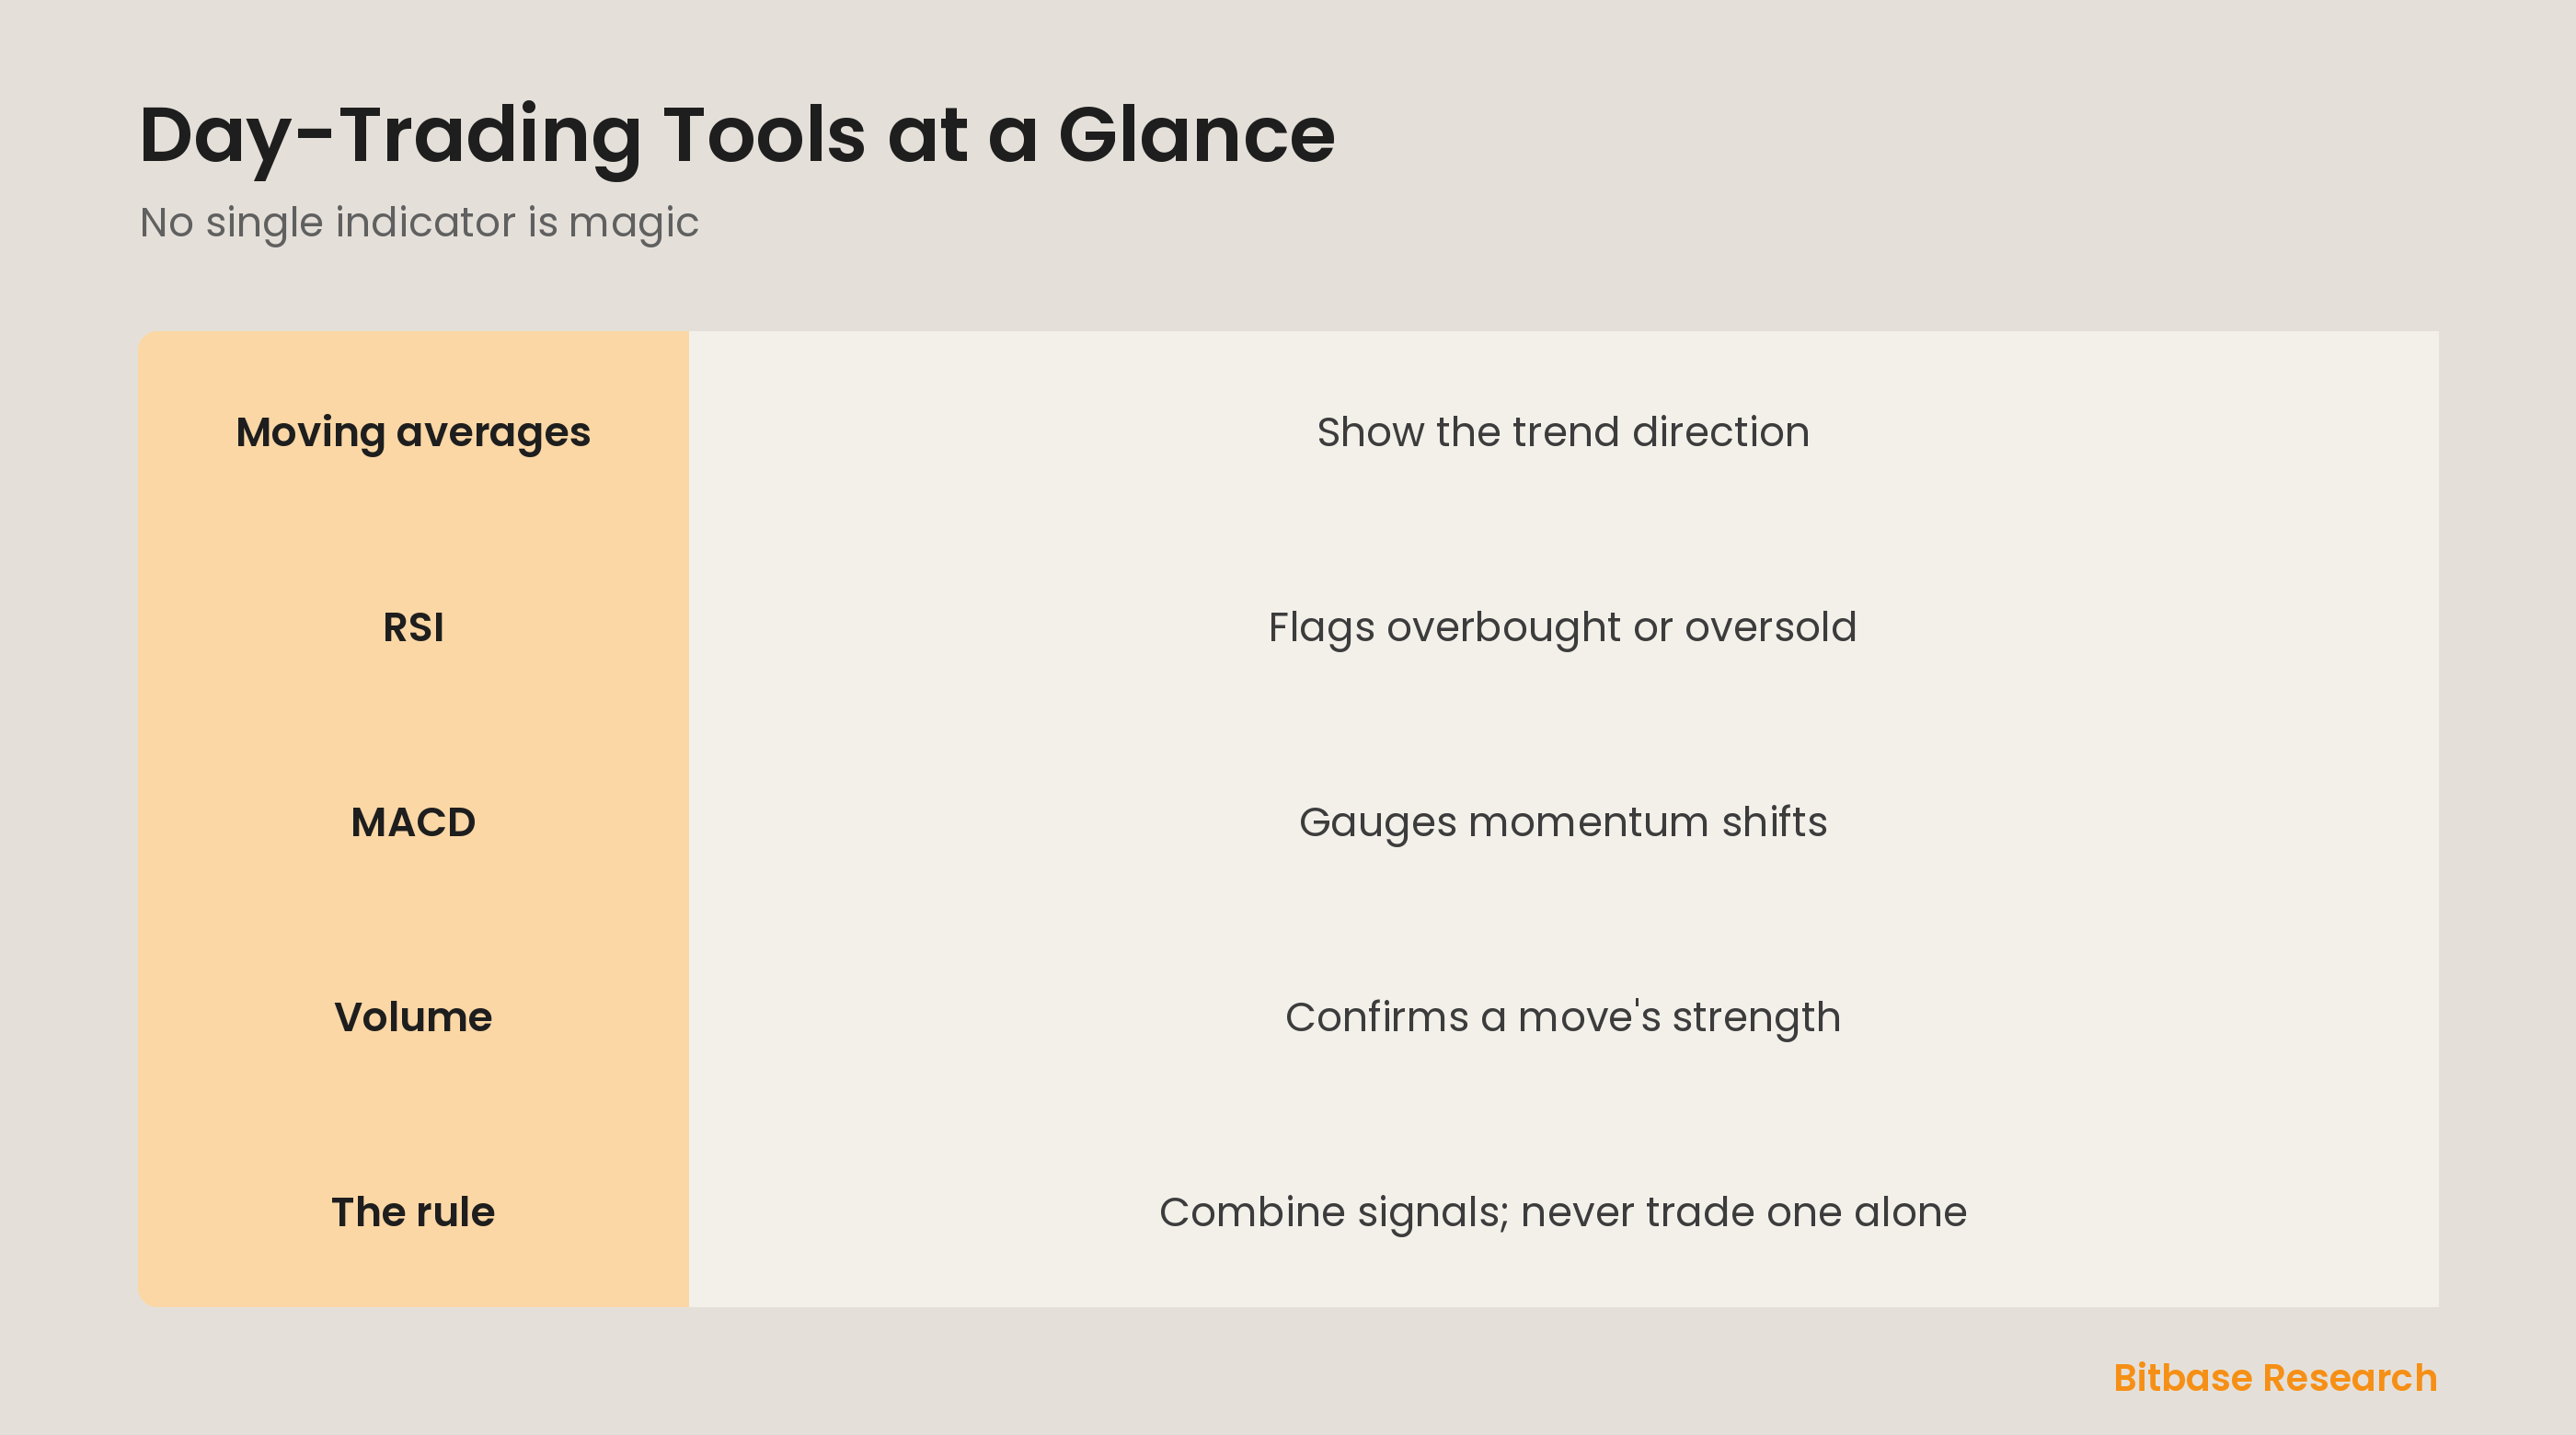
Indicators turn raw price into readable signals. Moving averages smooth price to show the trend's direction and can flag shifts when they cross. The relative strength index, or RSI, measures whether a coin looks overbought or oversold. MACD gauges momentum and when it is turning. Volume shows how much conviction is behind a move. Support and resistance mark the levels where price has repeatedly turned.
How to combine them
No single indicator is a crystal ball; each can give false signals on its own. The skill is combining a few that confirm one another — for example, a breakout backed by rising volume and a supportive trend from moving averages. Always read indicators in the context of the broader trend, and pair every signal with risk management, since even a strong setup can fail in a volatile market.
Cautions before you rely on them
Indicators have real limits. Many lag, reacting after a move has already happened, and all of them produce false signals, especially in choppy, sideways markets. Piling on more and more indicators does not create certainty; it usually creates confusion. Before trading any strategy with real money, backtest it on past data and practice it in paper trading, so you learn its weaknesses without paying for them.
The bottom line
Crypto day-trading strategies like momentum, breakout, and range trading are guided by indicators such as moving averages, RSI, MACD, and volume. None of these is a magic signal; their value comes from combining a few that confirm each other and reading them alongside the trend and strict risk management. Learn them through backtesting and paper trading first, and treat every signal as a probability, never a promise. To keep learning the fundamentals, follow more from Bitbase Academy.
Disclaimer: This article is educational content from Bitbase Academy, provided for information only. It does not constitute investment, trading, tax, or financial advice. Crypto assets are volatile; assess your own risk. Written as of June 2026; refer to the latest official information.
References
[1] Investopedia, "Technical Analysis: What It Is and How to Use It in Investing" investopedia.com
[2] Investopedia, "Moving Average (MA): Purpose, Uses, Formula, and Examples" investopedia.com
[3] Investopedia, "Relative Strength Index (RSI) Indicator Explained" investopedia.com