Bollinger Bands are one of the most recognizable indicators on a chart: a moving average wrapped by two bands that breathe in and out as the market gets calmer or wilder. They combine trend and volatility into one picture, showing not just where price is but how stretched it is and how active the market has become. Here is how Bollinger Bands are built and what their most useful signal, the squeeze, tells you.
The three bands
Bollinger Bands consist of three lines. The middle band is a simple moving average of price, usually 20 periods, showing the medium-term trend. The upper and lower bands sit above and below it at a distance set by the market's volatility, typically two standard deviations. Together they form an envelope around price: the middle band tracks the trend, and the outer bands mark how far price has stretched from it in recent conditions.
How the bands react to volatility
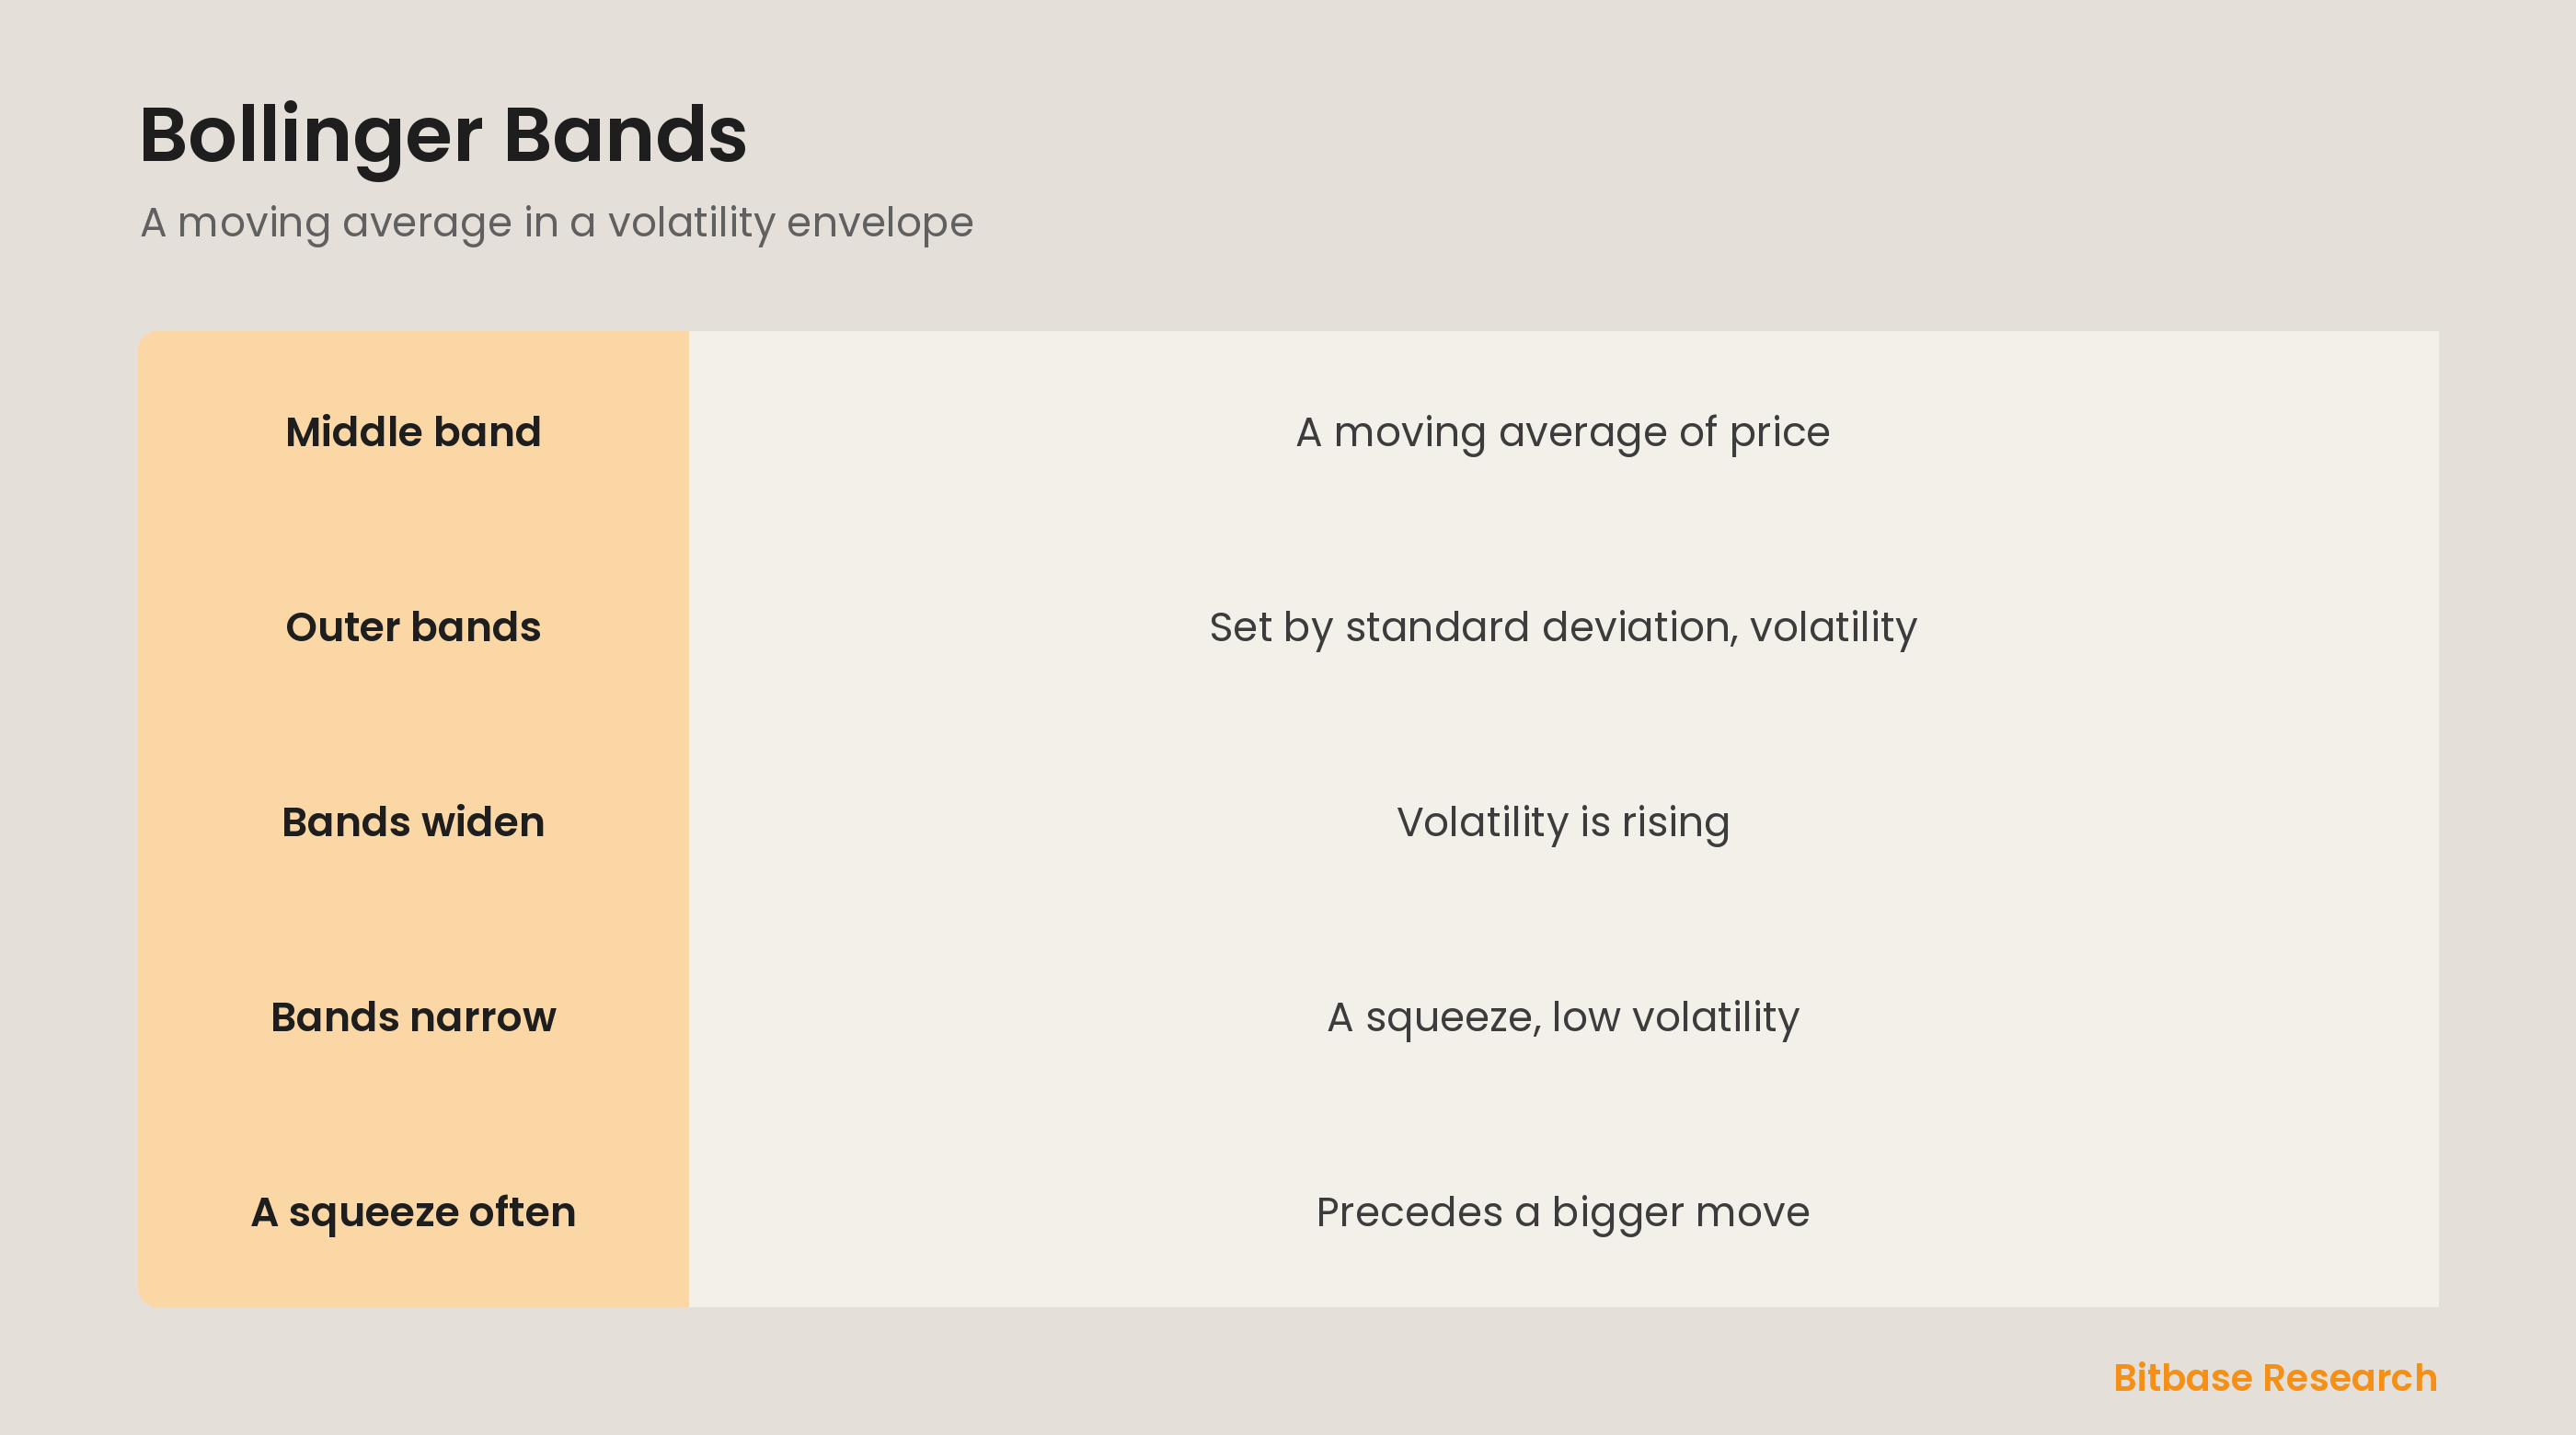
The key feature of Bollinger Bands is that the outer bands are not fixed; they widen and narrow with volatility. Because their distance from the middle is set by standard deviation, a measure of how much price is fluctuating, the bands expand when the market is volatile and contract when it is calm. So the width of the bands is itself a live reading of volatility: wide bands mean a turbulent market, narrow bands mean a quiet one.
Reading price against the bands
Price tends to spend most of its time between the bands, so the bands act as a relative frame. Touching or riding the upper band shows strong upward momentum and a stretched condition; touching the lower band shows the opposite. But a touch is not a reversal signal on its own; in a strong trend, price can walk along the upper or lower band for a long time. The bands show where price sits relative to recent volatility, not when it must turn.
The squeeze
The most watched Bollinger signal is the squeeze, when the bands narrow tightly together. A squeeze means volatility has dropped to a low, with price coiling in a quiet range. Because markets tend to alternate between calm and active phases, an unusually tight squeeze often precedes a larger move as volatility returns, though it does not say which direction. Traders watch a squeeze as a heads-up that a bigger move may be building, then look for the breakout.
The bottom line
Bollinger Bands wrap a moving average, the middle band, with upper and lower bands set by standard deviation, so the outer bands widen when volatility rises and narrow when it falls. Price mostly stays between them, and riding a band shows a stretched condition rather than a guaranteed reversal. The most valued signal is the squeeze, where tight bands mark low volatility that often precedes a bigger move, making the bands a read on both trend and volatility. To keep learning the fundamentals, follow more from Bitbase Academy.
Disclaimer: This article is educational content from Bitbase Academy, provided for information only. It does not constitute investment, trading, tax, or financial advice. Crypto assets are volatile; assess your own risk. Written as of June 2026; refer to the latest official information.
References
[1] Investopedia, "Bollinger Bands: What They Are and How To Use Them" investopedia.com
[2] Investopedia, "Moving Average (MA): Purpose, Uses, Formula, and Examples" investopedia.com
[3] Investopedia, "Standard Deviation: Meaning, Uses, and Formula" investopedia.com