The sellers exhausted; the buyers did not confirm. Where Issue 9 documented a decline that finally acquired attributable sellers—a record thirteen-session spot-Bitcoin-ETF outflow streak, Strategy's first bitcoin sale in four years, and a hot jobs print—this week tested whether those sellers were spent and whether anyone was waiting to replace them. The first half of the answer is encouraging: Bitcoin held the early-June low and stabilized in a $61,500–$64,000 range, ETF outflows decelerated sharply from the prior fortnight's $300–700 million daily pace, Strategy met its four-year first sale by buying 1,550 BTC, and Standard Chartered's Geoffrey Kendrick declared the cycle low set at roughly $59,000. The second half is not: the spot Bitcoin ETF complex posted only one net-inflow session all week (+$85.9 million on June 12), well short of the two-consecutive-days-above-$100-million threshold Issue 9 set as the bottoming confirmation. The structural event of the week was not a crypto event at all. On June 12, SpaceX completed the largest initial public offering in history—a $75 billion raise that priced at $135 and closed its first Nasdaq session up roughly 19% at $160.95—a direct competitor for the same marginal risk-on dollar crypto needs, and a listing whose synthetic perpetual futures already trade on Hyperliquid. Meanwhile the FIFA World Cup kicked off on June 11, handing the prediction-market third line its first live stress test.
Week of June 8 to June 14, 2026
Bitbase Research · June 15, 2026
Market Insights is Bitbase Research's short-wave companion to our Deep Dive flagship series. Each edition reviews the most structurally meaningful developments of the preceding week in compliant crypto derivatives and on-chain native infrastructure, mapped against the long-wave framework set out in our flagship reports. The previous issue recorded the week a drawdown found its sellers: the spot Bitcoin ETF outflow streak reached a record thirteen sessions before breaking on June 4 with a token $3.05 million inflow, Strategy disclosed its first bitcoin sale in four years, and a +172,000 May payrolls print removed the near-term rate-cut tailwind, carrying Bitcoin to a low near $59,100 on June 6. This issue records the week that followed: the selling slowed but the buying did not confirm, while the period's largest structural event—SpaceX's record IPO—landed outside crypto entirely. This week spans the same data-scope split as Issue 9: crypto-native data covers the full seven days (June 8–14), while traditional-finance data—US spot Bitcoin and Ether ETF flows, MSTR equity, the CPI release, CME—trades or releases only on weekdays. US markets were open Monday through Friday June 8–12 and closed for the weekend June 13–14. All TradFi data is anchored to end-of-day Friday June 12 (ET) unless otherwise stated; crypto data extends through Sunday June 14. The Federal Reserve remained in its communications blackout (June 6–18) throughout this window, ahead of the June 16–17 FOMC—Kevin Warsh's first meeting as Chair—which falls immediately after the period covered here.
1. The one chart that matters
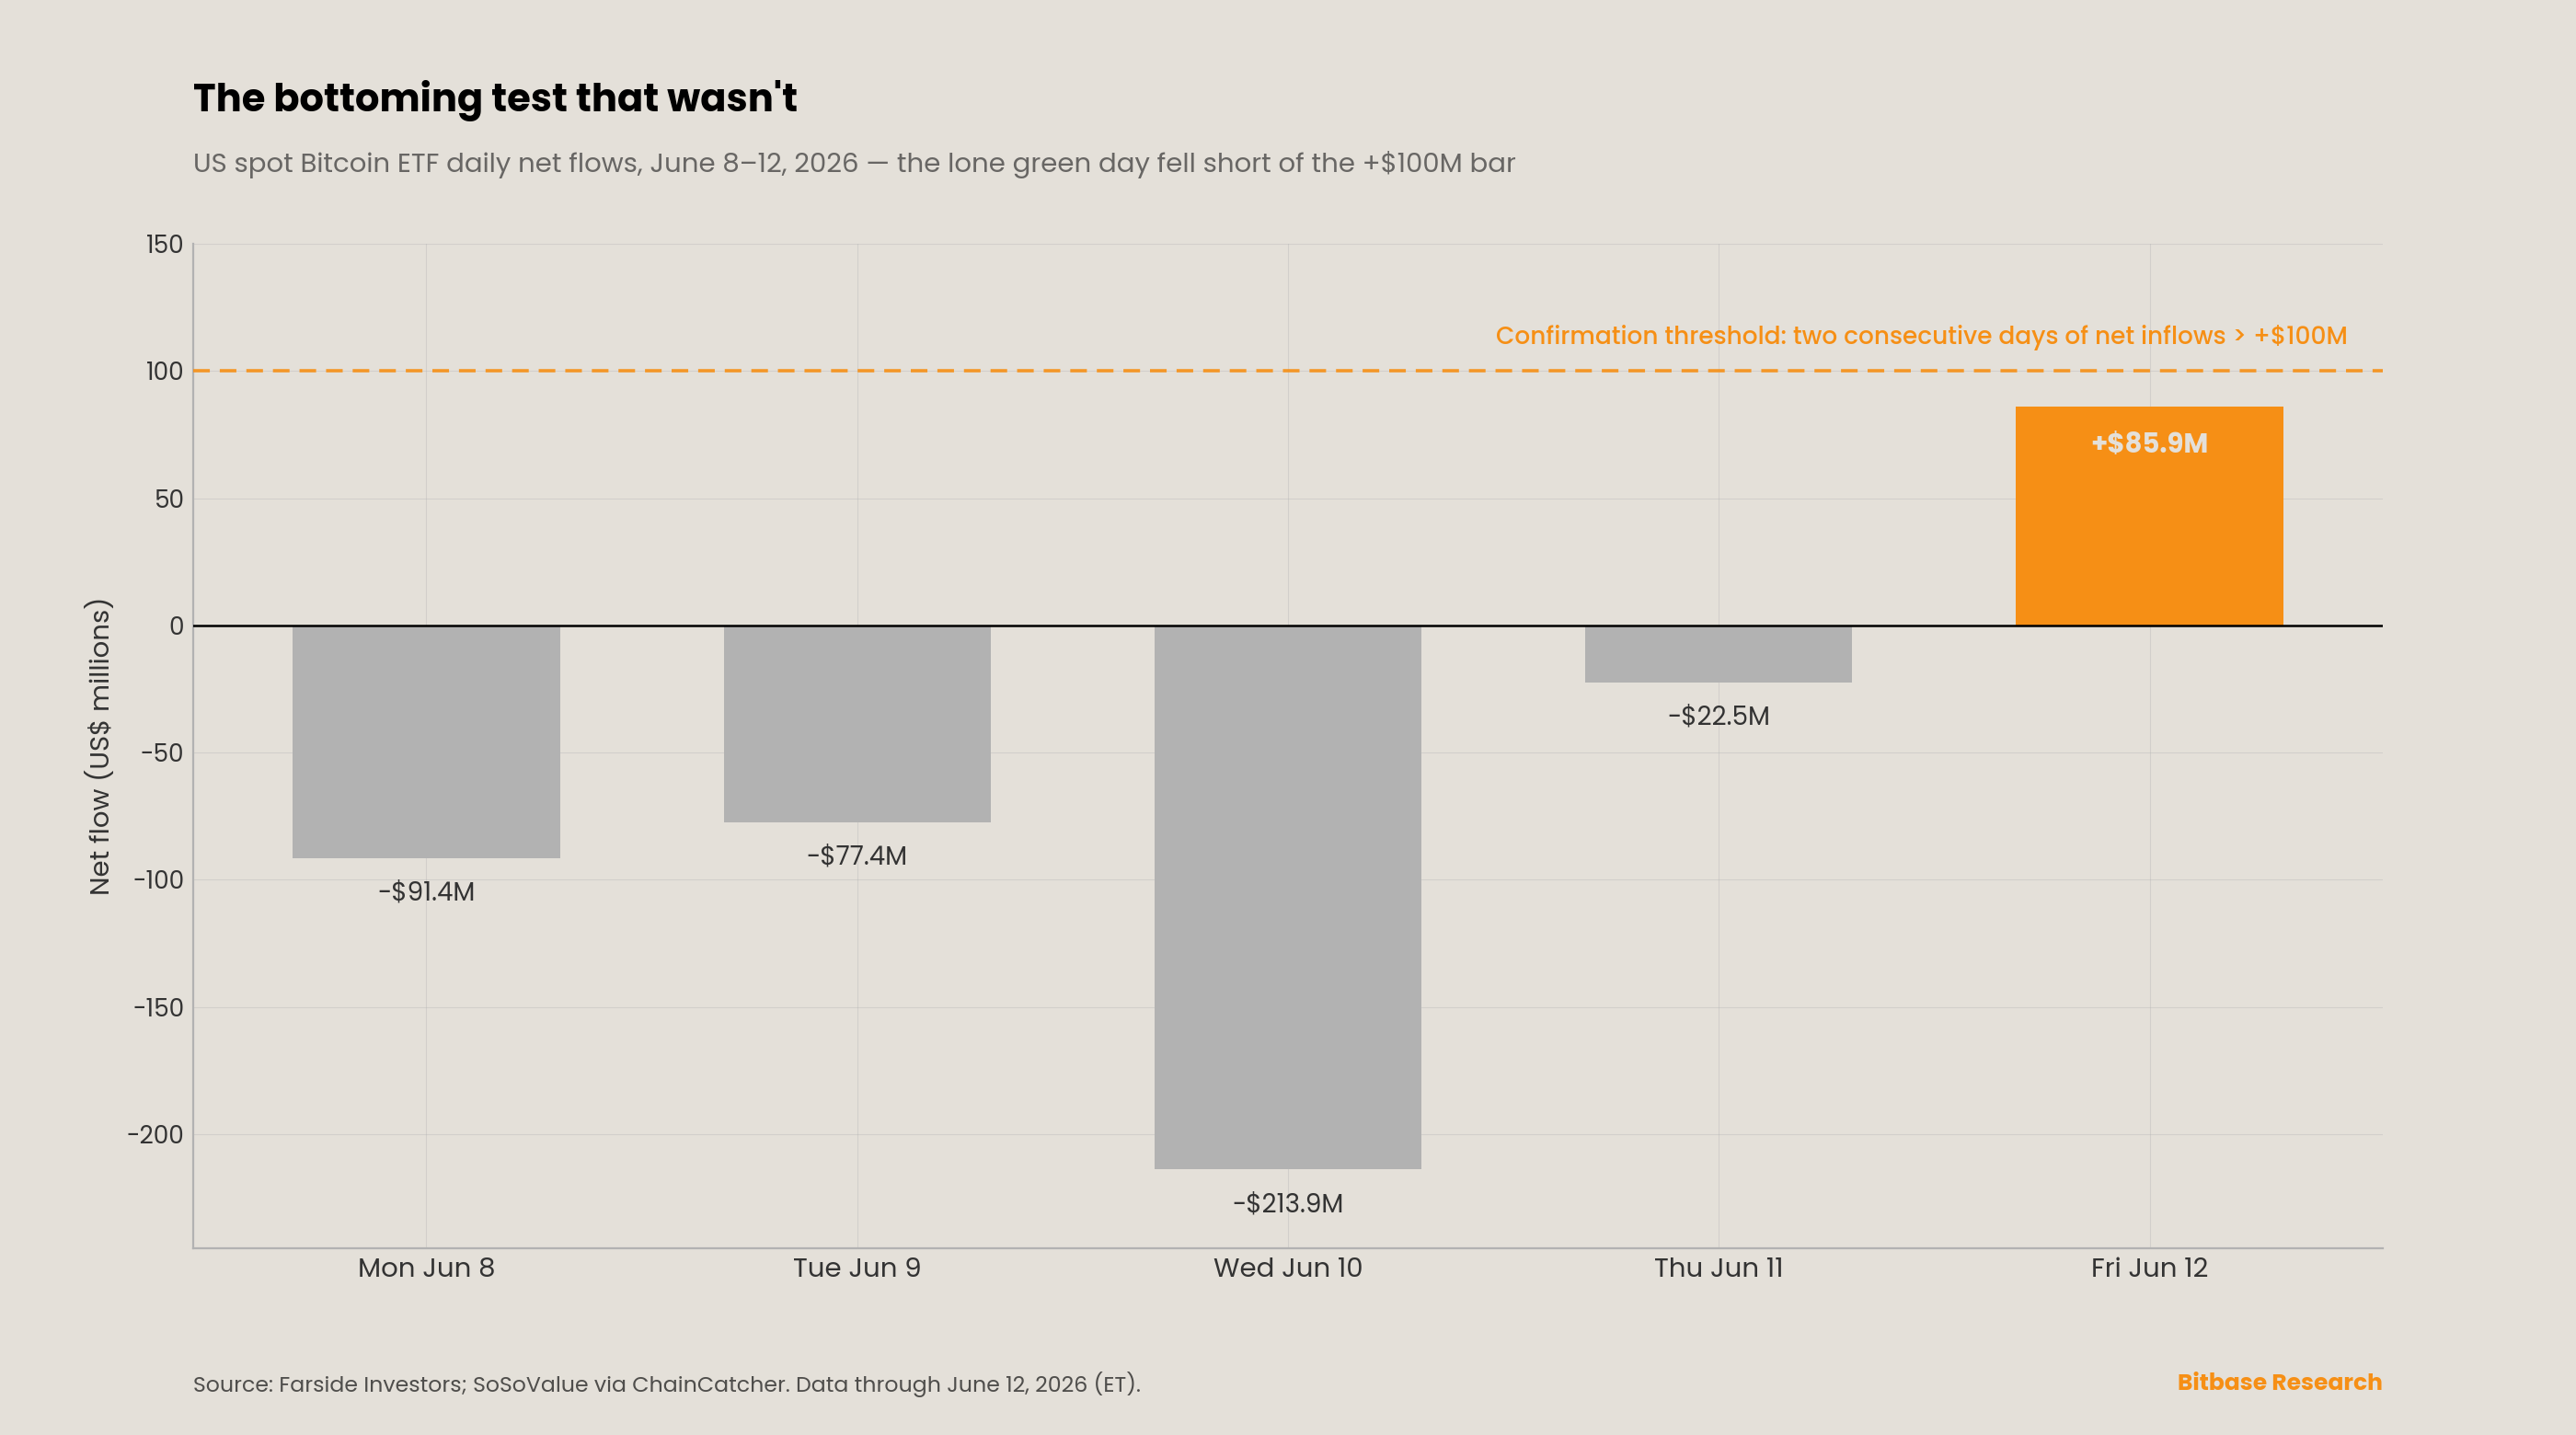
The chart plots the five trading sessions of the week against the bottoming-confirmation threshold Issue 9 defined: two or more consecutive days of net spot-Bitcoin-ETF inflows above roughly $100 million. The bars tell a two-part story. The encouraging part is deceleration: where the prior fortnight saw daily outflows of $300–700 million culminating in a record thirteen-session streak, this week's outflows were far smaller—net −$91.4 million (June 8), −$77.4 million (June 9), −$213.9 million (June 10), and −$22.5 million (June 11)—before the week's only green session, a net inflow of +$85.9 million on June 12 [4]. The discouraging part is the threshold line the bars never cross. A single inflow day below $100 million, bookended by four outflow days, is not the two-day, above-$100-million confirmation Issue 9 specified; it is a necessary precondition that fell short of sufficiency. The complex finished the week with net outflows of roughly −$319 million across the five sessions [4]. BlackRock's IBIT, which had accounted for about 75% of the prior streak's bleed, led both directions—the heaviest single-day outflow and the June 12 turn (IBIT taking in roughly $57.7 million on the green day) [4][6].
That is the through-line of this issue, and it reframes the bottoming question. Issue 9's decline had attributable sellers, so the analytic question was whether those sellers were exhausted. This week answers that the supply side is indeed cooling—outflows shrank by roughly an order of magnitude, and Bitcoin held its early-June low rather than breaking it, trading from about $63,148 on Monday June 8 to roughly $63,338 by Friday June 12, a small weekly gain after the prior week's near-17% plunge [9][2]. But a cooling of selling is not the arrival of buying. The Crypto Fear & Greed Index sat in Extreme Fear all week, reading in the low-to-mid teens (13–15) before edging toward 23 into the weekend [3]. The distinction the chart makes—decelerating supply versus confirmed demand—is what Section 6 develops as this issue's methodological contribution. The remainder of the report traces the corporate-treasury response, the structural event off-crypto, the on-chain native track, and the prediction-market line, then turns to the eight signals under continuous audit.
2. This week's structural signal
The structural signal of the week is that the largest initial public offering in history priced and traded—and it was not a crypto listing. SpaceX's $75 billion Nasdaq debut on June 12 matters to this series not as an equity event but as a claim on the marginal risk-on dollar, the same dollar that flows or does not flow into spot Bitcoin ETFs; and as a listing that the crypto market had already been pricing on-chain for weeks.
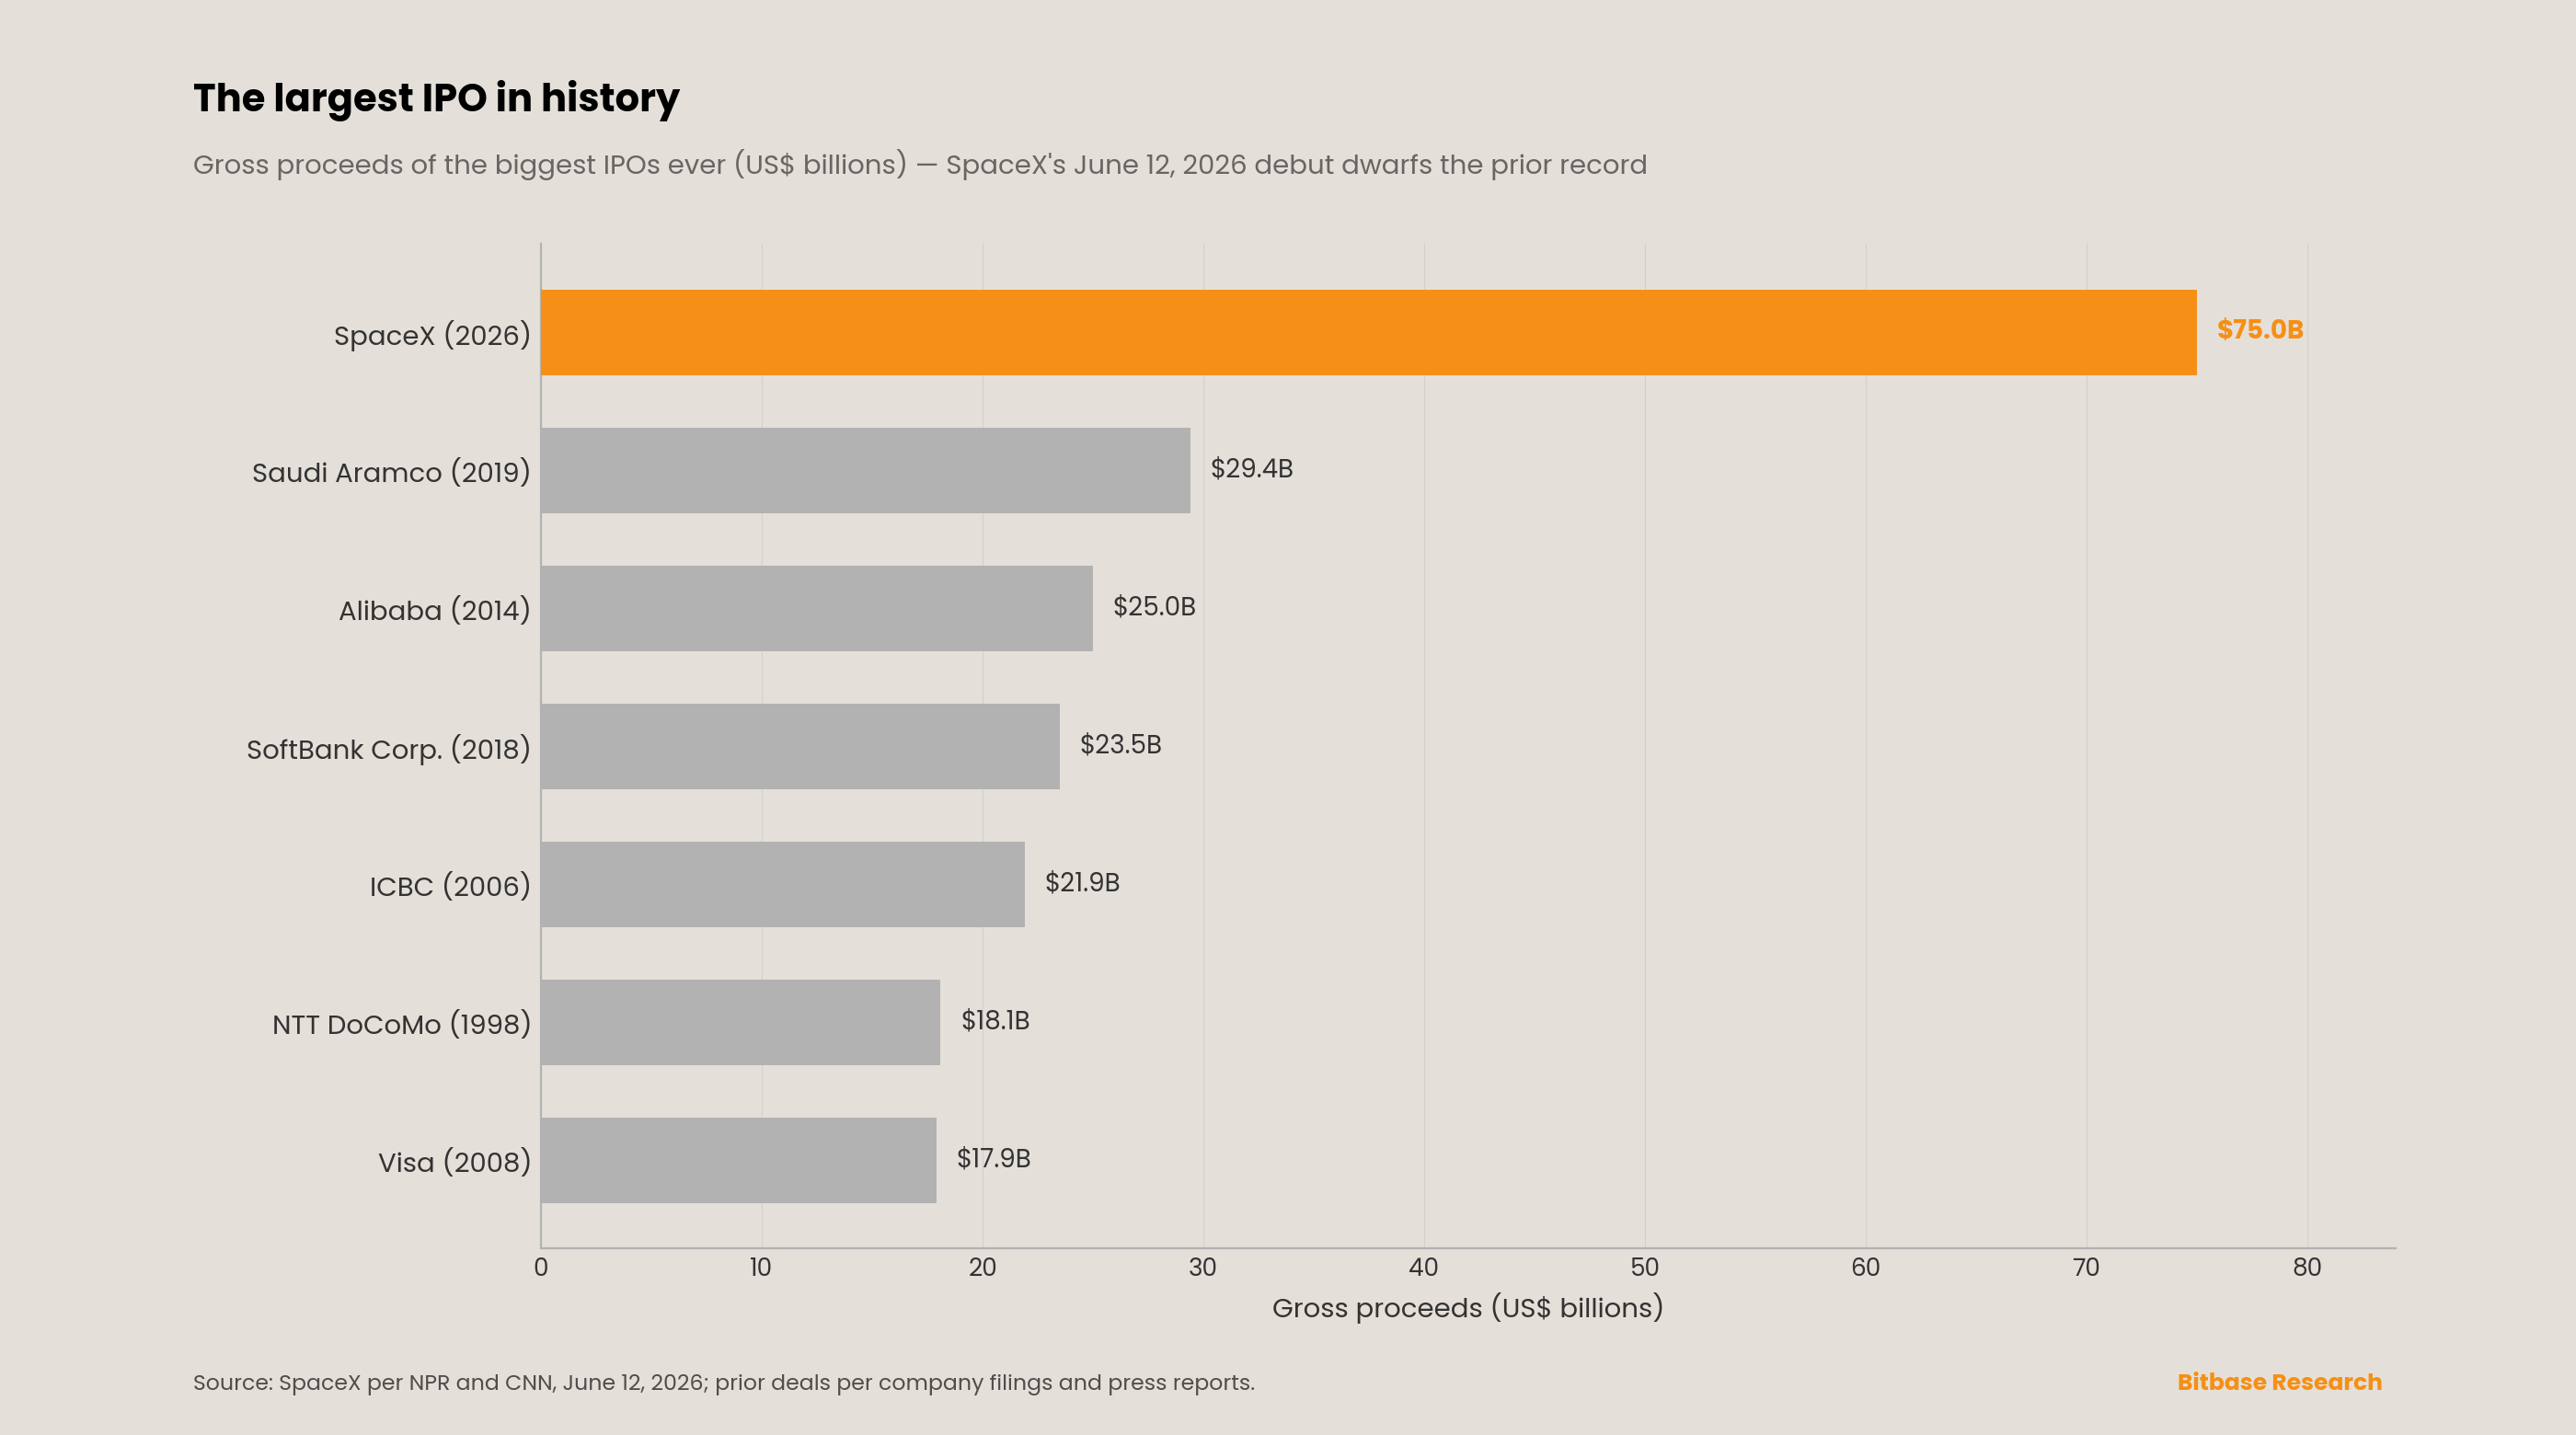
SpaceX priced its IPO at a fixed $135 per share on the evening of June 11, then opened at $150 on June 12, rose as high as $176.52 intraday, and closed at $160.95—a first-day gain of roughly 19% [13][16]. The company raised approximately $75 billion by selling more than 555 million shares, valuing it near $1.77 trillion at the offer price and above $2 trillion by the close, and making it the largest IPO ever recorded—comfortably exceeding the prior record, Saudi Aramco's roughly $29 billion 2019 listing at a $1.7 trillion valuation [13][17]. The debut made Elon Musk the world's first US-dollar trillionaire [14]. (A minor data-caliber difference: NPR and Yahoo Finance report the close at $160.95, up about 19.2%, while CNN and one trading desk report $161.11, up 19.34%; we use the $160.95 figure and flag the discrepancy.) MSCI's early-inclusion methodology added SPCX on June 13, a day after listing, against a tight reported free float near 4% [18].
The link to this series runs through two channels. First, the liquidity-competition channel: Kendrick of Standard Chartered argued explicitly that spot-Bitcoin-ETF holders had been selling exposure to raise cash for the offering, framing the IPO's completion as a development that could end that specific source of selling pressure [18][20]. We present that as one named analyst's reading rather than an established causal fact—the attribution reflects his stated reasoning and the cited reporting, not independent Bitbase inference, and other observers cautioned that monthly ETF flows remained negative and that the leverage washout signaled capitulation without fresh directional conviction [21]. Second, the on-chain channel: a SPCX-USDC perpetual-futures contract traded on Hyperliquid through the debut, changing hands near $172–176—roughly 27–30% above the $135 IPO price—on 24-hour volume of about $322.5 million and open interest above $293 million, with one outlet noting the on-chain market implied a valuation as high as $2.4 trillion [15][20]. This is the synthetic pre-IPO category—Ventuals, trade.xyz—producing, for the first time in this series, a specific, sourced, in-window volume figure rather than a placeholder; it is also the clearest instance yet of the on-chain native track pricing a traditional-finance event in real time.
3. Dual-track scoreboard
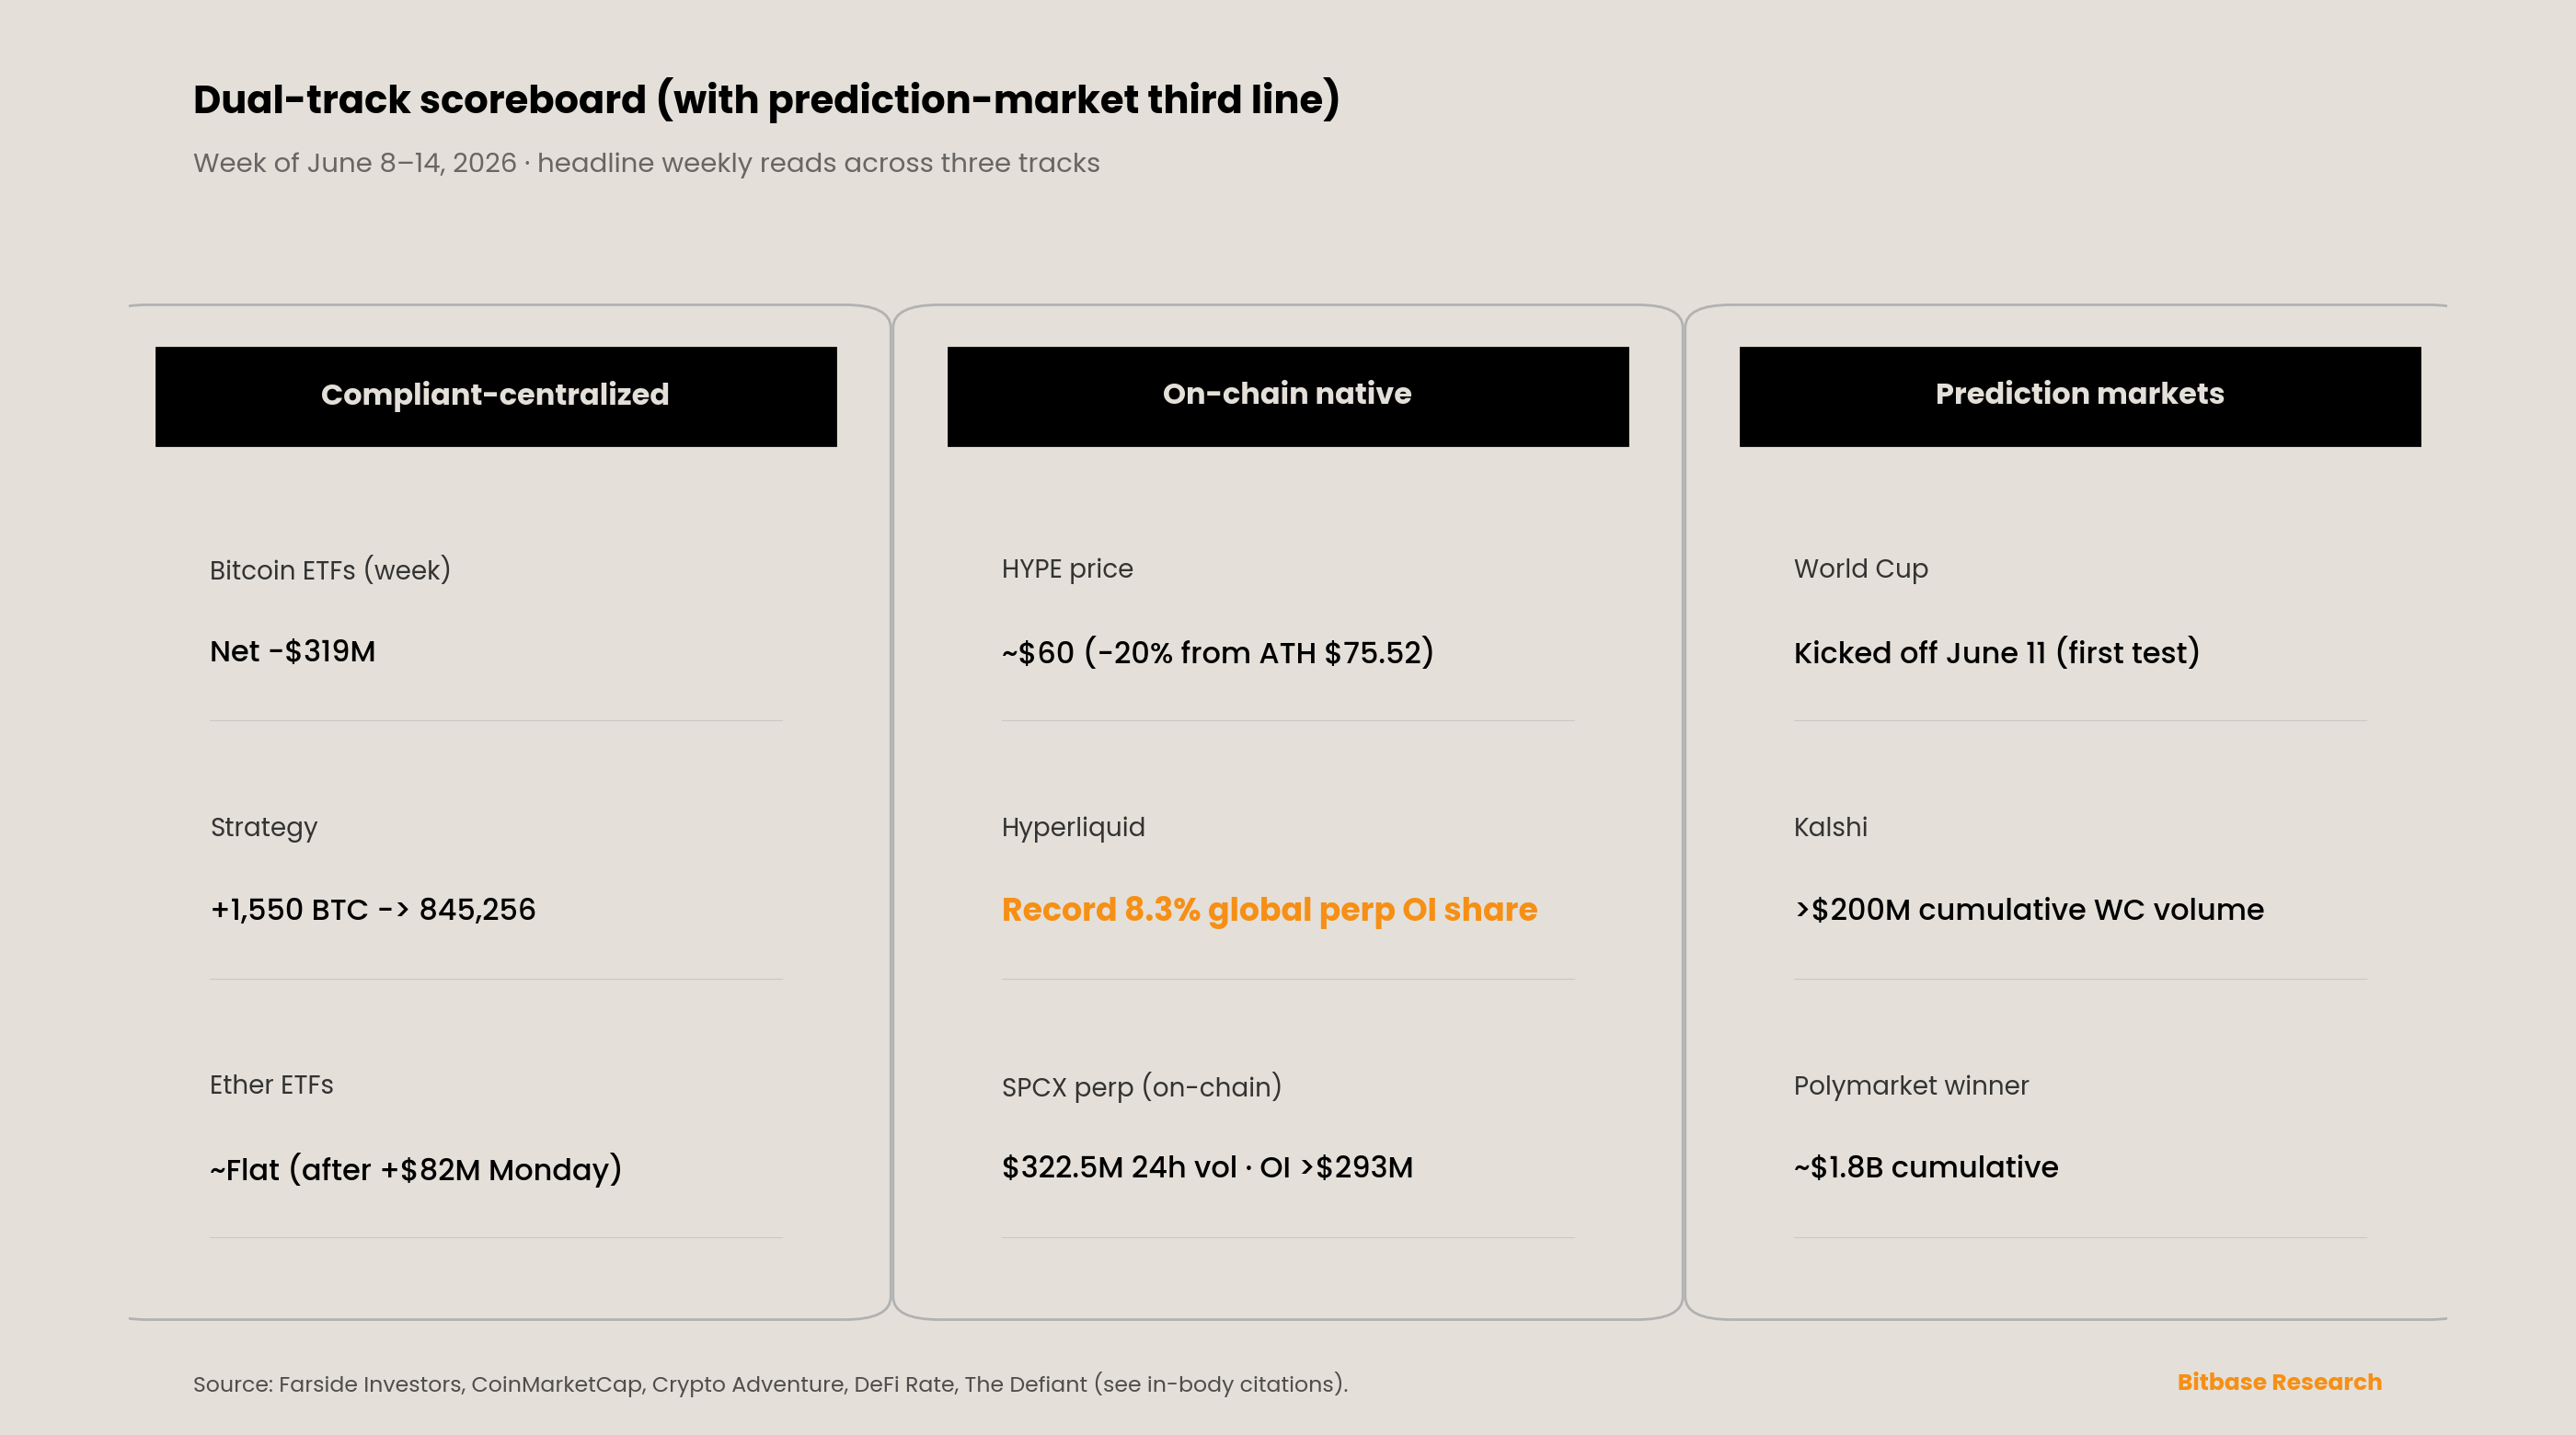
Compliant-centralized track. The week's defining corporate event was Strategy's answer to the four-year first sale documented in Issue 9. In a disclosure on Monday June 8, the company reported it had acquired 1,550 BTC for approximately $101.3 million at an average price of about $65,332, lifting holdings to 845,256 BTC and raising its US-dollar reserve by $100 million to $1.0 billion; the purchase was funded mainly through roughly 1.41 million shares sold for about $181 million net under its at-the-market program [9][10]. The purchase covered the June 1–7 window and was disclosed June 8, so—consistent with the date-integrity discipline applied to the prior issue's sale—the disclosure is in-window while the transaction period is not. Against the 32 BTC sold in late May at about $77,135, the average $65,332 entry on this far larger purchase left the company a net accumulator of roughly 1,518 BTC across the two-week span, at a materially lower price than its exit [27]. Holdings of 845,256 BTC at an average cost near $75,680—about $64 billion in aggregate, or roughly 4% of the 21 million supply cap—carried an unrealized loss at the week's prices [12]. President Phong Le characterized the May sale as a system test rather than a signal of cash pressure, calling a forced sale an edge case tied to about $3.5 billion in preferred obligations due in 2028 [11]. On June 14, Executive Chairman Michael Saylor posted his recurring chart with the caption "Still adding dots," and answered a question about the strategy with a single word, "Conviction"—the social signal that has preceded most of the company's Monday purchase disclosures, and the basis for the pending-filing watch in Section 4 [11].
On-chain native track. Detailed in Section 5; in brief, HYPE consolidated in the $59–62 range, roughly 20% below its June 1 all-time high of $75.52, while Hyperliquid's franchise set a fresh record—an 8.3% share of aggregate global perpetual-futures open interest—and its infrastructure priced the SpaceX listing in real time. The divergence between token price and protocol metrics documented in Issue 9 persisted.
Prediction-market third line. The line met its first live stress test. The 2026 FIFA World Cup kicked off on June 11 with the host nations in action—Mexico defeated South Africa 2–0 in the opener, and the United States beat Paraguay 4–1 the following day—both results consistent with pre-match market pricing [28]. Realized volumes are accumulating but should be read with care. Kalshi surpassed $200 million in cumulative World Cup volume by mid-week, with roughly $123 million of that on the tournament-winner market alone; the critical caveat is that only about $5.4 million of the winner-market figure represented capital genuinely at risk, the remainder sitting on the No side of longshot outcomes—a reminder that notional volume and money at risk are different measures [29][31]. On Polymarket, the World Cup winner market crossed roughly $1.8 billion in cumulative volume, with the broader tournament category spanning hundreds of markets [30][34]. Spain and France entered as co-favorites near 16% apiece across venues [34]. The structural development to watch is distributional: Robinhood's routing of core match, winner, spread, and total-goals contracts to Rothera—the CFTC-regulated venue it co-owns with Susquehanna, the rebranded former LedgerX—while keeping prop and parlay markets on Kalshi, against a backdrop in which a Bernstein analysis put Robinhood at roughly a quarter of Kalshi's volume earlier in 2026 [32]. Rothera's isolated opening-days World Cup volume was not published by any Tier-1 source in-window, so whether the routing materially redistributed sector volume is not yet measurable; we flag it as a forward marker, not a settled outcome.
4. On the radar—week of June 15 to June 21
Several scheduled events in the week ahead are structurally larger than most of what settled this week, and we flag them as forward markers rather than reported facts.
-
FOMC June 16–17—Warsh's first meeting as Chair. The hot May CPI (4.2% year over year) and steady 4.3% unemployment frame a stagflationary dilemma, and a hold is near-certain: the CME FedWatch tool priced about a 96.3% probability that the federal funds rate stays at 3.50–3.75% after the meeting, with the same tool seeing hikes as more likely than cuts heading into the fall [40]. The signal is not the decision but the dot plot and the tone of Warsh's first press conference; language that explicitly opens the door to a hike would be the market-moving variable. The next scheduled macro trigger after the meeting is the June CPI, released in mid-July.
-
Strategy's weekly purchase disclosure (expected Monday June 15). Saylor's June 14 "Still adding dots" post follows the pattern that has preceded most prior Monday disclosures; a filing confirming further June 8–14 buying would also satisfy one of the three confirmation markers Standard Chartered's Kendrick named for his cycle-low thesis. As of publication, no such filing had posted to EDGAR for the June 8–14 window; we mark it pending rather than reported.
-
CME's second- and third-weekend 24/7 data. The standalone June 6–7 and June 13–14 24/7 crypto volumes remained unpublished by any Tier-1 source as of June 15—the same gap flagged in Issue 9. Whether either weekend materially exceeds the roughly $50 million inaugural figure is the open question on this microstructure signal. See Section 5.
-
World Cup group stage and venue redistribution. As fixtures escalate—including Türkiye versus the United States on June 25—the test is whether realized prediction-market volume approaches the pre-tournament projection of more than $2.5 billion, and whether the Robinhood-Rothera routing becomes visible in venue-level data [31][34].
-
Oil and the Strait of Hormuz. With Brent having averaged about $107 per barrel in May on the Hormuz disruption, and prices easing toward the high-$80s as a US–Iran peace deal was floated and then partly walked back by President Trump, the oil path is the dominant near-term macro swing factor for crypto risk appetite [38][20][41].
5. Signal tracking update
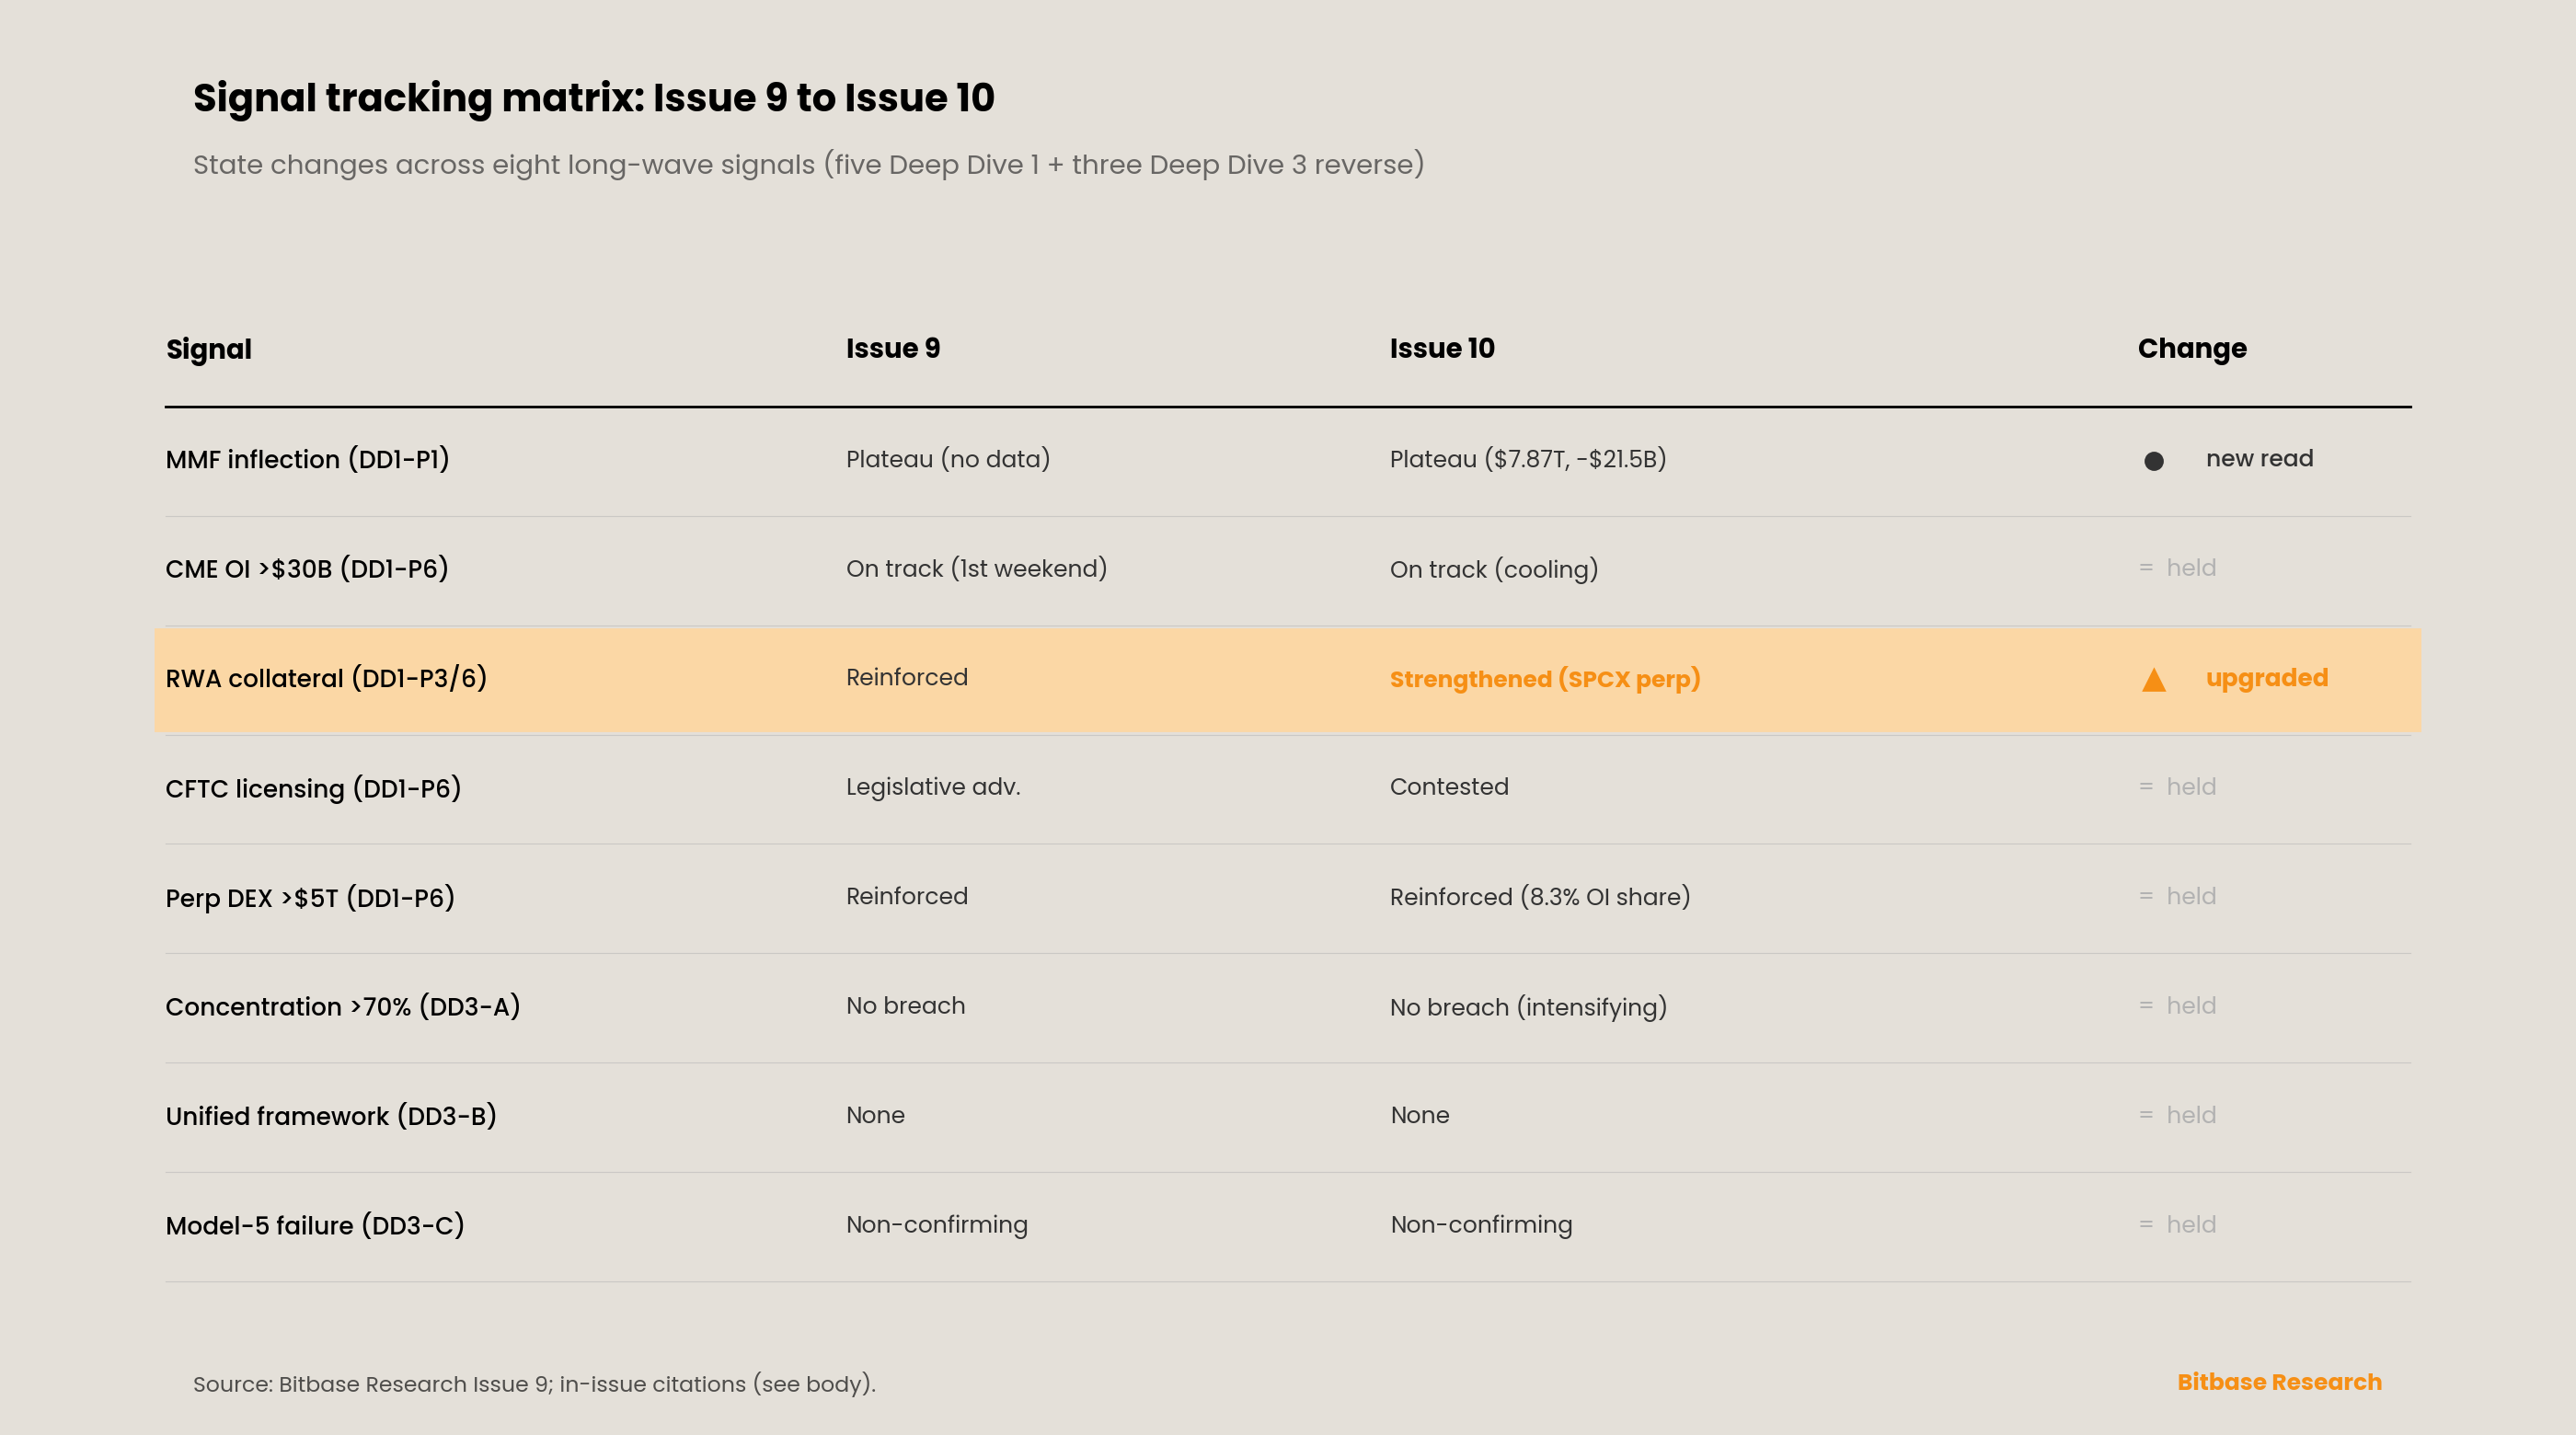
Five Deep Dive 1 signals plus three Deep Dive 3 reverse signals remain under continuous audit. This issue records the money-market-fund signal logging a new reading and the perpetual-DEX and RWA-collateral signals strengthening, while the others hold their Issue 9 readings. The SpaceX listing, the CPI print, and the World Cup launch bear on several signals through the narrative above but, as detailed below, move the formal signal states only where noted.
SIGNAL—Deep Dive 1 Part 1: "MMF asset scale inflection point." STATUS: Plateau holding; new reading logged, no inflection. The Investment Company Institute reported total money-market-fund assets decreased by approximately $21.48 billion to $7.87 trillion for the week ended June 10, following a prior-week increase of about $109.25 billion to $7.89 trillion [42]. A single weekly decline from a record-high base does not constitute the rotation-into-risk inflection this signal tracks; assets remain near all-time highs, and the cash-on-the-sidelines wall has not yet meaningfully moved into risk assets. The signal holds at "plateau," now with a current reading rather than the carried-forward absence of data noted in Issue 9.
SIGNAL—Deep Dive 1 Part 6: "Whether CME crypto derivatives OI persistently holds above $30B by 2027." STATUS: On track; momentum cooling, second-weekend data still absent. CME's 2026 year-to-date crypto average daily volume stands at roughly 407,200 contracts, up about 46% year over year, with average daily open interest near 335,400 contracts, up about 7%, following a record near $3 trillion in crypto futures and options notional in 2025 [35]. But Bitcoin open interest rolled lower into the drawdown, and CryptoSlate estimated roughly $10 billion in long-futures liquidations over a single week [37]. The standalone 24/7 weekend figures for June 6–7 and June 13–14—the reads that would distinguish a steady-state floor from launch curiosity—had not been published by any Tier-1 source as of June 15. The signal stays on track against full-year data; the weekend prints remain the next observable evidence and the top microstructure watch into Issue 11.
SIGNAL—Deep Dive 1 Parts 3 and 6: "Tokenized RWA as common collateral infrastructure." STATUS: Strengthened. The synthetic pre-IPO sub-layer produced its first specific in-window datapoint: a SPCX-USDC perpetual-futures contract on Hyperliquid traded on about $322.5 million of 24-hour volume with open interest above $293 million through the SpaceX debut [15]. More broadly, Crypto Briefing reported Hyperliquid capturing roughly 44% of real-world-asset perpetual-futures volume, with builder-deployed HIP-3 open interest having expanded sharply across 2026 [26]. The signal strengthens from its Issue 9 reading, with the Ventuals-derived fragility qualifier on the synthetic sub-layer retained: a SPCX contract trading near a $2.4 trillion implied valuation is a price-discovery venue and a concentration risk in the same instrument.
SIGNAL—Deep Dive 1 Part 6: "Whether the U.S. CFTC approves more licensed entities to offer perpetual swap-style products by 2027." STATUS: Contested; no new milestone confirmed. No new CFTC licensing action on perpetual-style products was confirmed in-window, and the adjacent prediction-market rule received by White House OIRA in late May showed no Tier-1-confirmed further movement. CME chief executive Terry Duffy publicly characterized the prospect of widely available high-leverage perpetual crypto futures as a hazard, a framing that captures the regulatory tension around the category [37]. The administrative track holds at pending; the surrounding debate sharpened without a state change.
SIGNAL—Deep Dive 1 Part 6: "Whether perpetual DEX annual trading volume holds above $5 trillion in 2026." STATUS: Structurally reinforced. Hyperliquid set a record 8.3% share of aggregate global perpetual-futures open interest and crossed 7% of total exchange perpetual-futures volume for the first time, even as the broader market sold off; cumulative protocol perpetual-futures volume stands near $4.4 trillion, and perpetual-DEX market dominance has climbed past the mid-50s percent range over 2026 [22][23][27][25]. Share that expands during a drawdown is the durable kind, distinct from incentive-driven volume. HYPE's roughly 20% decline from its June 1 all-time high of $75.52 to the $59–62 range is a token-price event, not a signal-state change—the signal tracks volume, not price [24]. The recurring scheduled-unlock pressure flagged in Issue 9 remains a HYPE-specific risk dimension separate from protocol performance.
SIGNAL (Deep Dive 3 Reverse Signal A)—Market-share concentration above 70%. STATUS: No single-venue breach, but concentration intensifying. Hyperliquid's record open-interest share, Kalshi's dominance of US prediction-market activity, and IBIT's outsized share of daily Bitcoin-ETF flows all point to intensifying concentration within each rail; yet no single venue breached the 70% model-concentration threshold within its defined market, and no new independent third-party attribution crossed that line in-window. The five-model coexistence thesis from Deep Dive 3 holds, with the concentration trend worth continued watching.
SIGNAL (Deep Dive 3 Reverse Signal B)—Cross-architecture unified regulatory framework. STATUS: No unified framework (held). The CLARITY Act remained on the Senate calendar without a floor vote in-window, a single-jurisdiction legislative step rather than cross-jurisdiction harmonization [43]. No new ESMA, FCA, MAS, JFSA, BIS, or Basel coordination statement was issued. The five-model regulatory divergence documented in Deep Dive 3 remains the state of record.
SIGNAL (Deep Dive 3 Reverse Signal C)—Model 5 regulatory failure. STATUS: Maximally non-confirming (sustained). The reverse signal positing regulatory failure for the on-chain-native model wrapped by US-regulated access remains maximally non-confirming. Through a week of broad ETF outflows, the regulated-wrapper channel for on-chain-native assets continued to function and price a marquee traditional-finance listing in real time; no regulatory-failure event occurred. Duffy's leverage warning is a precursor flag worth noting, not a state change.
6. New dimension—from a supply question to a demand question
If Issue 9's methodological contribution was distinguishing a decline with attributable sellers from one without, Issue 10's is distinguishing the exhaustion of selling from the arrival of buying. The two are not the same, and conflating them is the most common error in calling a bottom.
This week supplied strong evidence on the supply side. ETF outflows shrank by roughly an order of magnitude from the prior fortnight, the record thirteen-session streak's aftermath produced no break of the early-June low, Strategy stepped in as a large buyer at a price well below its prior exit, and a major source of cross-asset selling—liquidation of Bitcoin exposure to fund the SpaceX subscription—plausibly cleared with the listing itself. A coherent reading is that the sellers who defined Issue 9 are largely spent.
But exhaustion of selling is a necessary, not sufficient, condition for a bottom. The demand side did not confirm. The cleanest test available—two consecutive sessions of net ETF inflows above roughly $100 million—was not met; the week produced one inflow day below that level. This is precisely why the analytic framing matters: when a decline's sellers exhaust, price can stop falling without anyone arriving to push it higher, and a market can sit at a floor for some time before demand returns or selling resumes. The confirmation Issue 9 specified, and that this issue restates, ties an upgrade to flow persistence and a price reclaim rather than to any single headline or analyst call.
That framing also clarifies how to read the Standard Chartered note. Kendrick's declaration that the cycle low was set at roughly $59,000 is itself a price forecast, which this series does not adopt or endorse; what is analytically useful is that he named three observable confirmation markers—additional Strategy purchases, a return to positive ETF inflows, and continued oil-price declines—and that the in-window scorecard against those markers is mixed. The first was arguably met when Strategy disclosed its 1,550 BTC purchase on June 8. The second was not, given the lone sub-$100 million inflow day. The third turned ambiguous when an apparent US–Iran de-escalation that pressured oil was partly contradicted by President Trump's subsequent comments. One marker met, one missed, one unresolved is a fair summary of where the bottom debate stood at week's end—and a more disciplined statement than either "the bottom is in" or "the decline continues."
Caveats
-
Date integrity. Strategy's 1,550 BTC purchase covered June 1–7 and was disclosed June 8; the disclosure is in-window, the transaction period is not. Saylor's "Still adding dots" post (June 14) signals a possible further purchase whose confirming filing—if it follows the established pattern—would post on Monday June 15, just outside this window; it is marked pending, not reported. The SpaceX IPO priced June 11 and traded June 12, both in-window. The early-June Bitcoin low referenced here is the figure Issue 9 committed to (~$59,100 on June 6); see the data-caliber note below. The June 16–17 FOMC and the June 25 Türkiye–United States match both fall after this window.
-
Data-caliber conflicts flagged. SpaceX first-day close: $160.95, up about 19.2% (NPR, Yahoo Finance) versus $161.11, up 19.34% (CNN, one trading desk). Early-June Bitcoin low: ~$59,100 on June 6 (Issue 9) versus $59,375 on June 5 (CoinDesk, Standard Chartered)—a difference in both level and date, flagged rather than reconciled. June 10 Bitcoin-ETF net outflow: −$213.9 million (Farside) versus −$214 million (SoSoValue via ChainCatcher)—immaterial. Bitcoin AUM trough cited variously across sources in the low-$80 billion range in early June. FOMC-hold probability: about 96.3% (CME FedWatch via Fox Business) versus roughly 97.8% on prediction-market aggregates.
-
Source attribution. ETF daily-flow figures are Farside Investors and SoSoValue trackers, subject to T+1 revision, not issuer-direct; Hyperliquid open-interest-share and volume figures are per Crypto Adventure, Cryptopolitan, and DefiLlama; the SPCX on-chain figures are per CNBC and CoinCentral; Strategy holdings and purchase terms are per the company's June 8 disclosure and SEC filing as reported by BeInCrypto, KuCoin, and CoinCentral.
-
Causation discipline. All causal attributions—ETF holders selling to fund the SpaceX IPO, the listing's completion easing that pressure, oil prices driving Treasury yields and risk appetite, scheduled unlocks pressuring HYPE—reflect the cited outlets' framing and named analysts' stated reasoning, not independent Bitbase inference.
-
Items genuinely unavailable as of June 15. CME's standalone June 6–7 and June 13–14 24/7 crypto weekend volumes; Rothera's isolated June 11–14 World Cup volume; a confirmed Strategy filing covering the June 8–14 purchase window. These are stated as gaps, not estimated.
-
This is not investment advice. Bitbase Research does not make price predictions or recommend positions; third-party forecasts referenced here, including Standard Chartered's, are reported as named analysts' views, not adopted. Figures are anchored to end-of-day Friday June 12 (ET) for TradFi and Sunday June 14 for crypto-native data unless otherwise stated.
References
[1] InteractiveCrypto, "Bitcoin's 1.28% rebound on Trump's peace pledge faces 'Extreme Fear'," June 2026. Bitcoin rebound; early-June low reference; Extreme Fear sentiment. https://www.interactivecrypto.com/bitcoin-s-1-28-rebound-on-trump-s-peace-pledge-faces-extreme-fear-jun-2026
[2] Investing.com, "Standard Chartered says crypto market has reached its cycle low," June 12, 2026. BTC $63,337.8 Friday (+0.9%); near-17% prior-week plunge; near annual lows; Kendrick $100K year-end. https://www.investing.com/news/cryptocurrency-news/standard-chartered-says-crypto-market-has-reached-its-cycle-low-4739250
[3] CoinStats, Crypto Fear & Greed Index, June 8–15, 2026. Index in low-to-mid teens, edging toward 23 (Extreme Fear). https://coinstats.app/fear-and-greed/
[4] Farside Investors, "Bitcoin ETF Flow (US$m)," accessed June 15, 2026. Daily US spot Bitcoin ETF net flows June 8–12; fund-level detail; cumulative. https://farside.co.uk/btc/
[5] ChainCatcher, "Bitcoin spot ETF total net outflow $214 million," June 11, 2026. June 10 net outflow ~$214M (SoSoValue). https://www.chaincatcher.com/en/article/2270699
[6] Bitcoin.com News, US spot Bitcoin ETF daily flows, June 2026. June 8 fund-level detail (IBIT, FBTC, ARKB). https://news.bitcoin.com
[7] Farside Investors, "Ethereum ETF Flow (US$m)," accessed June 15, 2026. Daily US spot Ether ETF net flows June 8–12. https://farside.co.uk/eth/
[8] Farside Investors, "Hyperliquid (HYPE) ETF Flow (US$m)," accessed June 15, 2026. Daily HYPE ETF net flows and cumulative assets. https://farside.co.uk/hyp/
[9] BeInCrypto, "MicroStrategy Buys Bitcoin 2 Weeks After Selling," June 8, 2026. 1,550 BTC / $101M / 845,256 BTC; ~1.41M shares / $181M ATM; BTC $63,148 Monday (+1.34%); Phong Le quote. https://beincrypto.com/microstrategy-buys-bitcoin-after-sale/
[10] Strategy Inc., SEC EDGAR Form 8-K (filed June 8, 2026; CIK 0001050446) and @Strategy / @saylor posts, June 8, 2026. 1,550 BTC; $101.3M; avg $65,332; 845,256 BTC; USD reserve +$100M to $1.0B. https://www.sec.gov/cgi-bin/browse-edgar?action=getcompany\&CIK=0001050446\&type=8-K
[11] CoinCentral, "Strategy (MSTR) Stock: Saylor Teases Another Bitcoin Buy as CEO Defends 32 BTC Sale," June 14, 2026. "Still adding dots" / "Conviction"; CEBE BPS metric; Le "edge case" / $3.5B 2028 preferred; holdings ~$54.36B. https://coincentral.com/strategy-mstr-stock-saylor-teases-another-bitcoin-buy-as-ceo-defends-32-btc-sale/
[12] Crypto Briefing, "Michael Saylor teases another Strategy Bitcoin purchase for Monday," June 14, 2026. Average cost ~$75,680 / ~$64B aggregate / ~4% of supply; 2026 purchase cadence. https://cryptobriefing.com/saylor-teases-strategy-bitcoin-purchase/
[13] NPR, "SpaceX IPO makes history as largest ever. Stock gains 19% on first day," June 12, 2026. SPCX close $160.95 (+19%); ~$75B raised; 555M+ shares at $135; >$2T; largest IPO; Musk first trillionaire. https://www.npr.org/2026/06/12/nx-s1-5855004/stock-ai-spacex-ipo-elon-musk
[14] CNN Business, "SpaceX shares debut after biggest IPO in history," June 12, 2026. Opened $150; intraday high $176.52; close $161.11 (+19.34%); >$2T; first trillionaire. https://www.cnn.com/2026/06/12/business/live-news/spacex-goes-public-ipo
[15] CNBC, "SpaceX IPO: SPCX live updates," June 12, 2026. SPCX-USDC perpetual futures on Hyperliquid ~$172–176; ~$322.5M 24h volume; OI >$293M; ~27–30% above IPO price. https://www.cnbc.com/2026/06/12/spacex-ipo-spcx-live-updates.html
[16] Yahoo Finance, "SpaceX stock jumps nearly 20% following largest IPO ever," June 12, 2026. Opened $150 (+11%); close $160.95 (+19.2%); priced Thursday night; Dan Ives note. https://finance.yahoo.com/markets/stocks/article/spacex-ipo-set-to-price-thursday-night-ahead-of-friday-nasdaq-debut--heres-whats-next-101955450.html
[17] Yahoo Finance / Reuters, "SpaceX weighs June 2026 IPO," 2026. Prior record: Saudi Aramco ~$29B IPO (2019) at $1.7T valuation. https://finance.yahoo.com/news/spacex-weighs-june-2026-ipo-050656741.html
[18] CoinDesk, "Bitcoin hit bottom at $59,000 marking end to the crypto winter, says Standard Chartered analyst," June 12, 2026. Kendrick cycle-low call; ETF selling to fund SpaceX; US–Iran peace; three confirmation markers; ETH-outperform view. https://www.coindesk.com/markets/2026/06/12/bitcoin-hit-bottom-at-usd59-000-marking-end-to-the-crypto-winter-says-standard-chartered-analyst
[19] Bitcoin.com News, "Bitcoin Bottom Is in: Standard Chartered Declares End of Crypto Winter," June 12, 2026. "Winter is over"; $59K / 53% / $126K; markers (Strategy Monday purchase, ETF inflows, oil decline); February $50K / $1,400 scenario. https://news.bitcoin.com/bitcoin-bottom-is-in-standard-chartered-declares-end-of-crypto-winter/
[20] CoinCentral, "Standard Chartered Says $59,000 Was the Cycle Low as Crypto Spring Begins," June 13, 2026. Hyperliquid SPCX implied valuation up to $2.4T; Brent ~$87 / WTI ~$85; Trump Truth Social walk-back; ETF outflows ~$5.72B since mid-May. https://coincentral.com/bitcoin-btc-price-prediction-standard-chartered-says-59000-was-the-cycle-low-as-crypto-spring-begins/
[21] NFT Plazas, "Standard Chartered Calls Bitcoin's $59,000 Low the Definitive Cycle Bottom," June 12, 2026. Skeptic view: monthly ETF flows still negative, leverage washout signals capitulation without conviction; $59,375 June 5; $126K ATH Oct 6, 2025. https://nftplazas.com/standard-chartered-bitcoin-59000-cycle-bottom-crypto-winter-over/
[22] Crypto Adventure, "Hyperliquid Hits Record 8.3% Share Of Global Perp Open Interest," June 2026. Record 8.3% share of aggregate global perpetual-futures open interest. https://cryptoadventure.com/hyperliquid-hits-record-8-3-share-of-global-perp-open-interest/
[23] Cryptopolitan, "Hyperliquid Crosses 7% of Exchange Perp Volume for the First Time," June 8, 2026. 7%+ of total exchange perpetual-futures volume. https://www.cryptopolitan.com/hyperliquid-perp-volume-market-share/
[24] CoinMarketCap, "Hyperliquid (HYPE) price," accessed June 15, 2026. HYPE ~$60; all-time high $75.52 (June 1). https://coinmarketcap.com/currencies/hyperliquid/
[25] Datawallet, "Hyperliquid Statistics & Trends in 2026," 2026. Perpetual-DEX market dominance and fee metrics across 2026. https://www.datawallet.com/crypto/hyperliquid-statistics
[26] Crypto Briefing, "Hyperliquid drives growth of real-world asset perps, capturing 44% of total volume," 2026. ~44% of RWA perpetual-futures volume; HIP-3 open-interest growth. https://cryptobriefing.com/hyperliquid-rwa-perps-44-percent-volume/
[27] KuCoin, "MicroStrategy Buys 1,550 BTC After 32 BTC Sale: Net Accumulator," June 2026. Net +1,518 BTC across two-week span; purchase versus sale price comparison; 845,256 BTC. https://www.kucoin.com/blog/microstrategy-buys-1550-btc-net-accumulator
[28] CNN, "World Cup highlights: Mexico defeats South Africa 2-0 in the World Cup's opening match," June 11, 2026. Opener result; tournament kickoff. https://www.cnn.com/2026/06/11/sport/live-news/world-cup-mexico-south-africa
[29] Gaming America, "Kalshi Volume for World Cup Winner Rises to $123 Million, But How Much Is Actually at Risk?," June 2026. $123M winner-market volume; ~$5.4M actually at risk. https://gamingamerica.com/news/1078255/kalshi-world-cup-volume-vs-risk
[30] The Defiant, "Polymarket World Cup Winner Markets Cross $1.8B in Volume as France-Spain Group Stage Opens," June 2026. Polymarket winner-market cumulative volume ~$1.8B. https://thedefiant.io/news/defi/polymarket-world-cup-winner-markets-1-8b-volume-france-spain
[31] DeFi Rate, "Robinhood Launches World Cup Prediction Markets Through Rothera," June 2026. Kalshi >$200M cumulative World Cup volume; pre-tournament projections >$2.5B (incl. ~$1.47B Kalshi); Robinhood–Rothera routing. https://defirate.com/news/robinhood-launches-world-cup-prediction-markets-through-rothera/
[32] Crypto Briefing, "Robinhood shifts World Cup bets to Rothera," June 4, 2026. Routing of core contracts to Rothera (ex-LedgerX, co-owned with Susquehanna); props on Kalshi; Bernstein ~quarter of Kalshi volume. https://cryptobriefing.com/robinhood-world-cup-rothera-exchange/
[33] TechCrunch, "Kalshi doubles valuation in 5 months, hitting $22B," May 7, 2026. $22B valuation; >$1B Series F led by Coatue; doubling the prior $11B Paradigm-led round. https://techcrunch.com/2026/05/07/kalshi-doubles-valuation-in-5-months-hitting-22-billion/
[34] Polymarket / Bitget, World Cup winner predictions and odds, accessed June 14, 2026. Spain and France co-favorites near 16%; tournament category volume. https://polymarket.com/event/world-cup-winner
[35] CME Group, "CME Group Announces Launch of 24/7 Cryptocurrency Futures and Options Trading," June 1, 2026. May 29 launch; inaugural weekend 7,200+ contracts / ~$50M notional; BVI; 2026 YTD crypto ADV 407,200 (+46%); avg daily OI 335,400 (+7%); McCourt on $3T 2025 notional. https://www.cmegroup.com/media-room/press-releases/2026/6/01/cme\_group\_announceslaunchof247cryptocurrencyfuturesandoptionstra.html
[36] Bitcoin.com News, "$50M in 72 Hours: CME Group's 24/7 Crypto Futures Debut Draws Institutional Demand," June 2026. Inaugural-weekend notional ~$50M. https://news.bitcoin.com/50m-in-72-hours-cme-groups-24-7-crypto-futures-debut-draws-institutional-demand/
[37] CryptoSlate, "Are 24/7 CME Bitcoin futures a volatility cure—or a new leverage trap?," June 13, 2026. ~$10B long-futures liquidations over one week; Duffy leverage-risk framing. https://cryptoslate.com/are-24-7-cme-bitcoin-futures-a-volatility-cure-or-a-new-leverage-trap/
[38] CNBC, "CPI inflation report May 2026: Prices rose 4.2% annually," June 10, 2026. +0.5% m/m; +4.2% y/y (highest since April 2023); core +0.2% m/m / +2.9% y/y; energy +3.9% m/m / +23.5% y/y; gasoline +7.0%; Trump "pay the price" comment. https://www.cnbc.com/2026/06/10/cpi-inflation-report-may-2026.html
[39] US Bureau of Labor Statistics, "Consumer Price Index—May 2026," June 10, 2026. Official CPI release; energy and gasoline detail; FOMC June 16–17 context. https://www.bls.gov/cpi/
[40] Fox Business, "May 2026 CPI inflation: BLS report shows consumer prices rose last month," June 10, 2026. CME FedWatch ~96.3% probability of a hold at 3.50–3.75%; tool sees hikes more likely than cuts this fall. https://www.foxbusiness.com/economy/cpi-inflation-may-2026
[41] TechTimes, "May 2026 CPI Forecast Hits 3-Year High," June 10, 2026. FactSet 4.2% forecast; Brent ~$107 in May; Strait of Hormuz closed since late February 2026; April FOMC 8-4 hold (third consecutive). https://www.techtimes.com/articles/318135/20260610/may-2026-cpi-forecast-hits-3-year-high-what-fed-cannot-fix-before-june-meeting.htm
[42] Investment Company Institute (ICI), "Money Market Fund Assets," June 11, 2026. Total MMF assets −$21.48B to $7.87T (week ended June 10); prior week +$109.25B to $7.89T. https://www.ici.org/research/stats/mmf
[43] Bitbase Research, "Market Insights — Issue 9," June 8, 2026. Prior-week framework: record 13-session ETF outflow streak; Strategy's 32 BTC sale; +172,000 May payrolls; HYPE round-trip; prediction-market line adoption; CME 24/7 launch; ~$59,100 June 6 low; CLARITY Act reported in the Senate.
[44] Bitbase Research, "Deep Dive 1" (five signals) and "Deep Dive 3" (three reverse signals). Signal framework referenced in Section 5.