The floor held; the buyers still did not arrive—and this week the reason was identifiable, macro, and named Kevin Warsh. Where Issue 10 distinguished the exhaustion of selling from the arrival of buying and found the first without the second, this week tested whether the post-exhaustion floor could attract demand once the Federal Reserve's June meeting cleared. It could not. Warsh's first meeting as Chair produced a unanimous hold at 3.50–3.75% wrapped around a hawkish reversal: the committee's dot plot flipped from projecting a 2026 cut to projecting a hike, the median year-end rate jumped to 3.8% from 3.4% in March, and 9 of 18 participants now see at least one hike this year. The front end repriced in hours—the 2-year Treasury yield rose roughly 15 basis points to 4.21%, its largest move on a Fed day since 2008; the dollar broke above 100 to its highest in more than a year; gold sold off; and Bitcoin, the highest-beta non-yielding asset in the complex, slid from about $66,300 toward the low-$60,000s. The bottoming-confirmation scorecard Issue 10 set up resolved two-of-three against a bottom: Strategy kept buying (1,587 BTC for $100 million) and Brent kept falling (toward $80), but the decisive marker—two consecutive days of spot-Bitcoin-ETF net inflows above roughly $100 million—was rejected outright, with the four trading days of the week netting about −$227.5 million and not a single day above $100 million. The cleanest read is that the macro rate path has become the gating variable on the bottoming question, and that until it loosens, the on-chain native track—where HYPE printed a fresh all-time high in the same week—is the only place idiosyncratic demand can still express itself.
Week of June 15 to June 21, 2026
Bitbase Research · June 22, 2026
Market Insights is Bitbase Research's short-wave companion to our Deep Dive flagship series. Each edition reviews the most structurally meaningful developments of the preceding week in compliant crypto derivatives and on-chain native infrastructure, mapped against the long-wave framework set out in our flagship reports. The previous issue recorded the week selling exhausted but buying did not confirm: spot-Bitcoin-ETF outflows decelerated by roughly an order of magnitude, Bitcoin held its early-June low near $59,000, Strategy answered its four-year first sale with a 1,550 BTC purchase, and the period's largest structural event—SpaceX's record $75 billion IPO—landed outside crypto, with its synthetic perpetual futures trading on Hyperliquid [22]. This issue records the week the Fed's June meeting tested whether the floor could draw demand—and the answer was no. This week carries the same data-scope split as prior issues, with one addition: crypto-native data covers the full seven days (June 15–21), while traditional-finance data—US spot Bitcoin and Ether ETF flows, MSTR equity, Treasury yields, the FOMC, money-market-fund data—trades or releases only on weekdays, and Friday June 19 was the Juneteenth federal holiday, with US bond and equity markets closed. All TradFi data is therefore anchored to end-of-day Thursday June 18 (ET) unless otherwise stated; crypto data extends through Sunday June 21. The June 16–17 FOMC—Kevin Warsh's first meeting as Chair, with the decision announced June 17—falls within this window and is the issue's headline.
1. The one chart that matters
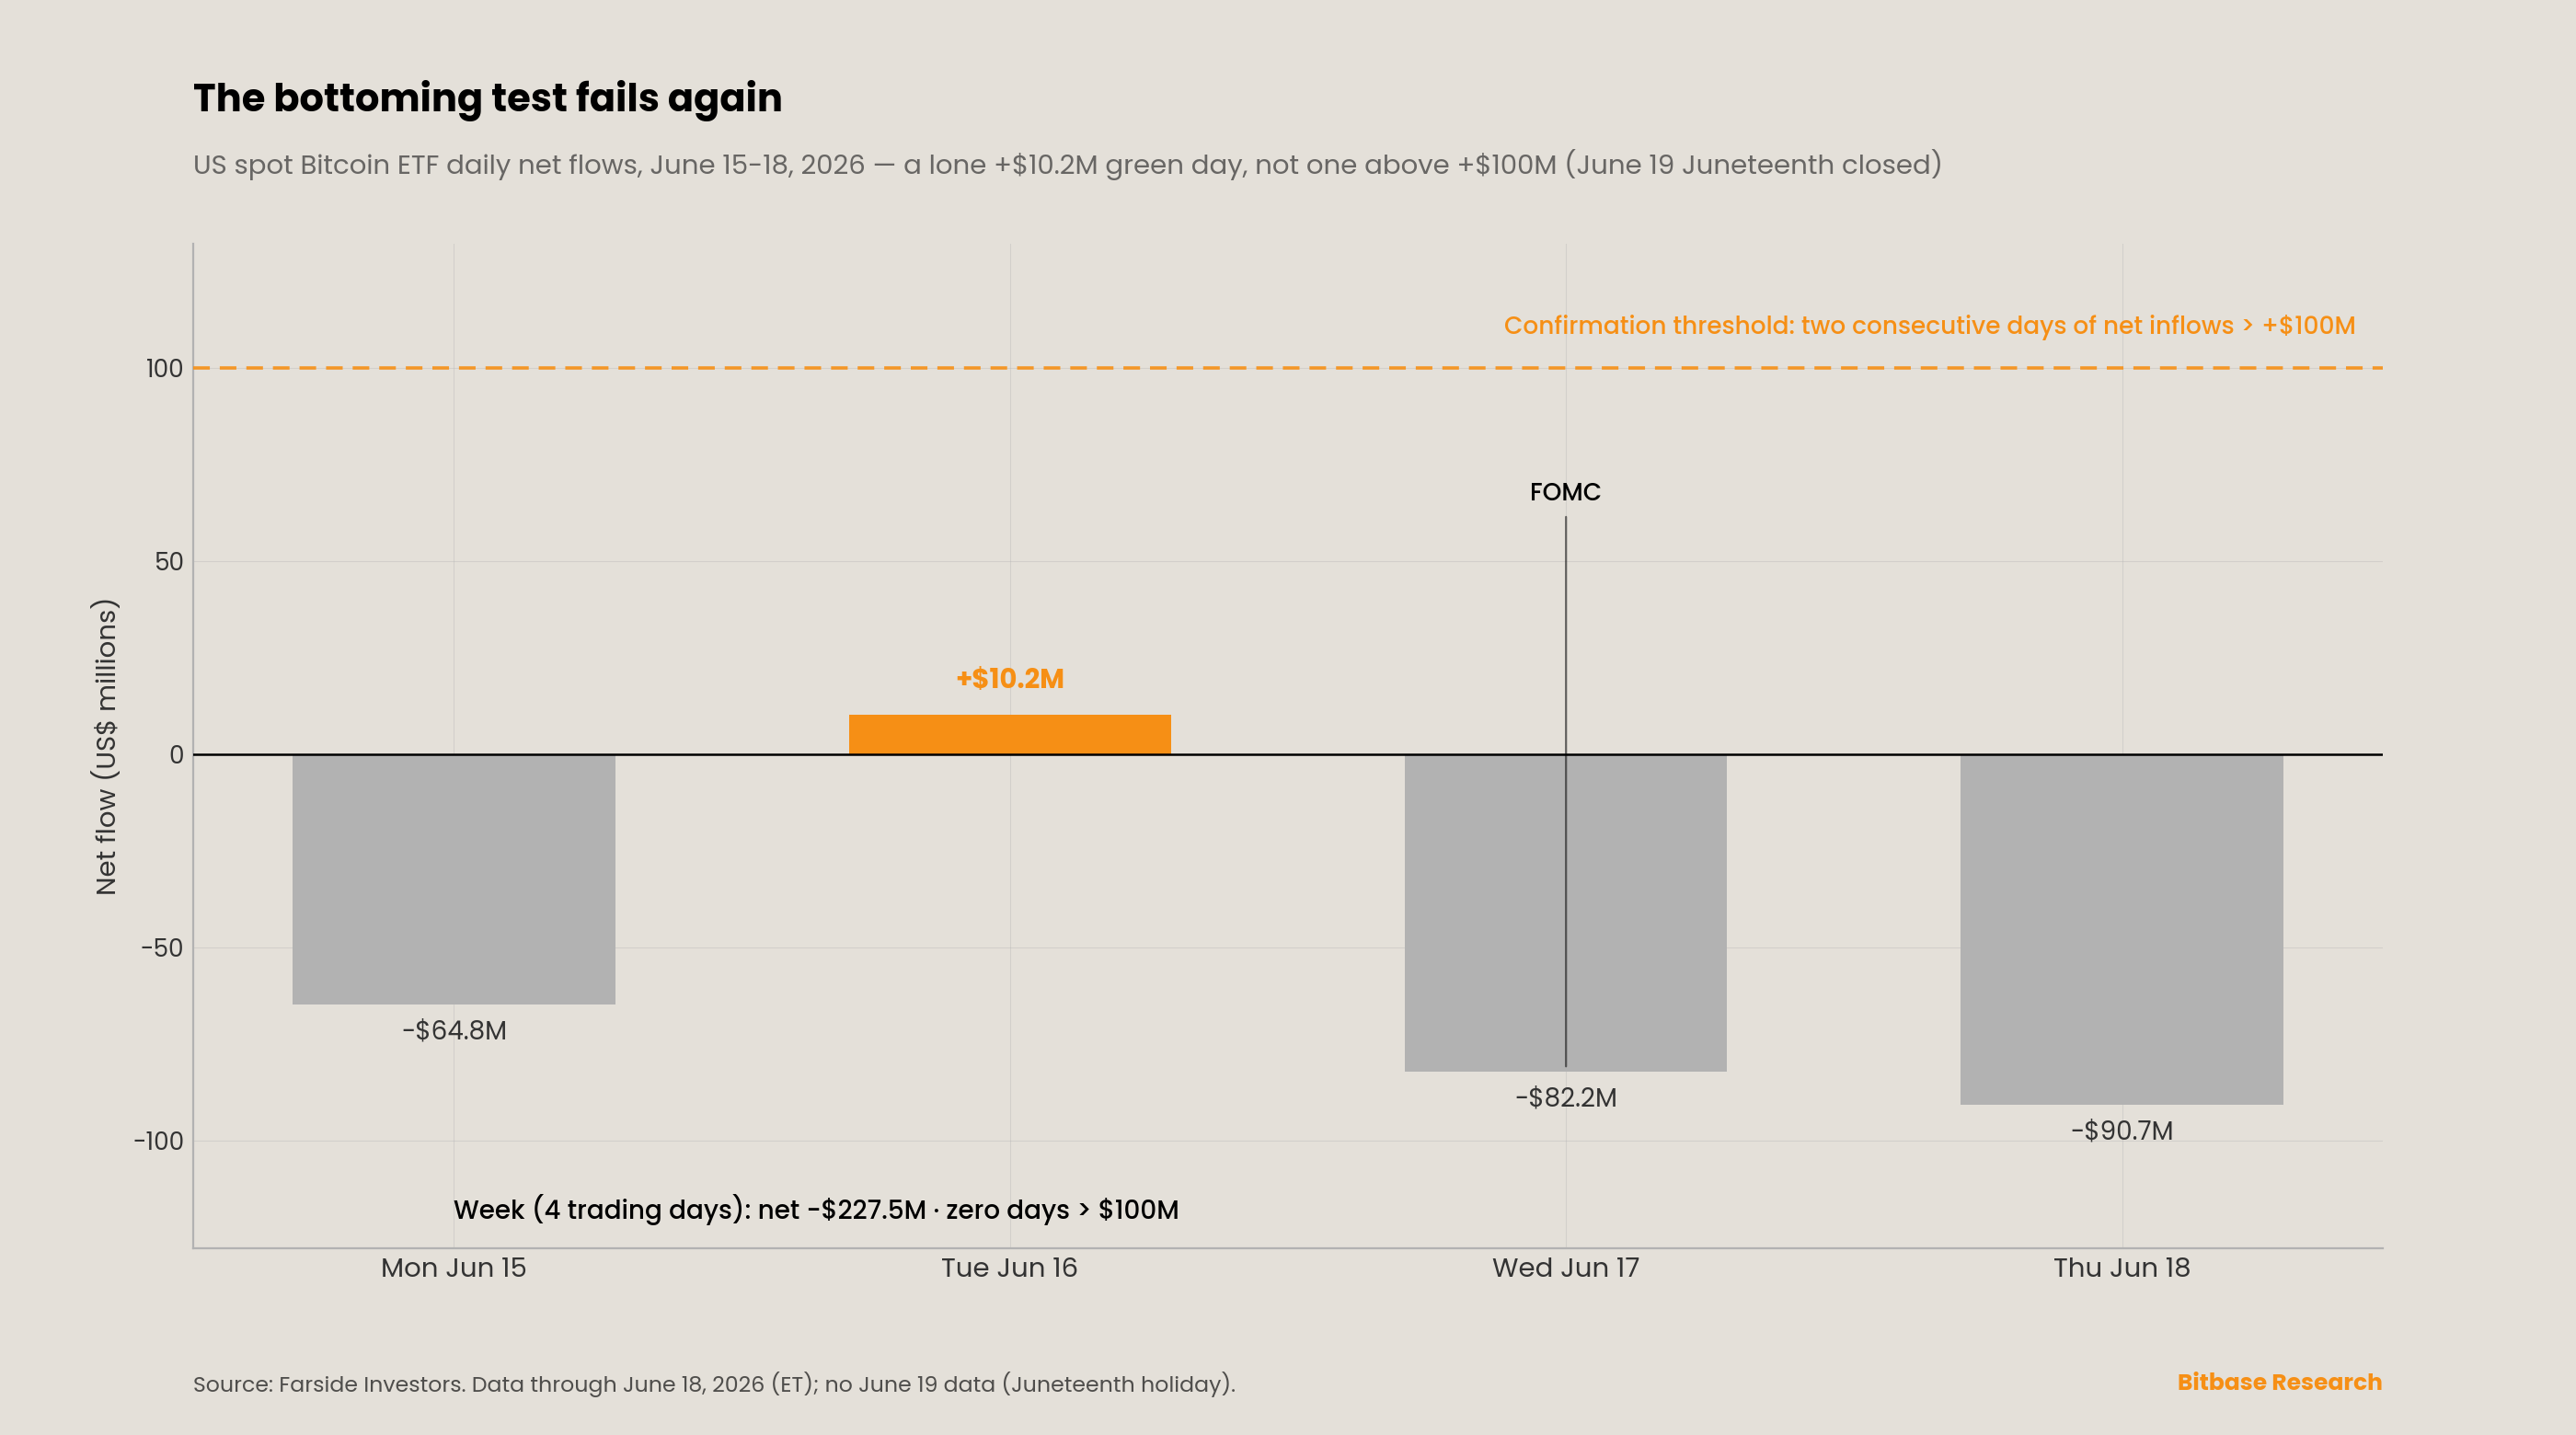
The chart repeats Issue 10's bottoming test against the same threshold—two or more consecutive days of net spot-Bitcoin-ETF inflows above roughly $100 million—and the second attempt failed more clearly than the first. Per Farside Investors, the four trading days netted −$64.8 million (June 15), +$10.2 million (June 16), −$82.2 million (June 17, FOMC day), and −$90.7 million (June 18), for a four-day total of about −$227.5 million [1][2]. There was no June 19 print: US markets were closed for Juneteenth. The single green day was a thin +$10.2 million—not the start of a streak, and an order of magnitude below the $100 million bar. The lone +$85.9 million green day that closed Issue 10 (June 12) did not compound; it fizzled. June 15's outflow was driven not by the core funds but by Grayscale's legacy GBTC (−$124.0 million) even as BlackRock's IBIT took in $66.4 million, and June 18's was IBIT-led (−$96.7 million) [1]. The cohort's cumulative net inflow since January 2024 stands at about $53.4 billion [1][3].
The cause this week was identifiable and macro. Bitcoin entered the period firmer, trading near a ~$66,300 high around June 16, then slid through the Federal Reserve's June 17 decision toward the low-$60,000s as the front end of the yield curve repriced (Section 2). Ether ETFs were modestly better than Bitcoin's but still net negative, at about −$10.0 million over the four days (Farside): +$22.5 million (June 15), +$9.6 million (June 16), −$29.3 million (June 17), and −$12.8 million (June 18) [4]. The distinction Issue 10 drew—decelerating supply versus confirmed demand—now has a clear obstruction in front of the demand side, and that obstruction is the rate path. The remainder of this issue traces the FOMC and its transmission, the corporate-treasury and on-chain tracks, the prediction-market line, and the eight signals under continuous audit, before turning in Section 6 to why the macro rate path has become the gating variable on the bottoming question.
2. This week's structural signal
The structural signal of the week was Kevin Warsh's first FOMC meeting as Chair, and it was a hawkish hold that removed the easing option markets had leaned on for a year. It matters to this series not as a rate event—the hold was near-certain—but as a regime change in the price of the risk-free rate, which sets the discount rate against which the highest-beta non-yielding asset is valued.
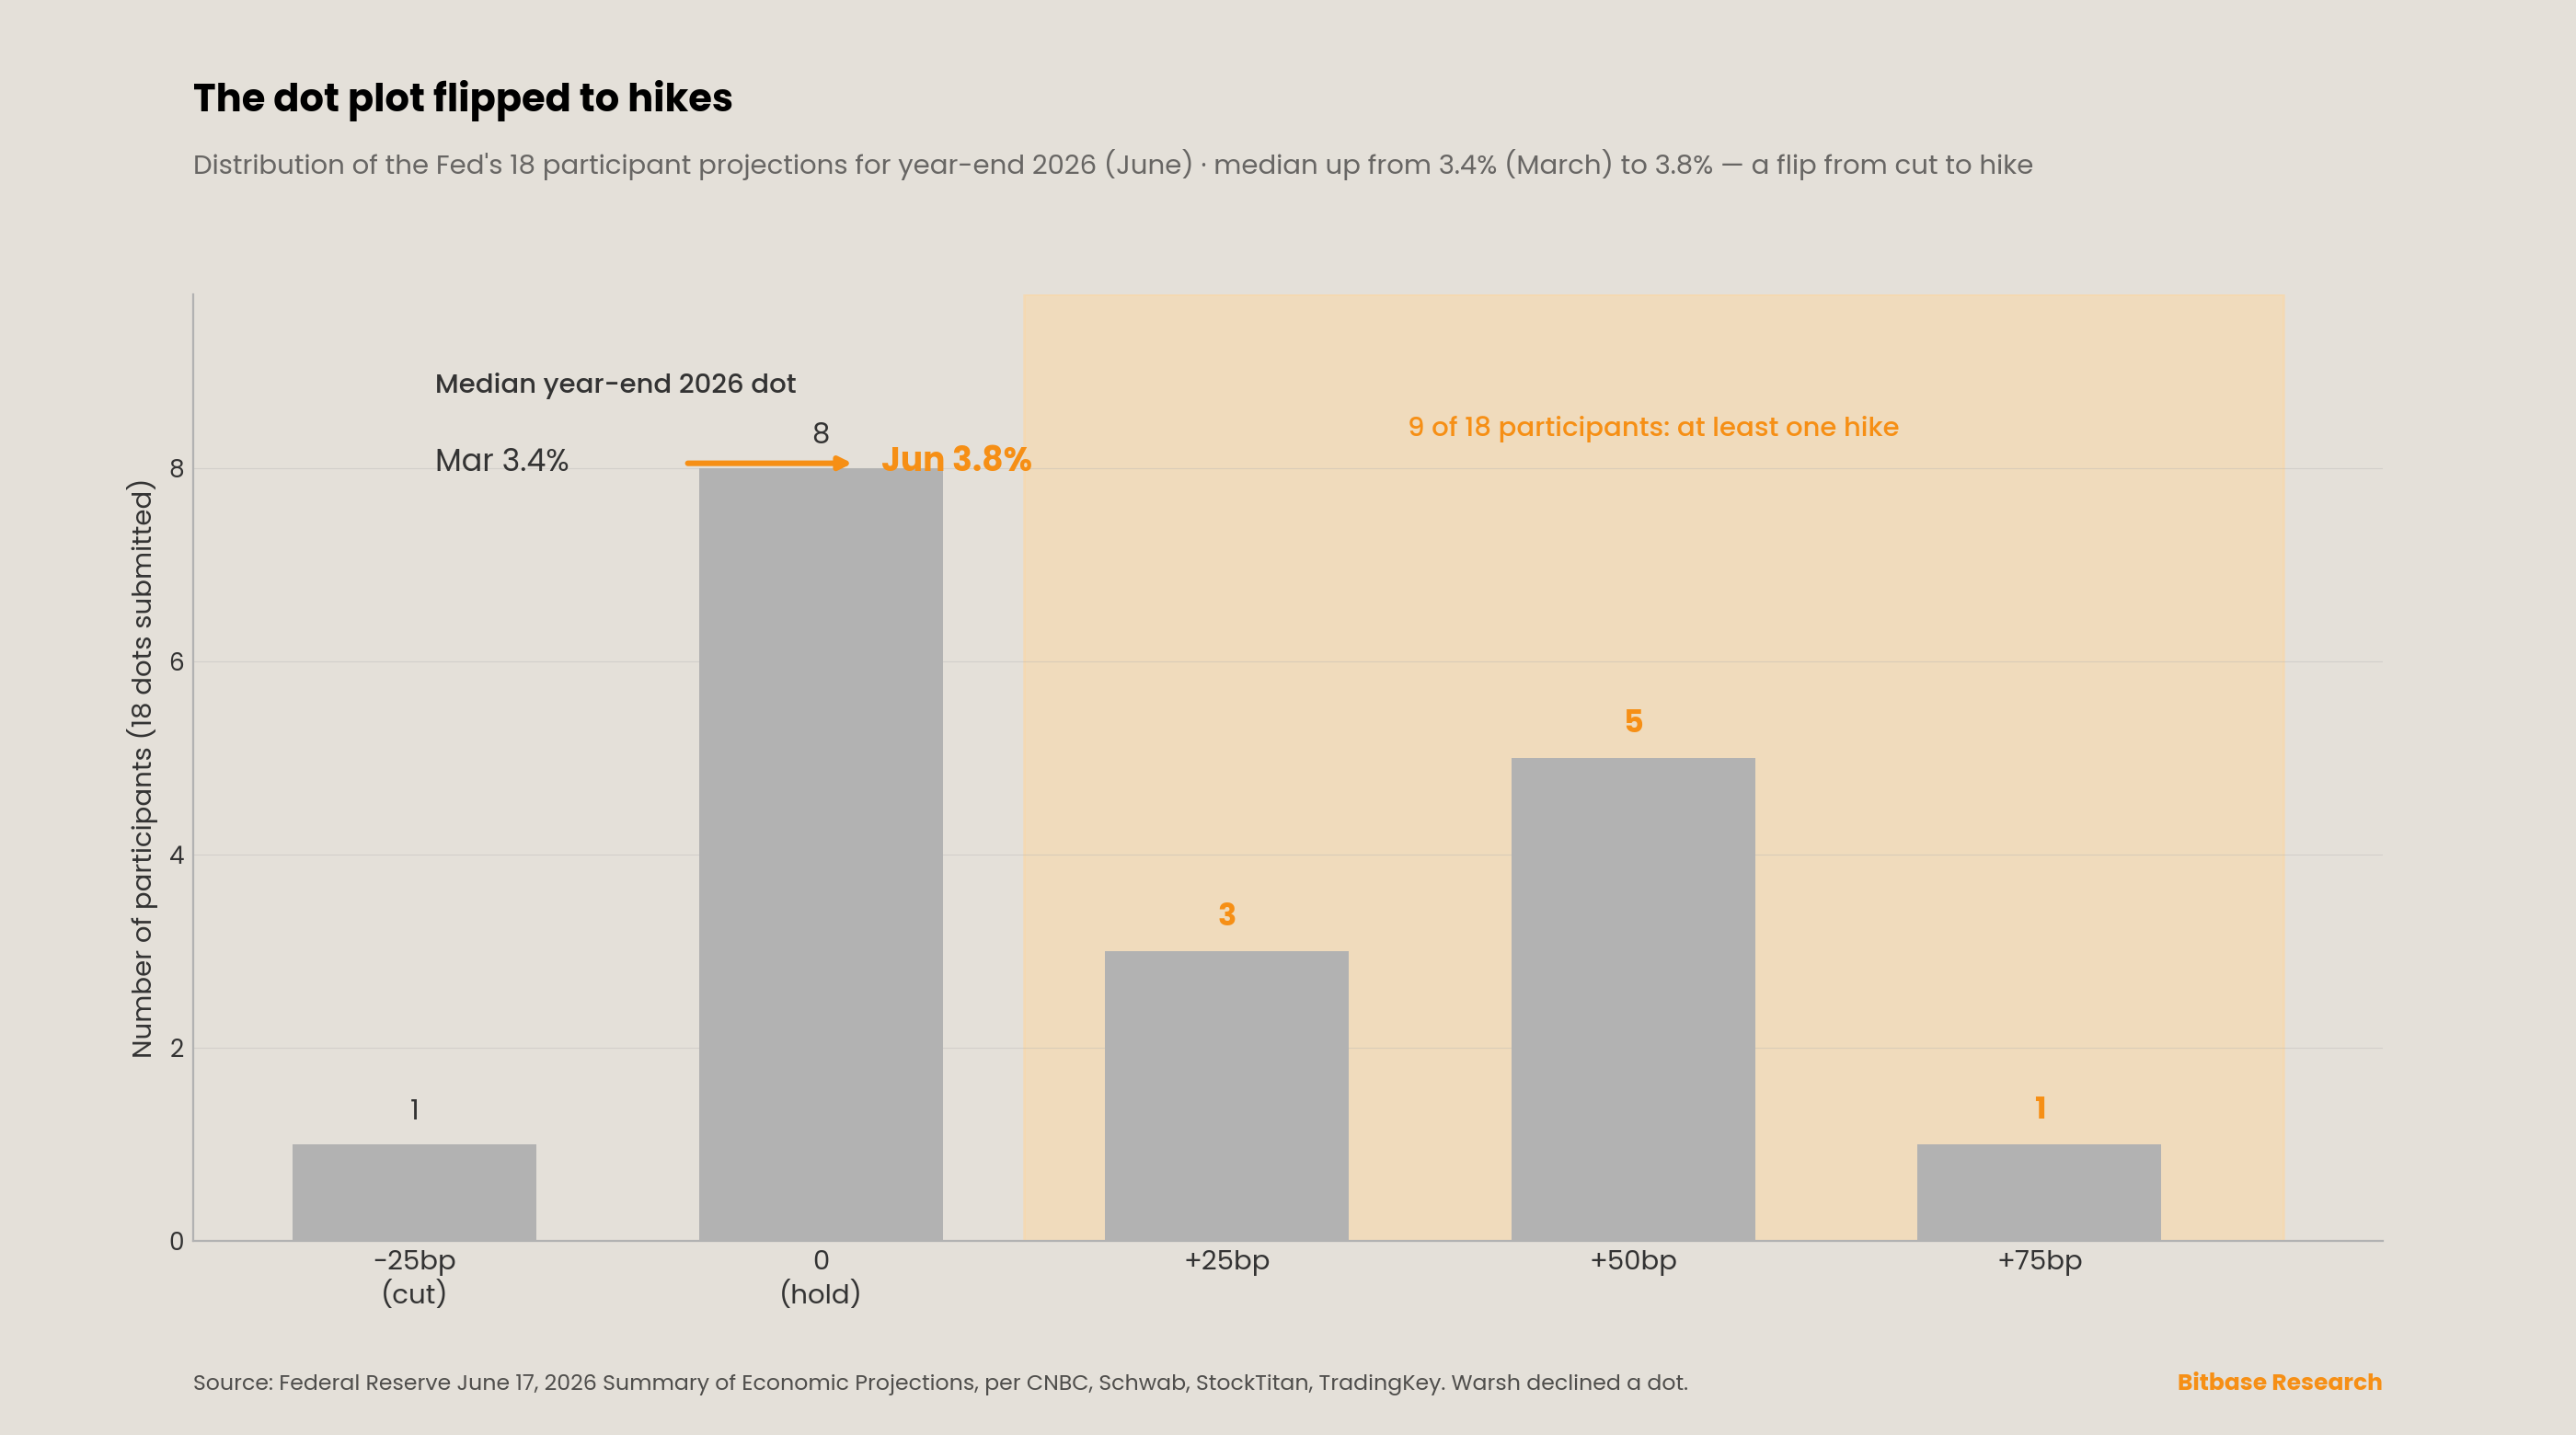
On June 17, 2026, the Federal Open Market Committee voted 12-0 to hold the federal funds rate at 3.50–3.75%, the fourth consecutive hold and Warsh's first meeting as Chair (CNBC, Fox Business, Schwab) [5][6][7]. The market-moving element was the Summary of Economic Projections. The median year-end-2026 projection rose to 3.8%, up from 3.4% in March—a flip from implying a cut to implying a hike (CNBC) [5]. Three numbers are easy to conflate and worth separating: the 12-0 vote is the FOMC's twelve voting members agreeing to hold; the eighteen dot-submitters are the wider group of participants (voters plus non-voting Reserve Bank presidents) minus Warsh, who declined to submit his own dot; and within those eighteen, the 2026 dots split 9 projecting at least one hike, 8 at the current midpoint, and 1 projecting a cut (StockTitan, Schwab) [8][7]. The risk skew was starker still: 17 of 18 participants judged inflation risks to the upside, 1 balanced, none to the downside (StockTitan) [8]. Of the nine hike-dots, one penciled +75 basis points, five +50, and three +25 (TradingKey) [9]. The committee raised its year-end PCE inflation forecast to 3.6% from 2.7% in March (core PCE to 3.3%), trimmed 2026 GDP growth to 2.2% from 2.4%, and set unemployment at 4.3% (Fox Business, Schwab) [6][7].
The statement and press conference marked a stylistic break. The post-meeting statement was cut to roughly 130 words, about two-thirds shorter than April's, removed the prior easing-bias language, and dispensed with forward guidance (Schwab, Bondsavvy) [10][11]. Warsh, a long-standing critic of the dot plot as a communications tool, declined to submit his own projection—"I did not submit a dot for me. It's not helpful in the conduct of policy," he said (CNBC)—the first chair to do so [5]. He opened by acknowledging that "Persistently high prices are a burden to the American people" (CoinDesk), emphasized that the committee would be "unambiguous and unanimous" in delivering price stability (Schwab, Fox Business), and announced five task forces to review Fed communications, the balance sheet, data sources, productivity and the labor market, and the causes and measurement of inflation, noting the inflation task force would not reconsider the 2% target at this time [12][7][6]. Context: May CPI printed +4.2% year over year (the highest since April 2023), May payrolls were +172,000, and unemployment held at 4.3%; pre-meeting, CME FedWatch had priced roughly 97% odds of a hold (CNBC) [5]. The interpretive split is real and worth reporting evenhandedly: J.P. Morgan strategists framed the hold as a committee asserting inflation-fighting credibility, while Lekker Capital's Quinn Thompson noted that "Oil is down 30% since the FOMC's last dot plot" and questioned the timing of a hawkish pivot (CoinDesk) [12].
3. Dual-track scoreboard
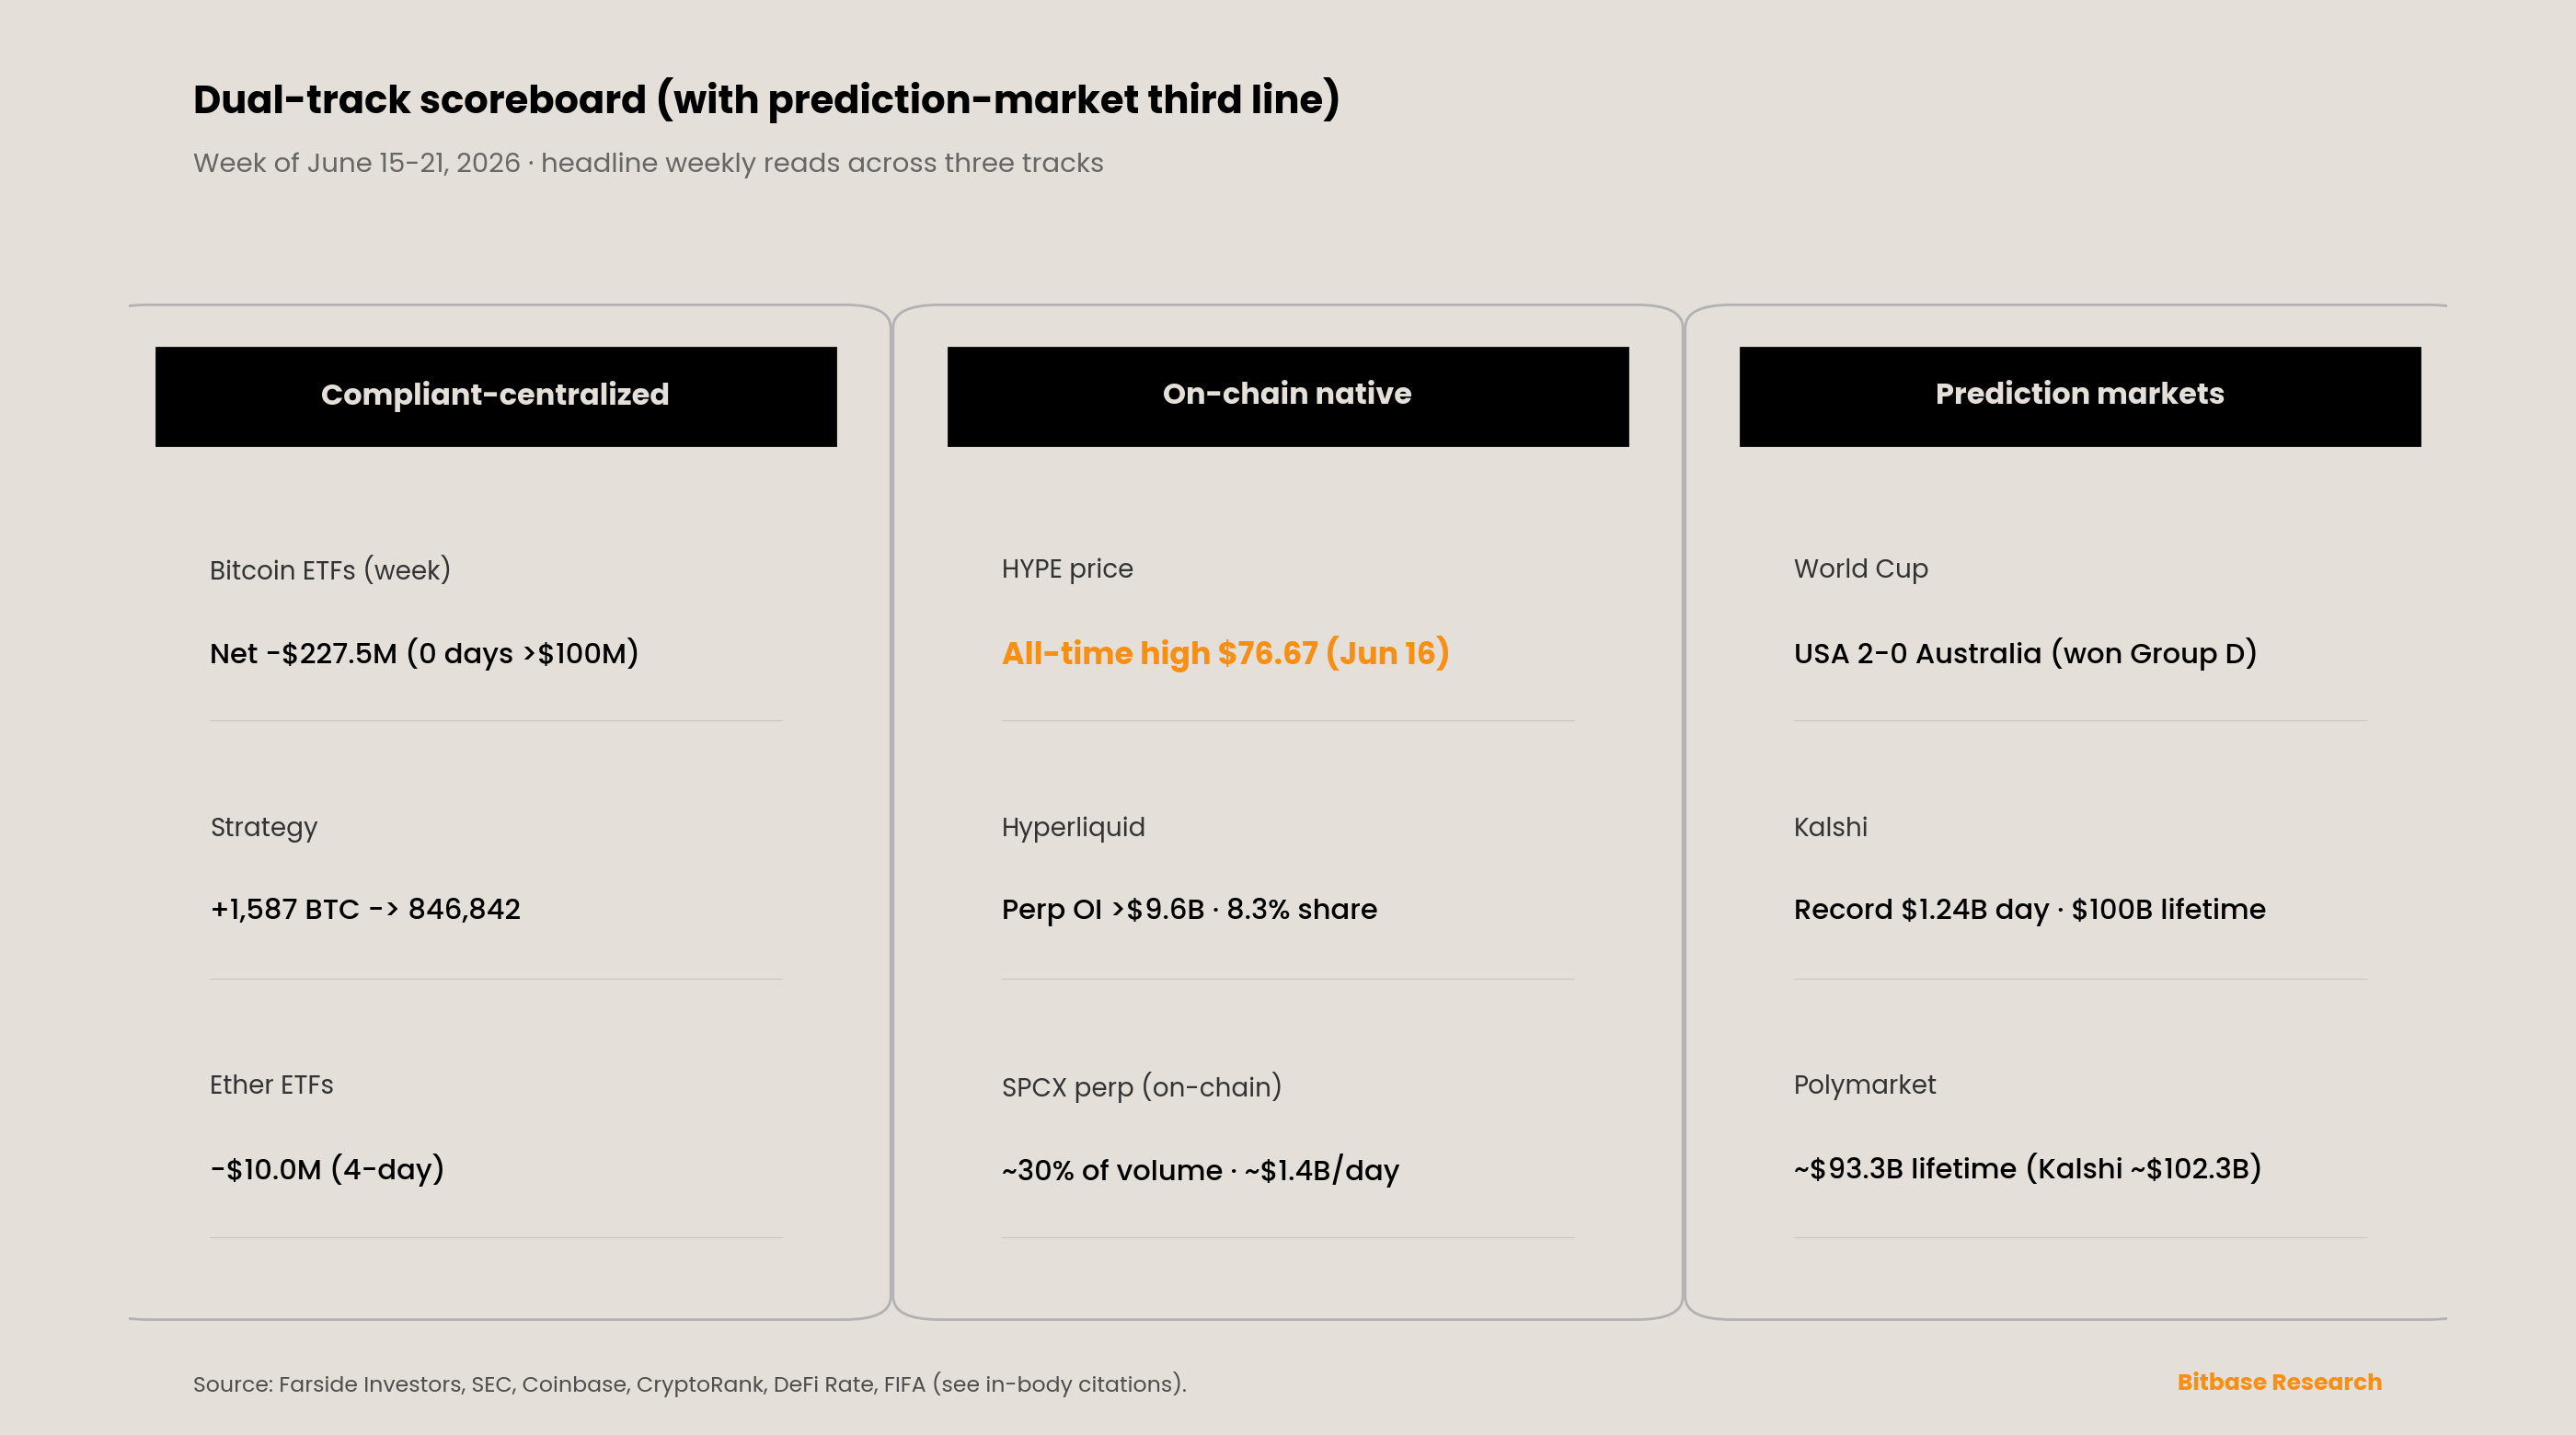
Compliant-centralized track. The week's defining corporate event was the confirmation marker that held. Per Strategy's June 15, 2026 SEC Form 8-K, the company purchased 1,587 bitcoin for approximately $100.0 million between June 8 and June 14 at an average price of $63,024, funded through at-the-market sales of MSTR Class A common stock (about 1.73 million shares for roughly $209 million), lifting holdings to 846,842 BTC at an aggregate cost of $64.07 billion (average $75,656) and raising the USD reserve to $1.1 billion [13][14]. The purchase period (June 8–14) sits in the prior window and the disclosure (June 15) in this one—consistent with the date-integrity discipline applied throughout. Coming on top of the prior week's 1,550 BTC, this was the back-to-back Monday purchase Standard Chartered's Geoffrey Kendrick had named as one of his three bottoming markers, executed at an average price well below the company's cost basis. The equity wrapper, however, was visibly stressed: MSTR traded near $112.53, down roughly 3% on the week and about 31% on the month, and Bitcoin's price (about $62,600–66,200 across the week) left the holdings carrying an unrealized loss against the $75,656 average (Barron's) [14]. Corporate-treasury conviction is intact; the financing structure around it is under strain.
On-chain native track. Detailed in Section 5; in brief, the on-chain native track decoupled sharply from the macro-tethered majors. Hyperliquid's HYPE printed a fresh all-time high of about $76.67 on June 16 (Coinbase, CoinGecko), recovering roughly 40% from the ~$53 low it touched after a June 6 token-vesting release, before settling into the high-$60s to low-$70s—still up double digits on the week even as Bitcoin fell [15][16]. Platform perpetual-futures open interest stood above $9.6 billion, and Hyperliquid's record ~8.3% share of aggregate global perpetual-futures open interest held (CryptoRank, citing CoinGlass) [17].
Prediction-market third line. The line kept setting records. Per DeFi Rate, Kalshi crossed $100 billion in lifetime notional volume and posted its first billion-dollar single days—about $1.22 billion on Saturday June 13 and a record ~$1.24 billion on Sunday June 14—closing the week of June 8 with roughly $6.38 billion in weekly notional, up about 43% week over week and a record (lifetime totals: Kalshi ~$102.3 billion, Polymarket ~$93.3 billion) [18]. The 2026 World Cup remained the proximate driver: combined Kalshi-plus-Polymarket World Cup winner-market volume topped $2 billion, and in-window the United States beat Australia 2–0 in Seattle on June 19 to win Group D and clinch a knockout berth, an outcome consistent with pre-match pricing [26]. The structural development to keep watching is distributional—Robinhood's continued routing of core contracts to Rothera, the CFTC-licensed venue it co-owns with Susquehanna—but Rothera's isolated World Cup volume remained unpublished by any Tier-1 source, so whether the routing has materially redistributed sector volume is still not measurable.
4. On the radar—week of June 22 to June 28
Several scheduled events in the week ahead bear directly on the bottoming question, and we flag them as forward markers rather than reported facts.
May PCE inflation (the Fed's preferred gauge), due late June. With the June 17 statement having raised the year-end PCE forecast to 3.6% and made policy explicitly data-dependent, the May PCE print is the first hard test of whether the hawkish projection was early or on time. A hot print validates the dot-plot pivot and keeps the dollar and front-end yields bid; a soft print is the first crack in the rate constraint.
Strategy's weekly purchase disclosure (expected Monday June 22). A third consecutive weekly purchase covering June 15–21 would extend the one confirmation leg that has held; watch SEC EDGAR for an 8-K. As of publication, none had posted for the June 15–21 window.
CME's 24/7 weekend data. The standalone 24/7 crypto weekend volumes for every weekend after the inaugural one (May 30–June 1) remained unpublished by any Tier-1 source as of June 22—the same gap flagged since Issue 10. See Section 5.
World Cup group stage, including United States–Türkiye (June 25). As the group stage concludes, the test is whether realized prediction-market volume continues to set records and whether Rothera volume becomes visible at the venue level.
The rate path and the dollar. The macro green light for the bottoming case is a reversal of the 2-year yield back below roughly 4.0% and the dollar index back below 100; the disinflationary sequence that would produce it runs through sustained sub-$80 oil and a cooler June CPI (mid-July). Until then, the rate constraint is the binding one.
5. Signal tracking update
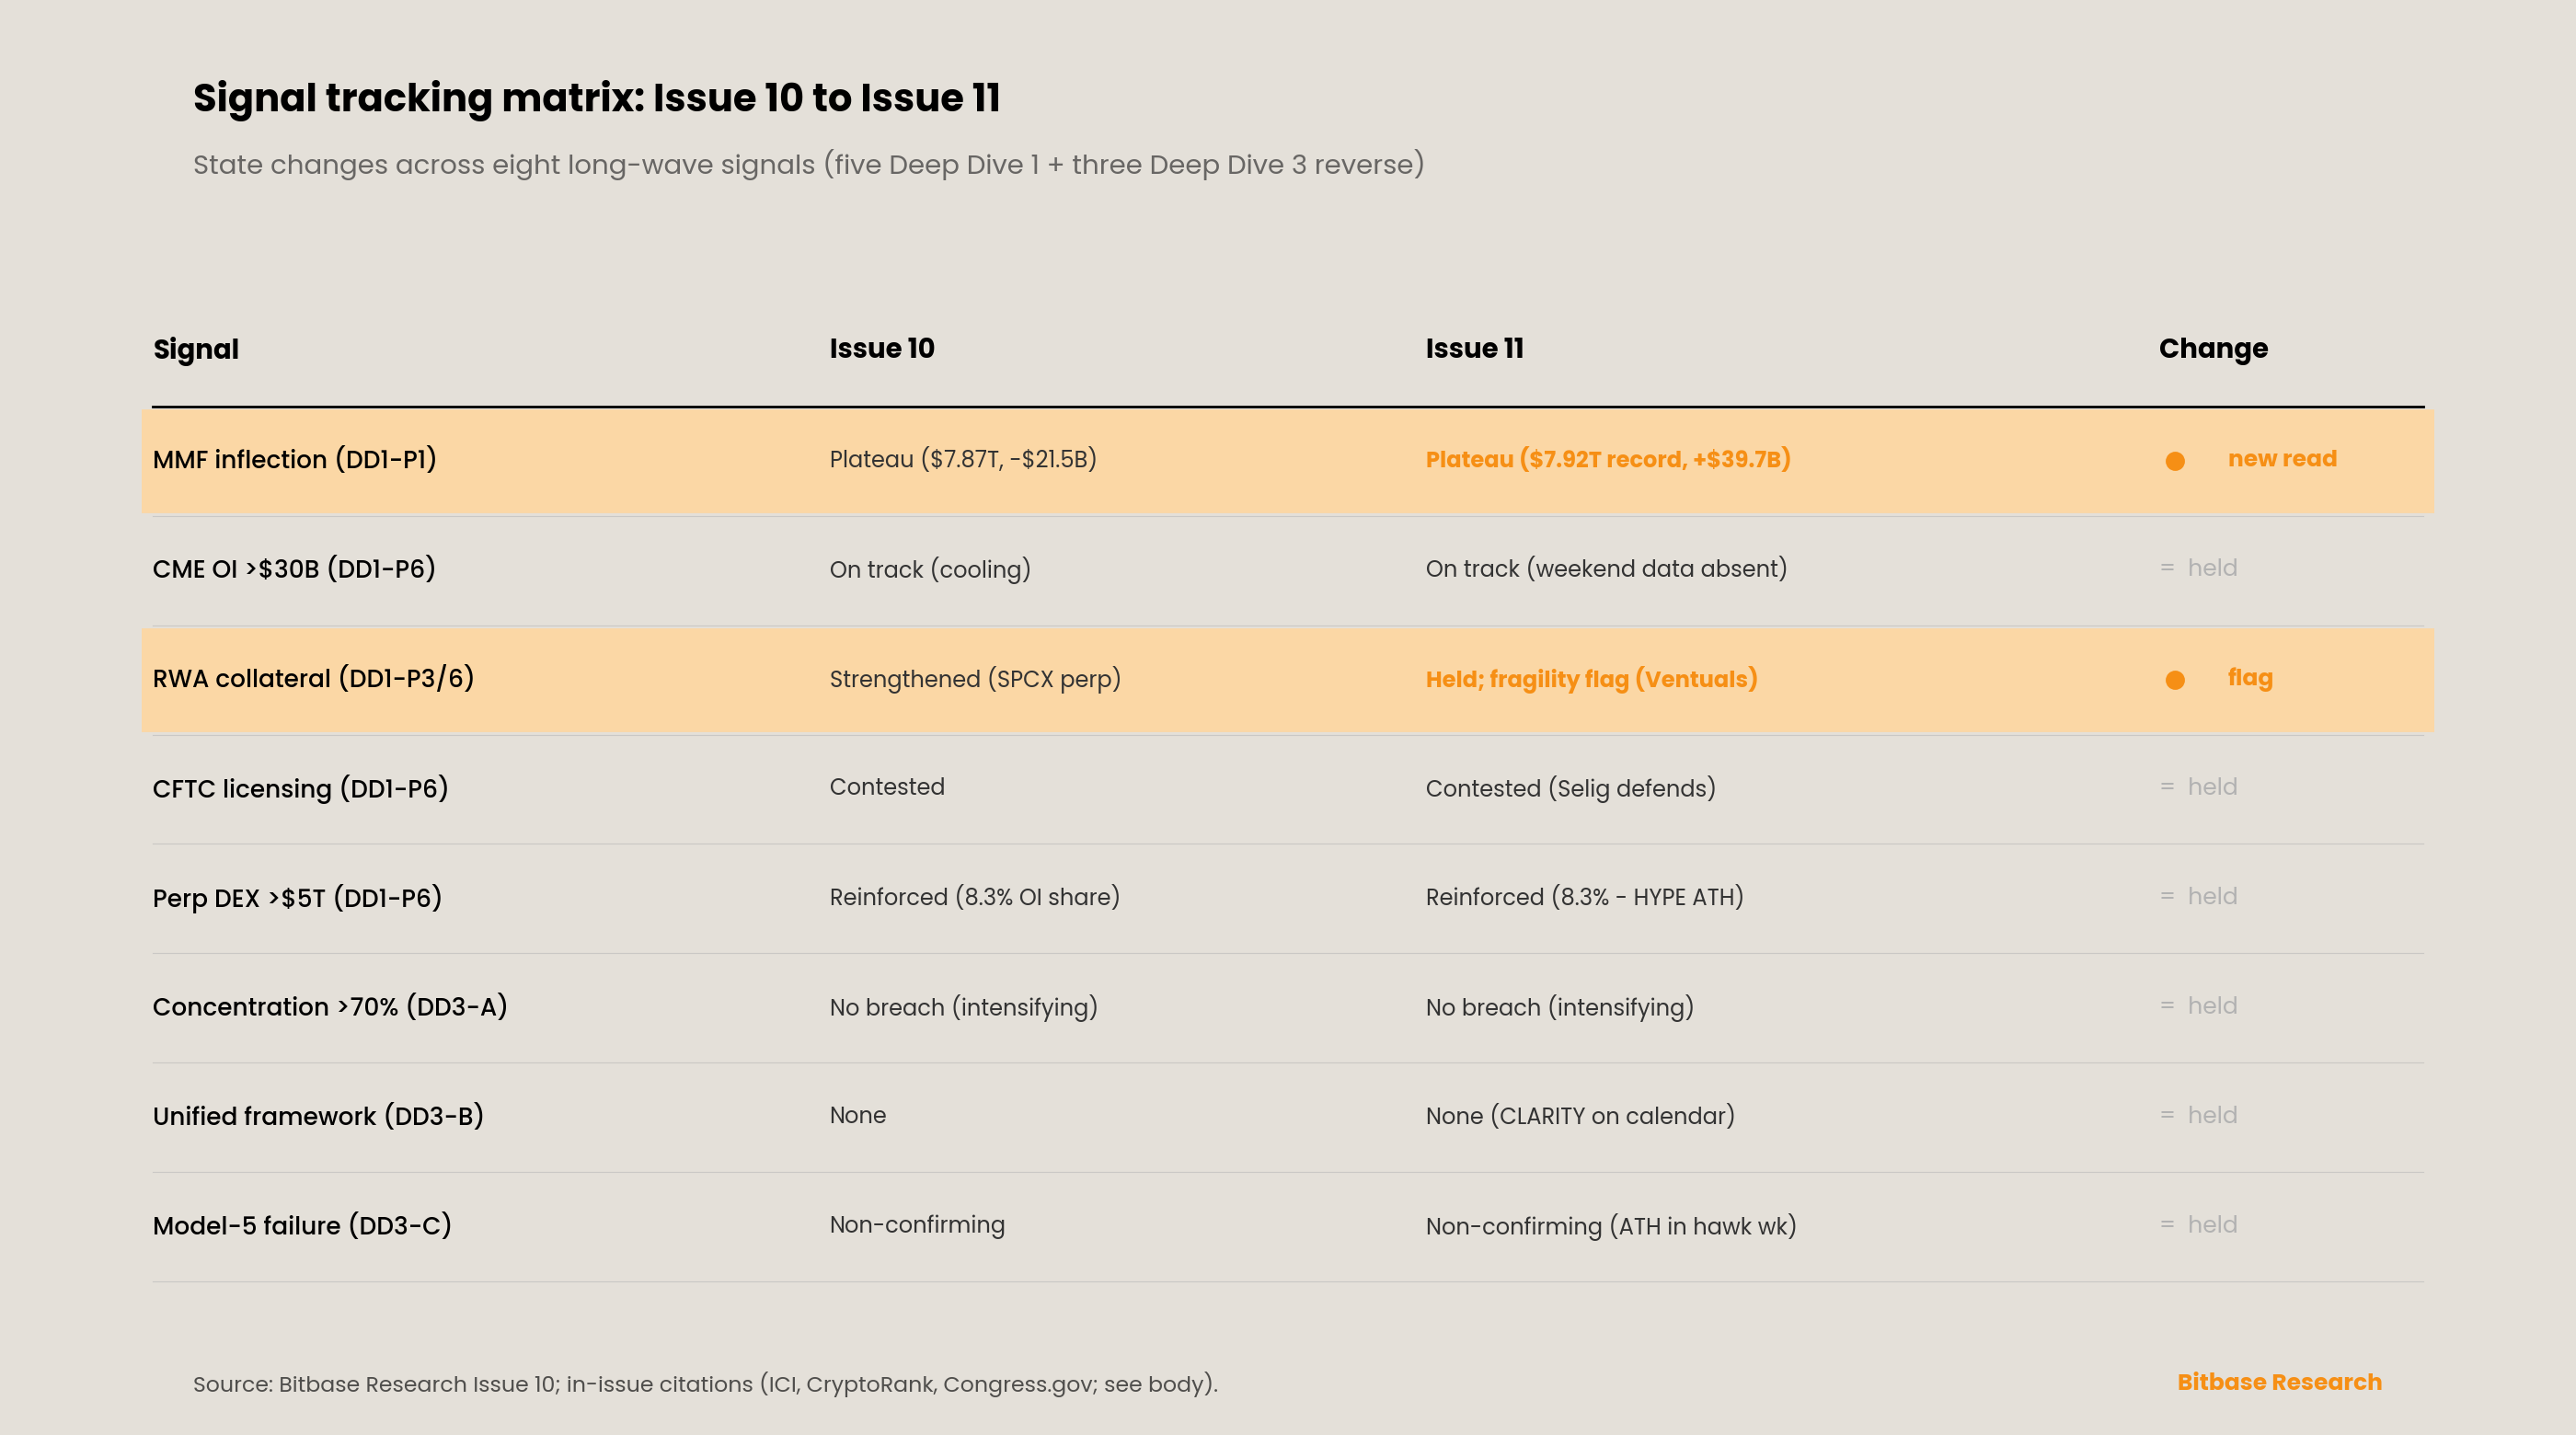
Five Deep Dive 1 signals plus three Deep Dive 3 reverse signals remain under continuous audit [19]. This issue records the money-market-fund signal logging a fresh record reading, the perpetual-DEX signal structurally reinforced, and the RWA-collateral signal carrying a newly materialized fragility flag, while the others hold their Issue 10 readings.
SIGNAL—Deep Dive 1 Part 1: "MMF asset scale inflection point." STATUS: Plateau at a fresh record; no inflection. Per the Investment Company Institute, total money-market-fund assets rose by $39.67 billion to a record $7.92 trillion for the week ended June 17 (released June 18), driven by government funds (+$36.26 billion), after a −$21.5 billion print the prior week (ICI) [23]. The cash wall extended to a record rather than rotating into risk assets; a record week of money-market balances is the opposite of the rotation this signal tracks. The signal holds at "plateau," now at a record level.
SIGNAL—Deep Dive 1 Part 6: "Whether CME crypto derivatives OI persistently holds above $30B by 2027." STATUS: On track; weekend data still absent. CME's 2026 year-to-date crypto average daily volume stands at roughly 407,200 contracts (up about 46% year over year) with average daily open interest near 335,400 contracts (up about 7%), following a record near $3 trillion in 2025 notional (CME Group) [20]. But the standalone 24/7 weekend volumes for every weekend after the inaugural one had not been published by any Tier-1 source as of June 22. The signal stays on track against full-year data; the weekend prints remain the next observable evidence and the top microstructure watch into Issue 12.
SIGNAL—Deep Dive 1 Parts 3 and 6: "Tokenized RWA as common collateral infrastructure." STATUS: Held, with a materialized fragility flag. The synthetic pre-IPO sub-layer that Issue 10 flagged for fragility produced a concrete instance: Ventuals, one of the earliest external teams building on Hyperliquid, wound down its on-chain pre-IPO platform, froze its flagship synthetic pre-IPO pairs at 24-hour average prices, and began returning deposited HYPE to users while folding into another Hyperliquid-ecosystem project (CryptoRank) [17]. At the same time, the post-IPO SPCX perpetual-futures contract remained one of the most active markets on Hyperliquid, at roughly 30% of platform volume near $1.4 billion per day (Phemex) [16]. The signal holds: the broad RWA-perp infrastructure is deepening even as one synthetic-sublayer venue retires, which is exactly the fragility qualifier Issue 10 attached—price-discovery utility and concentration risk in the same instrument.
SIGNAL—Deep Dive 1 Part 6: "Whether the U.S. CFTC approves more licensed entities to offer perpetual swap-style products by 2027." STATUS: Contested; commentary turned supportive, no new milestone. No new CFTC licensing action on perpetual-style products was confirmed in-window, but CFTC Chair Michael Selig publicly defended the approval of perpetual-futures products through regulated US venues, comments several market participants read as favorable for regulated derivatives (CryptoRank) [17]. The administrative track holds at pending; the tone around it improved.
SIGNAL—Deep Dive 1 Part 6: "Whether perpetual DEX annual trading volume holds above $5 trillion in 2026." STATUS: Structurally reinforced. Hyperliquid's record ~8.3% share of aggregate global perpetual-futures open interest held (with platform open interest above $9.6 billion), and the protocol directs the large majority of trading fees—about 97%—into HYPE buybacks, a mechanism that links token demand to platform usage and that drove HYPE's run to a fresh all-time high during a hawkish-Fed week (CoinCentral, CryptoRank) [21][17]. Per DefiLlama, Hyperliquid's share of decentralized perpetual-futures volume stood near 53%, ahead of Binance (~14%), Bybit (~9%), and Bitget (~8%) [21]. Share and open interest that hold or grow during a macro-driven risk-off week are the durable kind. HYPE's price level is a token event, not a signal-state change—the signal tracks volume.
SIGNAL (Deep Dive 3 Reverse Signal A)—Market-share concentration above 70%. STATUS: No single-venue breach; concentration intensifying. Hyperliquid's ~53% share of decentralized perpetual-futures volume, Kalshi's dominance of US prediction-market activity, and IBIT's outsized share of Bitcoin-ETF flows all point to intensifying concentration within each rail, but no single venue breached the 70% model-concentration threshold within its defined market in-window. The five-model coexistence thesis from Deep Dive 3 holds, with the concentration trend worth continued watching.
SIGNAL (Deep Dive 3 Reverse Signal B)—Cross-architecture unified regulatory framework. STATUS: No unified framework (held). The CLARITY Act remained on the Senate calendar (Calendar No. 423, placed June 1) without a floor vote in-window—Congress.gov shows no new bill text received as of June 21, and a floor vote is flagged only for after the Senate returns July 13—a single-jurisdiction legislative step rather than cross-jurisdiction harmonization [25]. No new ESMA, FCA, MAS, JFSA, BIS, or Basel coordination statement was issued. The five-model regulatory divergence documented in Deep Dive 3 remains the state of record.
SIGNAL (Deep Dive 3 Reverse Signal C)—Model 5 regulatory failure. STATUS: Maximally non-confirming (sustained). The reverse signal positing regulatory failure for the on-chain-native model wrapped by US-regulated access remains maximally non-confirming. Through a hawkish-Fed week that pressured the macro-tethered majors, the on-chain native track not only kept functioning but printed a fresh all-time high and continued to price a marquee traditional-finance listing in real time; no regulatory-failure event occurred. The leverage-trap concern around high-leverage perpetual products is a precursor flag worth noting, not a state change.
6. New dimension—the macro rate path as the gating variable on the bottoming question
Issue 10's "exhaustion of selling versus arrival of buying" frame resolves cleanly this week, and the resolution points to the issue's methodological contribution: selling exhaustion held—the floor did not break—but buying did not arrive, and the proximate cause was identifiable, macro, and not crypto-native. Warsh's hawkish debut reset the front end of the curve (the 2-year yield up about 15 basis points to 4.21%, its largest Fed-day move since 2008; the dollar through 100 to a thirteen-month high; gold lower), and that repricing transmitted directly into the highest-beta non-yielding asset. Bitcoin did not fall because its own buyers exhausted; it fell because the risk-free rate against which it is valued repriced higher in a single afternoon.
The implication is a sharper framework than Issue 10's. The bottoming question is now gated by the macro rate path: the two confirmation legs that held this week—corporate-treasury demand (Strategy) and the oil-and-disinflation leg (Brent fell roughly 8.5% on the week to near $80 as the US–Iran interim deal took effect and Strait of Hormuz traffic resumed, with the formal Geneva signing postponed June 19) [24]—are real, but they cannot overpower a Fed that is removing the easing option. The decisive demand leg, ETF inflows, failed precisely because the rate constraint tightened. A coherent statement of where the bottoming case stands is therefore conditional: it requires a 60-to-90-day disinflation sequence—sustained sub-$80 oil, a cooler June CPI in mid-July, and a less-hawkish set of September dots—that loosens the rate constraint and lets ETF demand re-engage. Until that sequence prints, the early-June low near $59,000 is untested support, not a confirmed floor, and the macro green light is observable and specific: the 2-year yield back below roughly 4.0% and the dollar index back below 100.
That framing also elevates a divergence worth tracking on its own. In the same week that the macro-tethered majors fell on the rate repricing, HYPE printed a fresh all-time high, driven by mechanics that are independent of the rate path—a fee-buyback engine tied to platform usage, perpetual-DEX share gains, and a flood of post-IPO SPCX volume. The on-chain native track is where idiosyncratic, non-macro demand can still express itself when the rate constraint is binding on the majors. We flag the on-chain/macro decoupling as a candidate standing dimension, and a likely "new dimension" for Issue 12: if the rate path stays hostile, the question becomes how far crypto-native flows can decouple from rate-driven majors, and for how long.
Caveats
Date integrity and the Juneteenth closure. Friday June 19 was the Juneteenth federal holiday; US bond and equity markets were closed, so there are no June 19 spot-ETF flows, Treasury yields, or MSTR prices, and TradFi data for the week anchors to Thursday June 18. Crypto-native data extends through Sunday June 21. Strategy's 1,587 BTC purchase covered June 8–14 and was disclosed June 15; the disclosure is in-window, the transaction period is not. The June 16–17 FOMC is in-window (decision June 17). May PCE (late June) and the United States–Türkiye match (June 25) fall just after this window.
Verification status. The load-bearing figures in this issue—the FOMC decision, vote, and dot plot; the market transmission (2-year yield, dollar, gold, equities); the spot-Bitcoin-ETF daily series; Strategy's purchase and holdings; the ICI money-market-fund figure; Brent's weekly move; and the United States–Australia result—have been traced to primary or named Tier-1 sources. The one figure carried at lower precision is the exact Sunday June 21 Bitcoin close, given as approximately $64,000–64,260 (Yahoo Finance) pending a final spot read; the weekly path is stated in ranges accordingly.
Data-caliber conflicts flagged. HYPE all-time high: $76.67 (Coinbase, CoinGecko, Phemex) versus $76.70–$76.90 across other trackers—immaterial; we use $76.67. FOMC statement length: roughly 130 words (Schwab, Bondsavvy); some outlets cite ~114, and the precise count varies by what is included. The 2-year yield move is cited as +15 basis points to 4.21% on June 17 (Schwab) and "more than 16 basis points" by CNBC/MUFG; we use ~15bp to 4.21%. The dollar index broke 100 to roughly 100.2–100.4 (its highest in over a year); the figure is not ~101. The early-June Bitcoin low conflict from prior issues persists (~$59,100 on June 6 per Issue 9 versus $59,375 on June 5 per CoinDesk/Standard Chartered).
Source attribution. US spot Bitcoin and Ether ETF daily-flow figures are Farside Investors, subject to T+1 revision and not issuer-direct; Strategy holdings and purchase terms are from the company's June 15 SEC Form 8-K as reported; FOMC figures are from the Federal Reserve's June 17 statement and Summary of Economic Projections as reported by named outlets; HYPE and Hyperliquid figures are per Coinbase, CoinGecko, CoinCentral, CryptoRank (citing CoinGlass and DefiLlama), and Phemex.
Causation discipline. All causal attributions—the rate repricing driving Bitcoin lower, ETF holders responding to the dollar and yields, the fee-buyback mechanism driving HYPE, oil driving the disinflation path—reflect the cited outlets' framing and named analysts' stated reasoning, not independent Bitbase inference.
Genuinely unavailable as of June 22, 2026: standalone CME 24/7 weekend crypto volumes for any weekend after the inaugural one (May 30–June 1); Rothera's isolated World Cup volume; a confirmed Strategy filing covering the June 15–21 purchase window.
This is not investment advice. Bitbase Research does not make price predictions or recommend positions; third-party forecasts and analyst views referenced here, including Standard Chartered's prior cycle-low call and Lekker Capital's commentary, are reported as named analysts' views, not adopted. Figures are anchored to end-of-day Thursday June 18 (ET) for TradFi and Sunday June 21 for crypto-native data unless otherwise stated.
References
[1] Farside Investors, "Bitcoin ETF Flow (US$m)," accessed June 22, 2026. Daily US spot Bitcoin ETF net flows June 15–18; fund-level detail; cumulative ~$53.4B. https://farside.co.uk/btc/
[2] Spotedcrypto, "Bitcoin ETF Inflows June 2026: IBIT Ends Record Outflow Streak," June 2026. Corroborates Farside daily table: June 18 ≈ −$90.7M (IBIT-led); BlackRock launched the iShares Premium Income Bitcoin ETF (BITA) on Nasdaq June 16; cumulative June 1–18 ≈ −$2.27B. https://www.spotedcrypto.com/bitcoin-etf-outflows-june-2026-ibit-recovery/
[3] Yahoo Finance, "Bitcoin ETF Outflows Hit Record $6.35 Billion: Has Selling Peaked?," June 2026. Cumulative net inflows ~$53.4B (Farside); IBIT ~$62.1B since launch, GBTC −$27B; BTC ~$64,260, ~49% below the $126,080 October 6, 2025 record. https://finance.yahoo.com/markets/crypto/articles/bitcoin-etf-outflows-hit-record-114002324.html
[4] Farside Investors, "Ethereum ETF Flow (US$m)," accessed June 22, 2026. Daily US spot Ether ETF net flows June 15–18 (~−$10.0M four-day). https://farside.co.uk/eth/
[5] CNBC, "Fed interest rate decision June 2026: Fed holds rates steady," June 17, 2026. 12-0 hold at 3.50–3.75%; median 2026 dot 3.8% (from 3.4%); 8 no change / 1 cut / 9 hike; Warsh "I did not submit a dot"; statement language; pre-meeting CME FedWatch. https://www.cnbc.com/2026/06/17/fed-interest-rate-decision-june-2026.html
[6] Fox Business, "June FOMC: Fed holds interest rates steady as Warsh era begins," June 17, 2026. 12-0 vote; PCE 3.6% (from 2.7%), GDP 2.2%, unemployment 4.3%; five task forces; Powell remains a governor and FOMC voter; Warsh confirmed May 13, sworn in May 22. https://www.foxbusiness.com/economy/federal-reserve-interest-rate-decision-june-17-2026
[7] Charles Schwab, "Fed Interest Rates: FOMC," June 17, 2026. Hawkish hold; dot plot 9 hike / 8 hold / 1 cut; 2-year yield ended +15bp at 4.21%, 10-year 4.49%; three major indexes down ~1%+; Warsh "unambiguous and unanimous." https://www.schwab.com/learn/story/fomc-meeting
[8] StockTitan, "Fed rate decision June 17, 2026," June 17, 2026. Untangles the three figures: 12-0 vote (voters), 18 dot-submitters (participants minus Warsh), 2026 dots 8 midpoint / 1 below / 9 above; 17 of 18 saw inflation risks to the upside. https://www.stocktitan.net/articles/fed-rate-decision-june-17-2026
[9] TradingKey, "June Fed decision: rates held, dot plot raised," June 17, 2026. Of the dot-submitters: one +75bp, five +50bp, three +25bp, eight unchanged, one −25bp; core PCE 3.3%; 2027 dispersion 3.0%–4.4%. https://www.tradingkey.com/analysis/economic/central-banks/261973912-fed-federal-fomc-2-economic-projections-decision-rates-tradingkey
[10] Charles Schwab, "Schwab Market Update (open)," June 18, 2026. Statement ~130 words; S&P 500's worst Fed day under a new leader since 1994; June 19 Juneteenth closure; Thursday equities recovered some ground; May PCE due late June. https://www.schwab.com/learn/story/stock-market-update-open
[11] Bondsavvy, "June 2026 Fed Dot Plot," June 17, 2026. Statement ~130 words, about two-thirds shorter than April; 18 dots for 2026 (17 for 2028); Warsh declined a dot; June statement "The Committee will deliver price stability." https://www.bondsavvy.com/fixed-income-investments-blog/fed-dot-plot
[12] CoinDesk, "Live markets: Bitcoin bottom signal as holders absorbed 125,000 BTC in June," June 17, 2026. Warsh "Persistently high prices are a burden to the American people"; intraday 2Y +9bp to 4.14%, 10Y 4.46%, BTC ~$65,300; Quinn Thompson "Oil is down 30% since the FOMC's last dot plot"; post-decision ~80% odds of a 2026 hike. https://www.coindesk.com/tech/2026/06/17/live-markets-a-bitcoin-bottom-signal-flashed-as-holders-absorbed-125-000-btc-in-june
[13] Strategy Inc., SEC EDGAR Form 8-K (filed June 15, 2026; CIK 0001050446, accession 000119312526270311). 1,587 BTC for $100.0M at avg $63,024 (June 8–14), ATM-funded; holdings 846,842 BTC at $64.07B aggregate (avg $75,656); USD reserve $1.1B. https://www.sec.gov/Archives/edgar/data/0001050446/000119312526270311/mstr-20260504.htm
[14] Barron's / Yahoo Finance, "Strategy Sells Shares to Buy Bitcoin. What This Means for MSTR Stock," June 2026. ~1.73 million MSTR shares sold to buy 1,587 BTC; 846,842 BTC at avg $75,656, $64.07B; BTC ~$62,600 at writing; Q1 2026 BTC yield 9.4%. https://finance.yahoo.com/markets/crypto/articles/strategy-sells-shares-buy-bitcoin-150002164.html
[15] Coinbase, "Hyperliquid (HYPE) Price," accessed June 20, 2026. HYPE all-time high $76.67 on June 16, 2026; ~$69.26 (June 20), ~+14% week over week from ~$60.81. https://www.coinbase.com/price/hyperliquid
[16] Phemex, "Hyperliquid Price Today and Why HYPE Hit a New All-Time High," June 17, 2026. ATH $76.67 (June 16); recovery from ~$53 June 6 vesting-release low; ~$11.5M short squeeze; SPCX perps ~30% of volume at ~$1.4B/day; 90%+ of revenue into buybacks. https://phemex.com/blogs/hyperliquid-price-today-hype-all-time-high
[17] CryptoRank (via Invezz), "HYPE hits new all-time high: can Hyperliquid's rally extend toward $90?," June 2026. ~8.3% of global perpetual-futures open interest (>$9.6B); annualized protocol revenue >$1B; SPCX pre-IPO volume ~$1.2B on the week; Ventuals winding down its synthetic pre-IPO platform and returning HYPE; CFTC Chair Michael Selig defended regulated perpetual-futures approval. https://cryptorank.io/news/feed/d7968-hype-hits-new-all-time-high-can-hyperliquids-rally-extend-toward-90
[18] DeFi Rate, "2026 World Cup Odds: Live Kalshi & Polymarket Predictions," June 15, 2026. Kalshi crossed $100B lifetime; first billion-dollar days ~$1.22B (June 13) and record ~$1.24B (June 14); ~$6.38B weekly notional (week of June 8), +43% w/w; lifetime Kalshi ~$102.3B vs Polymarket ~$93.3B. https://defirate.com/prediction-markets/world-cup-odds/
[19] Bitbase Research, "Deep Dive 1" (five signals) and "Deep Dive 3" (three reverse signals). Signal framework referenced in Section 5.
[20] CME Group, "CME Group Announces Launch of 24/7 Cryptocurrency Futures and Options Trading," June 1, 2026. May 29 launch; inaugural weekend 7,200+ contracts / ~$50M notional; 2026 YTD crypto ADV 407,200 (+46%); avg daily OI 335,400 (+7%); record ~$3 trillion 2025 notional. https://www.cmegroup.com/media-room/press-releases/2026/6/01/cme\_group\_announceslaunchof247cryptocurrencyfuturesandoptionstra.html
[21] CoinCentral, "Hyperliquid (HYPE) Price: Token Hits All-Time High as Open Interest Rises 32% in One Week," June 2026. ATH $76.90 June 16; HYPE-futures OI +32% on the week to ~$3B; total platform OI >$9.6B; 53% of decentralized perp volume (Binance ~14%, Bybit ~9%, Bitget ~8%); 97% of fees to buy-and-burn; Bitwise bought ~77,100 HYPE; ETF inflows ~$208M since launch. https://coincentral.com/hyperliquid-hype-price-token-hits-all-time-high-as-open-interest-rises-32-in-one-week/
[22] Bitbase Research, "Market Insights — Issue 10," June 15, 2026. Prior-week framework: ETF outflows decelerated; the early-June ~$59,000 low held; Strategy's 1,550 BTC purchase; SpaceX's record IPO and its synthetic perpetual futures on Hyperliquid; Standard Chartered's cycle-low call and three confirmation markers; the exhaustion-of-selling-versus-arrival-of-buying framework.
[23] Investment Company Institute, "Money Market Fund Assets," June 18, 2026. Total MMF assets +$39.67 billion to a record $7.92 trillion for the week ended June 17 (government funds +$36.26 billion); prior week −$21.5 billion. https://www.ici.org/research/stats/mmf
[24] Trading Economics, "Brent crude oil," June 19, 2026. Brent near $80 on Friday, on track for a weekly decline of roughly 8.5%, erasing most of the conflict-driven gains as the US–Iran interim peace took effect and Strait of Hormuz traffic resumed; planned Switzerland talks postponed. https://tradingeconomics.com/commodity/brent-crude-oil
[25] Congress.gov, "H.R.3633 — Digital Asset Market Clarity Act," accessed June 21, 2026; and CoinDesk, "Clarity Act clears U.S. Senate committee," May 14, 2026. No new bill text received as of June 21; 15-9 Senate Banking Committee vote (May 14); placed on the Senate Legislative Calendar (No. 423) June 1; 60-vote floor threshold; possible floor vote after the Senate returns July 13; White House July 4 signing target. https://www.congress.gov/bill/119th-congress/house-bill/3633/text
[26] FIFA and NPR, "USA 2-0 Australia, 2026 FIFA World Cup," June 19, 2026. United States 2–0 Australia at Seattle Stadium (Burgess own goal 11', Freeman 43'); US won Group D and clinched a Round-of-32 berth; Pulisic absent (calf); next USA–Türkiye June 25. https://www.npr.org/2026/06/19/nx-s1-5863602/2026-fifa-world-cup-usmnt-australia


