
The Strait of Hormuz whipsawed markets, but the structural signal is in the flows: the strongest ETF week since January, MSBT crossing $100 million, and the first sharp decline in money market fund assets this cycle.
Week of April 13–17, 2026
Bitbase Research · April 20, 2026
Market Insights is Bitbase Research's short-wave companion to our Deep Dive flagship series. Each edition reviews the most structurally meaningful developments of the preceding week in compliant crypto derivatives and on-chain native infrastructure, mapped against the long-wave framework set out in our flagship report on the 2026–2030 dual-track divergence. Our goal is not to report prices. It is to audit, in real time, whether the data is confirming or falsifying the theses we have staked in public.
1. The one chart that matters
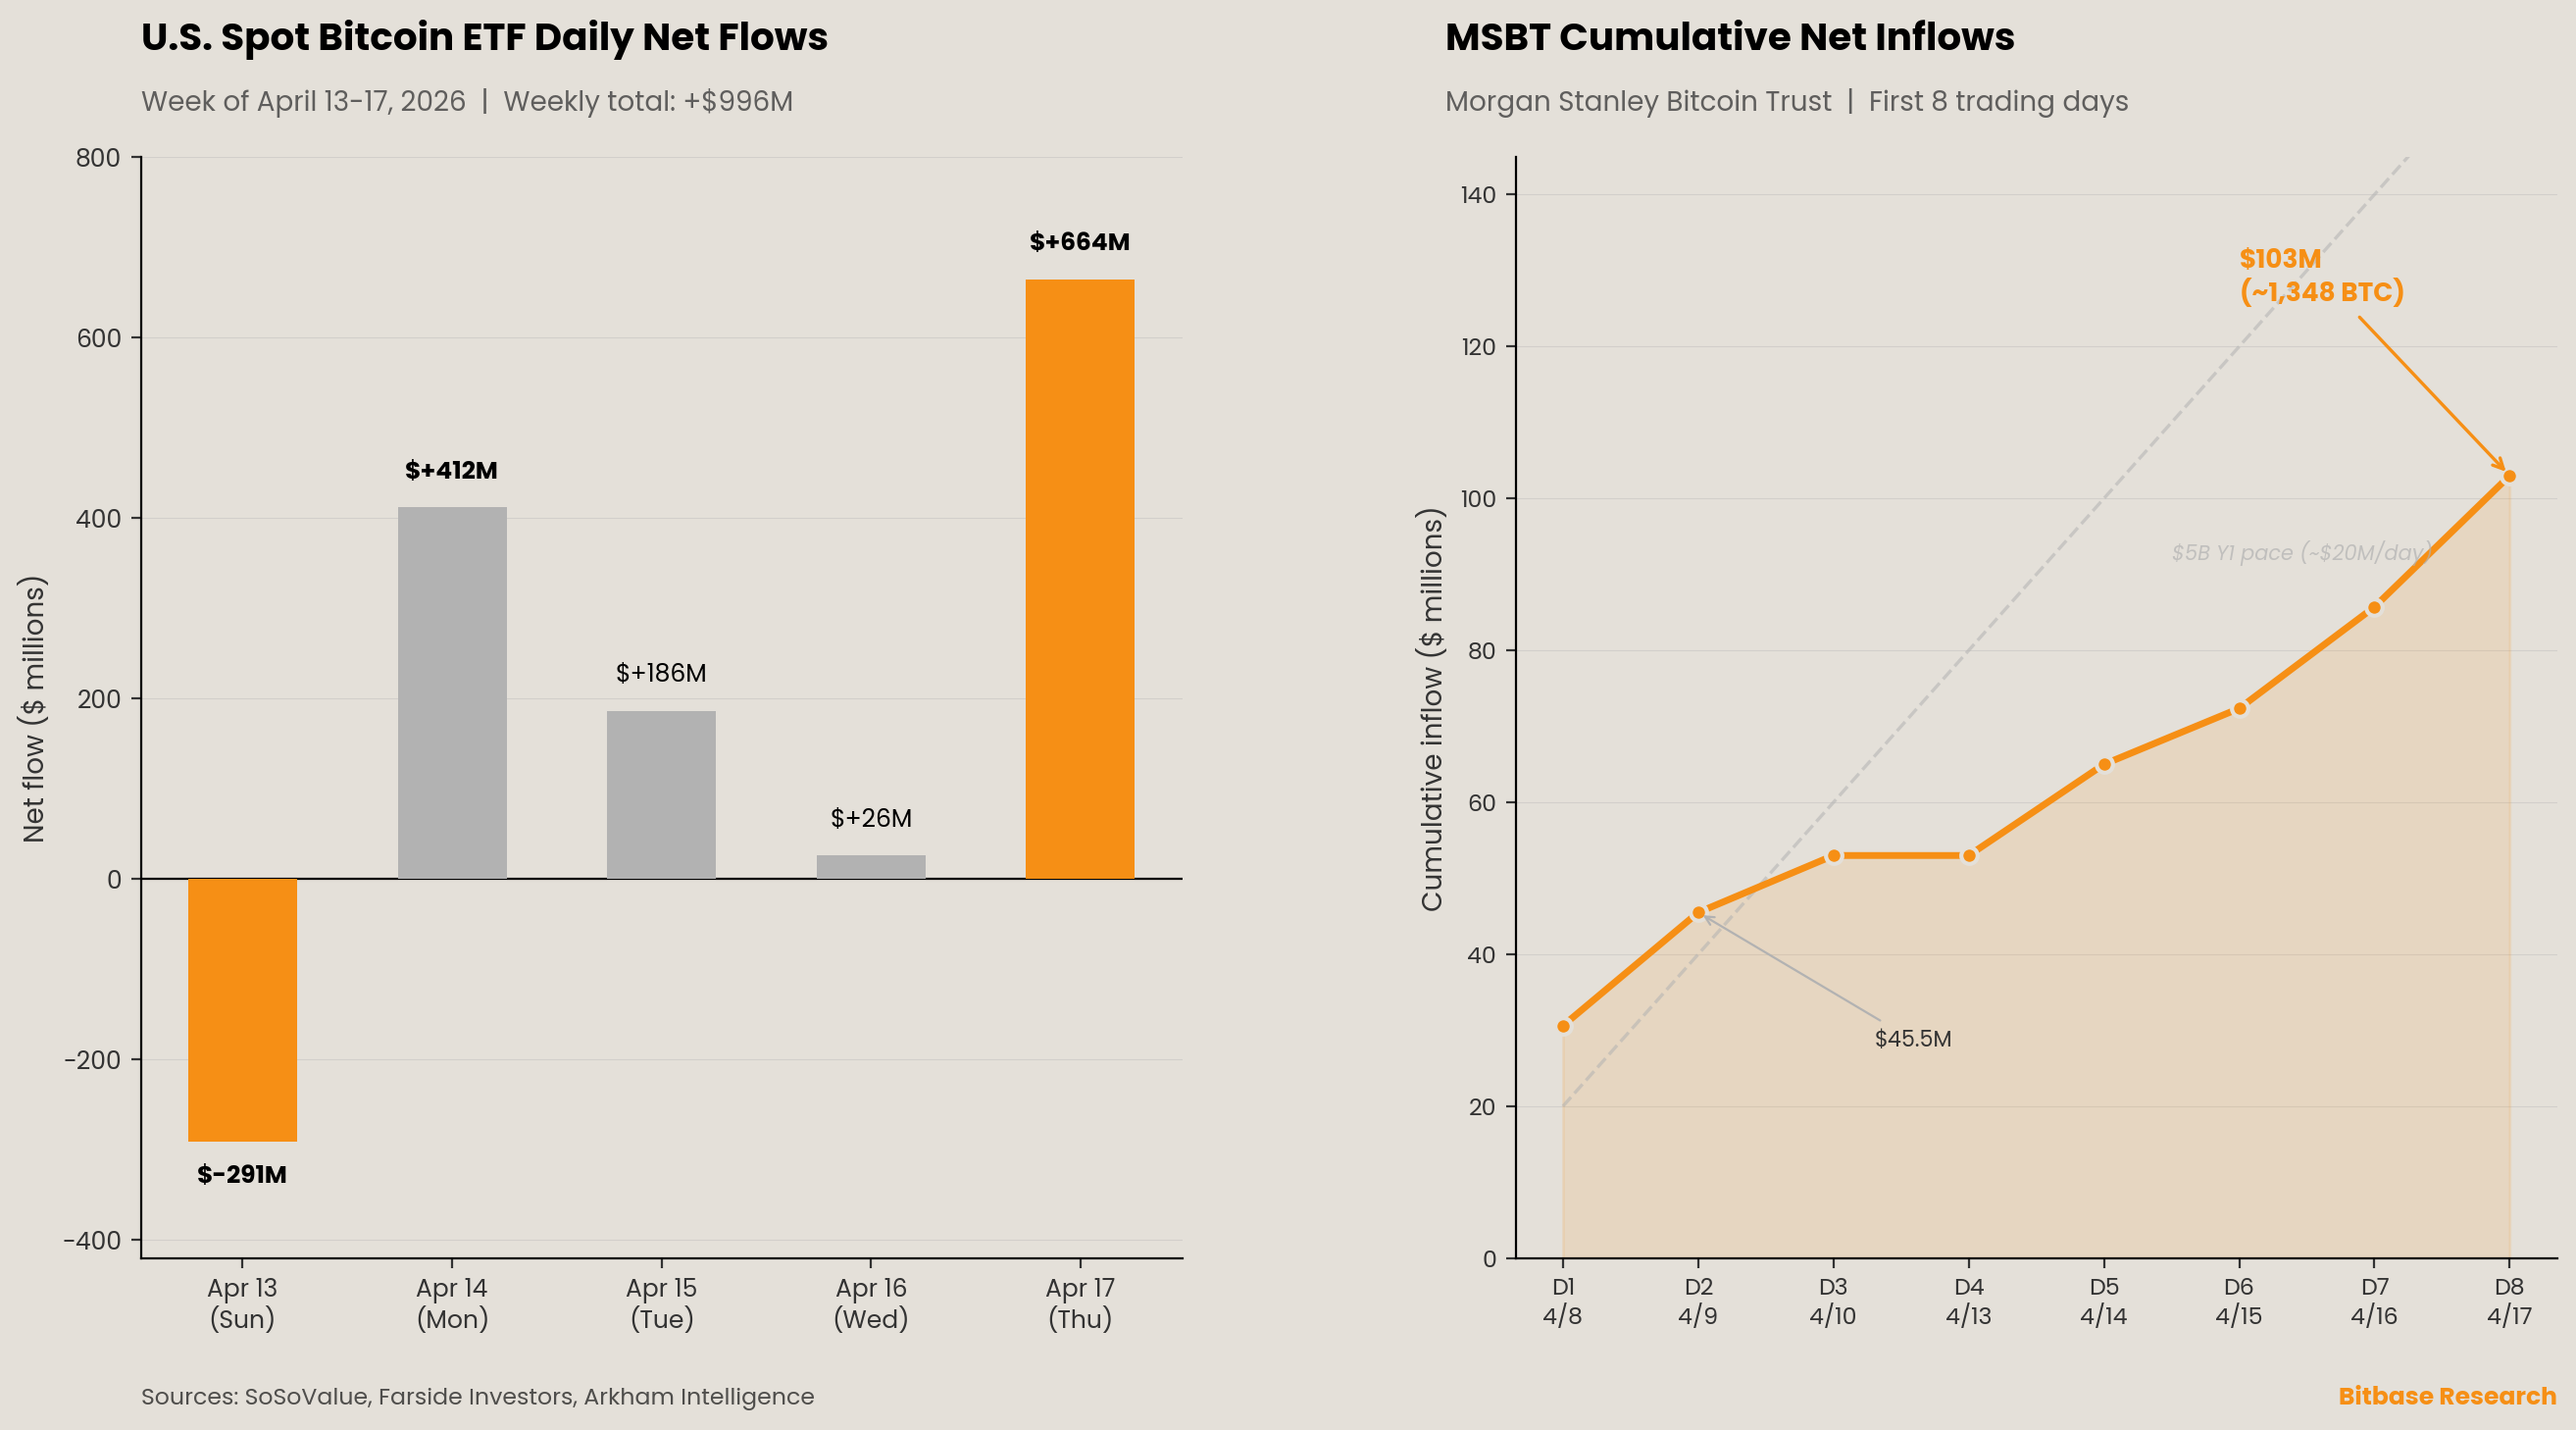
The two panels encode the week's defining tension from two angles. On the left, the daily net flow pattern tells a story of institutional execution discipline under geopolitical stress. Sunday's $291 million outflow—driven by $229 million in FBTC redemptions and $63 million in ARKB redemptions [1]—reversed sharply on Monday with $411 million in net inflows led by IBIT [2]. The week then decelerated through midweek before exploding to $664 million on Thursday, the strongest single day since late January, catalyzed by Iran's declaration that the Strait of Hormuz was fully open to commercial shipping [3][4]. The five-day total of +$996 million makes this the best weekly performance for U.S. spot Bitcoin ETFs since mid-January 2026 and the third consecutive positive week [2]. Cumulative net inflows since January 2024 reached approximately $57.1 billion as of April 17 [2].
The right panel tracks MSBT's accumulation curve through its first eight trading days. Morgan Stanley's fund crossed the $103 million cumulative inflow mark by Day 6, April 16, per Benzinga [5]. Arkham Intelligence labeled MSBT's custodial wallets on-chain and reported approximately 1,348 BTC held across three addresses as of April 18, valued at roughly $102 million [6]. The cumulative trajectory is running above the linear pace line implied by Balchunas's $5 billion Year 1 AUM projection (approximately $20 million per trading day averaged across 252 trading days [7]), though it is too early—eight trading days—to extrapolate with confidence. What is observable: MSBT has posted positive net inflows on every trading day except the category-wide outflow day of April 13, and no significant outflows have been recorded on-chain [6].
2. This week's structural signal
The structural signal of the week is not a single event but a geopolitically driven stress test of the institutional allocation channel.
On Thursday, April 17, Iran's Foreign Minister Seyed Abbas Araghchi declared the Strait of Hormuz fully open to commercial vessels under a coordinated route, linked to a 10-day ceasefire in Lebanon [3]. Bitcoin surged from the $74,600–$75,746 range toward $77,000 within hours. Crude oil dropped 11.5%, with WTI falling to approximately $84 per barrel [3]. The S&P 500 closed near a record of 7,121 [4]. Thursday's $664 million ETF inflow—led by IBIT at $283 million, FBTC at $163 million, and ARKB at $118 million [8]—was the single largest daily inflow since late January.
Less than 24 hours later, on Friday, April 18, the Iranian military reversed course and announced the Strait had "returned to its previous state," citing the United States' refusal to lift its naval blockade on Iranian ports [9]. Bitcoin pulled back to approximately $76,000 [9]. The whipsaw was complete within a single news cycle.
This 48-hour open-close sequence is instructive for the dual-track framework in three ways.
First, the ETF channel demonstrated its function as an institutional transmission mechanism for geopolitical risk repricing. The $664 million Thursday inflow was not a retail sentiment trade—IBIT, FBTC, and ARKB together accounted for $564 million, all products distributed through institutional advisory networks [8]. The speed of the flow reversal (from $26 million on Wednesday to $664 million on Thursday) reflects systematic rebalancing triggered by a macro catalyst, not gradual sentiment drift.
Second, Ethereum ETFs posted their strongest week since mid-January at +$275.8 million, with inflows on every trading day [2]. This marks a second consecutive positive week for the category, which had previously endured three straight weeks of outflows totaling roughly $308 million [1]. The ETH-to-BTC rotation signal identified in the Inaugural Edition is now bidirectional: capital is flowing into both categories simultaneously, suggesting a broadening of the institutional allocation channel rather than intra-crypto rotation.
Third, Bitcoin's price range for the week—$70,741 (Sunday low) to $77,102 (Thursday close) [10]—represents a roughly 7% weekly gain, the strongest since mid-March. Yet Bitcoin remains approximately 39% below its all-time high of $126,198 set on October 6, 2025 [10]. The institutional bid is absorbing supply at a 40% discount to the ATH while geopolitical tail risk remains elevated—an observation consistent with the Deep Dive's argument that the institutional allocation channel is widening through distribution infrastructure rather than price momentum.
3. Dual-track scoreboard
Two cells deserve extended analysis this week.
Compliant-centralized track. The weekly net flow of +$996 million into spot Bitcoin ETFs and +$276 million into spot Ethereum ETFs [2] represents the broadest cross-asset institutional inflow since the category's January 2024 launch. Total Bitcoin ETF AUM stood at approximately $97.9 billion as of April 16 [2]. MSBT's $103 million cumulative in eight trading days, while a rounding error against IBIT's $64.4 billion cumulative [8], is structurally significant because it validates the bank-issued ETP thesis: the first major U.S. commercial bank to launch a spot Bitcoin ETF under its own brand is accumulating assets at a pace consistent with advisor-network activation, not speculative front-running. The altcoin ETF pipeline is also active: XRP ETFs drew $55 million and SOL ETFs attracted $35 million for the week [2], confirming that the compliant-centralized track is expanding its asset coverage beyond BTC and ETH.
On-chain native track. The Perp DEX cooldown identified in the Inaugural Edition persists at the monthly level—March 2026 total volume of $699 billion represents a 49% decline from the October 2025 peak of $1.36 trillion [11]. DefiLlama data shows the $8.4 billion daily reading on April 4 was the lowest since July 2025 [11]. However, with Bitcoin recovering approximately 7% during the week of April 13–17 and funding rates stabilizing, the question is whether daily Perp DEX volume rebounded above $10 billion on a sustained basis. As of this edition's data cutoff, we do not yet have granular daily data for the full April 13–17 week from DefiLlama, but the directional price recovery should mechanically lift volumes. Hyperliquid's 30-day share of top-10 Perp DEX volume remains at approximately 34%, stable from the prior week [11]. We will update this datapoint with precision in Issue 3.
4. On the radar—week of April 20–26
-
Hormuz ceasefire clock. The 10-day ceasefire window is narrowing. Iran's April 18 reversal means the Strait is functionally closed again, and actual ship traffic remains over 95% below pre-conflict levels despite the brief reopening [9]. Whether the ceasefire collapses, extends, or escalates into a broader diplomatic framework will directly set the macro volatility regime for both ETF flows and on-chain activity. Any sustained reopening is risk-on; re-escalation compresses the price range and increases correlation between BTC and the Nasdaq (reported at 85% during oil spikes [4]).
-
ICI money market fund data: the $175.8 billion question. Total money market fund assets declined from $7.819 trillion (week ended April 8) to $7.64 trillion (week ended April 15)—a single-week drop of $175.8 billion [12]. This is structurally significant for the Deep Dive's MMF siphon-inflection-point hypothesis (Part 1, Section 1.4), but requires careful interpretation. The mid-April window aligns with U.S. federal tax payment deadlines, which historically produce large transient MMF outflows as taxpayers and corporations draw down cash positions. The next ICI release (covering the week ended April 22) will be the diagnostic datapoint: if MMF assets rebound above $7.75 trillion, the decline is seasonal noise; if they remain below $7.7 trillion, it represents the first sustained decline below the $7.856 trillion peak identified in our Inaugural Edition, and the siphon hypothesis gains its first empirical foothold.
-
CFTC perpetual futures framework: seven weeks overdue. Chairman Selig's March 3 statement—"perpetual futures here in the U.S. in the next month or so" [13]—has now lapsed by approximately seven weeks without a published framework. The CFTC continues to operate with only one Senate-confirmed commissioner [13]. For our Signal Tracking (see Section 5), this is the second consecutive week of silence, and we now classify it as an empirical pressure point on the Deep Dive's regulatory convergence thesis.
-
HYPE ETF pipeline accelerating. Bitwise filed an updated S-1 on April 11 for a spot HYPE ETF under the ticker BHYP, with a 0.67% fee and Anchorage Digital as custodian [14]. Bloomberg's Balchunas noted that adding a ticker and fee structure to a filing typically signals an imminent launch [14]. Grayscale's GHYP and filings from 21Shares and VanEck remain in the SEC review queue [15]. Any SEC action on these filings is a cross-track interoperability signal per Part 6, Section 6.4 of our Deep Dive—the first time a purely on-chain native perpetual DEX governance token would enter the compliant ETF channel.
-
Ethereum on-chain activity surge. Daily Ethereum transactions jumped 41% week-over-week to approximately 3.6 million as of April 14 [1]. This coincides with the ETH ETF inflow reversal. Whether this on-chain activity translates into sustained economic value—rather than empty transaction count inflation—will be measured by gas fee trends and stablecoin transfer volume, both of which were reported as declining despite the activity spike [1].
5. Signal tracking update
This section functions as a running audit of the forward-looking hypotheses in our Deep Dive's "Signals We Are Monitoring" lists, updated with each edition. A consolidated Signal Tracking report will follow in Q4 2026.
SIGNAL — Deep Dive Part 1: "MMF asset scale inflection point."
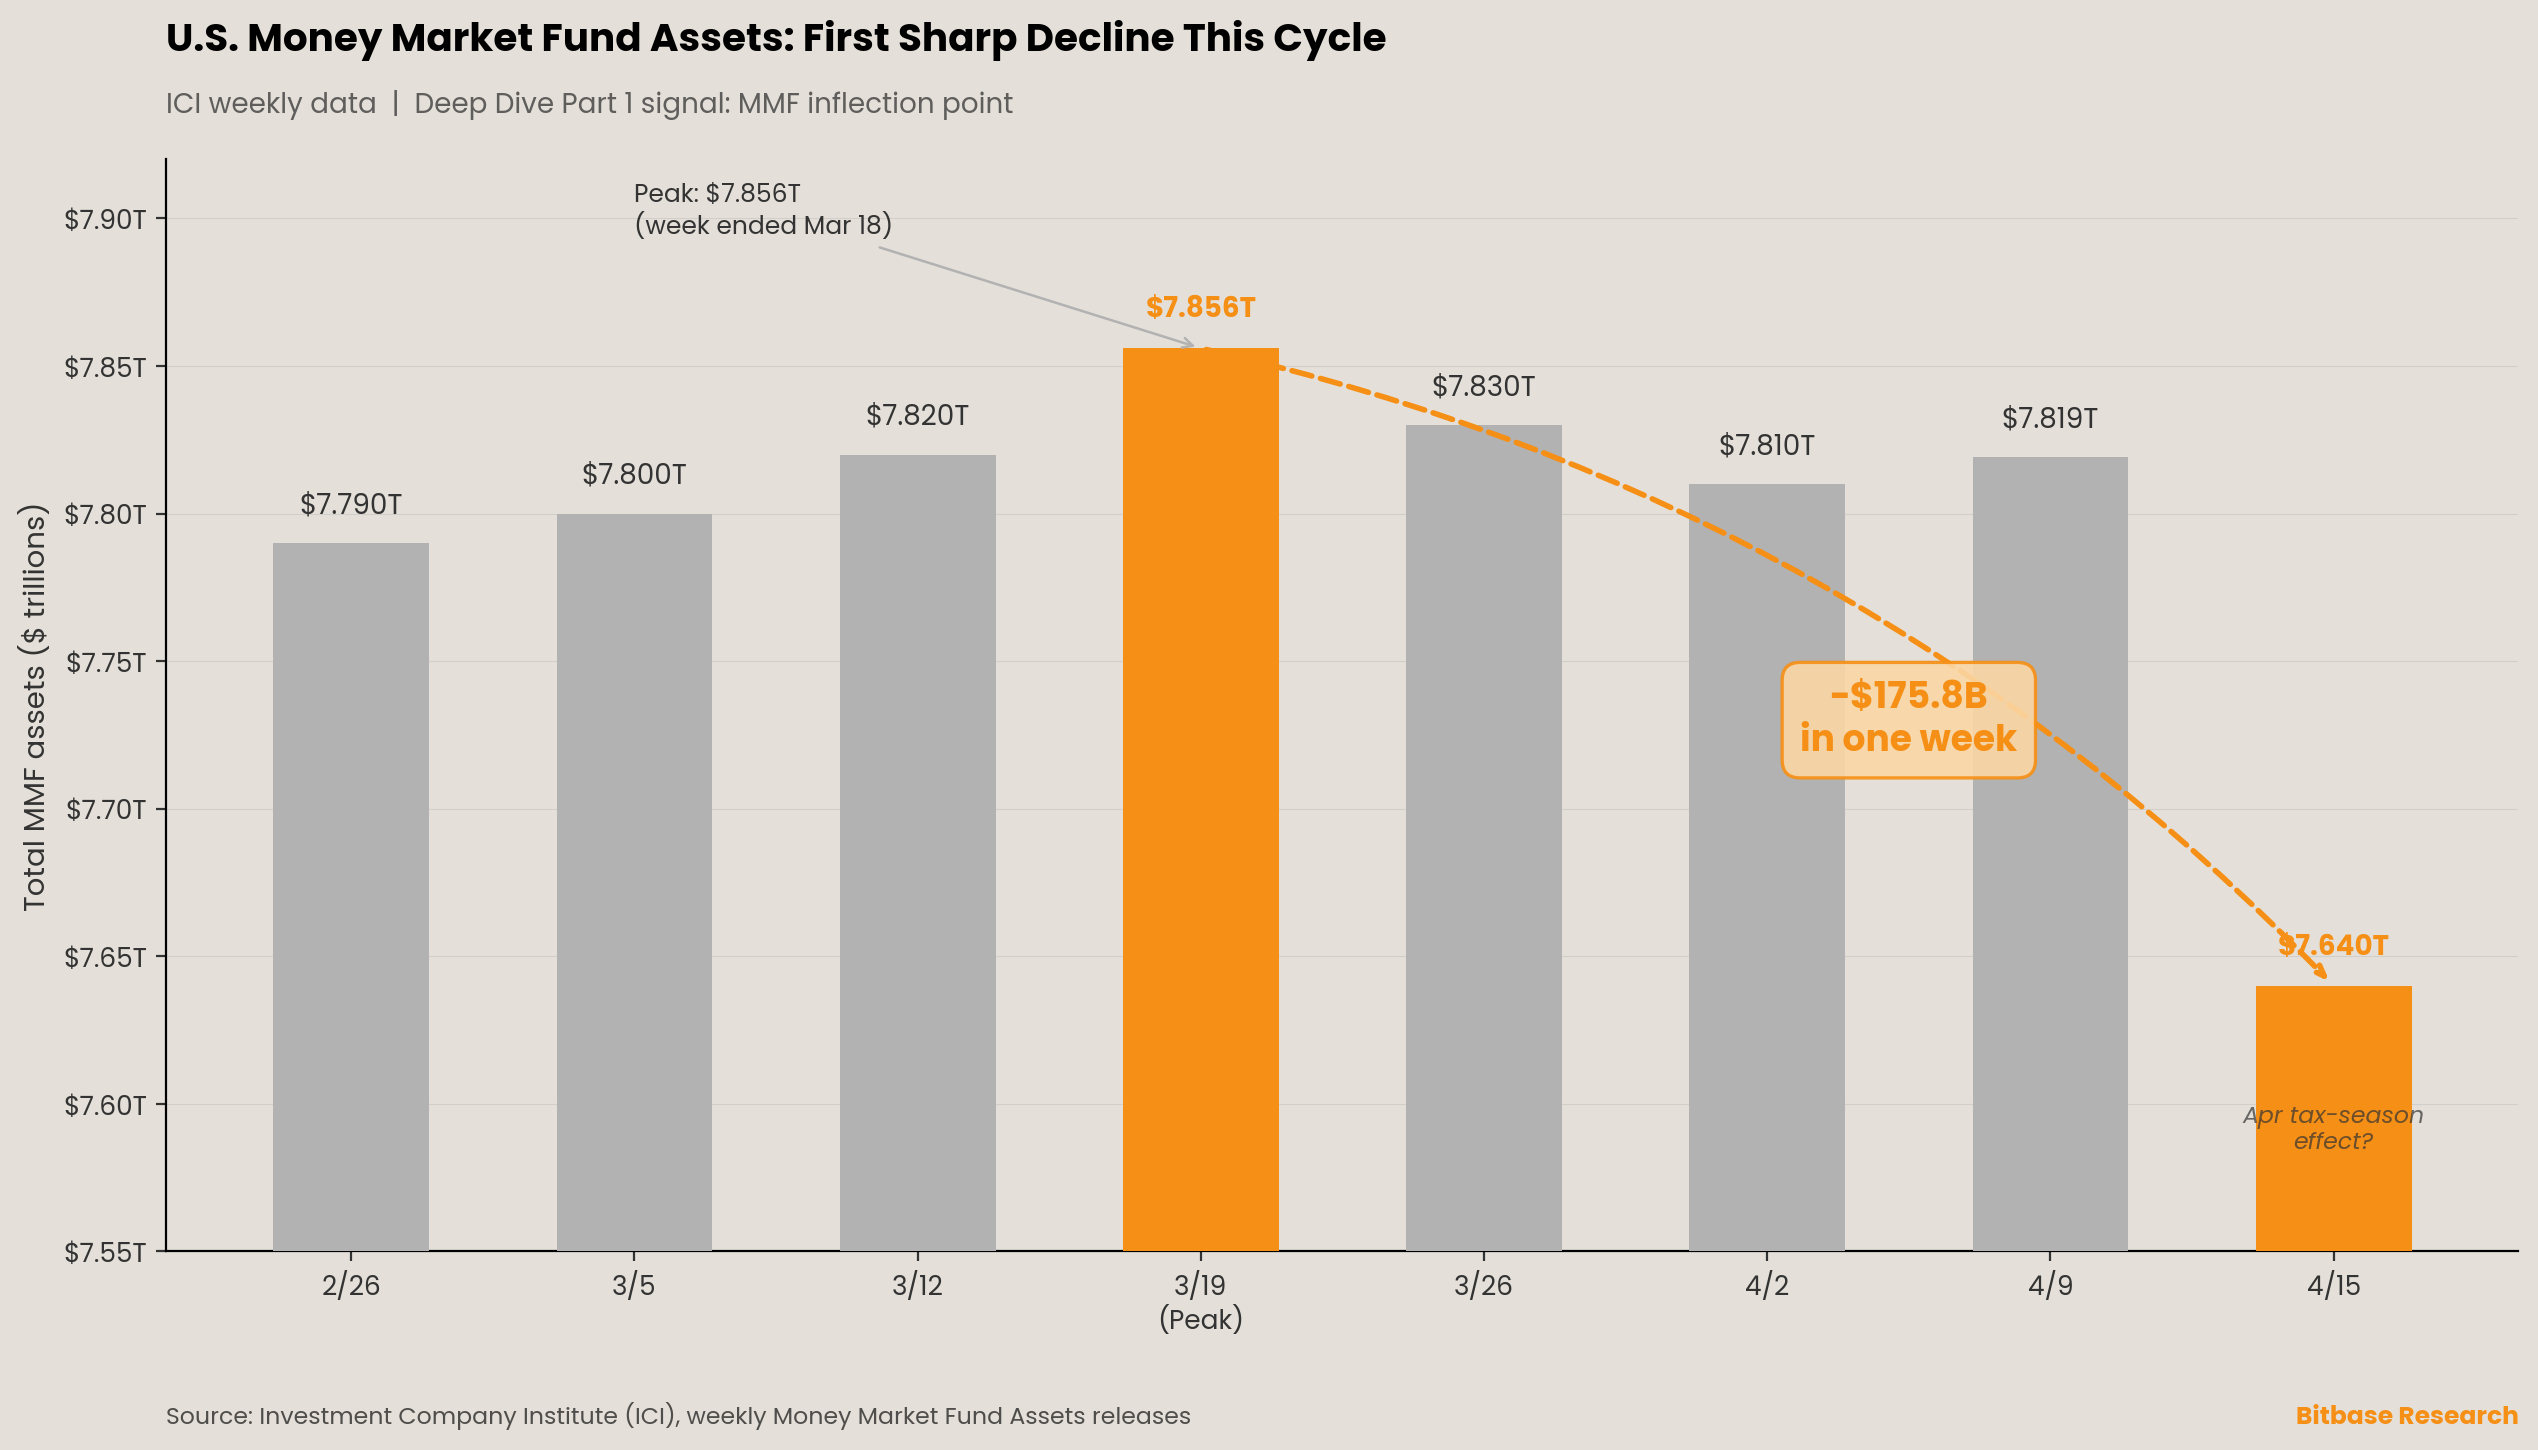
STATUS: First potential confirmation event. ICI data shows total money market fund assets declined sharply from $7.819 trillion (week ended April 8) to $7.64 trillion (week ended April 15), a single-week decrease of $175.8 billion [12]. This is the first reading meaningfully below the $7.856 trillion peak identified in our Inaugural Edition (week ended March 18). However, mid-April MMF outflows have a well-documented seasonal component (U.S. federal tax payments), and the decline's structural significance cannot be assessed until the April 22 ICI release confirms whether the drawdown persists or reverses. If the rolling four-week average falls below $7.75 trillion by end-April, it would constitute the first sustained decline consistent with the Deep Dive's hypothesis that the MMF peak may mark the onset of gradual rotation toward risk-asset allocation. If assets rebound above $7.8 trillion, the signal reverts to "holds, not yet confirmed."
SIGNAL — Deep Dive Part 6: "Whether CME crypto derivatives OI persistently holds above $30B by 2027." STATUS: On track. No updated quarterly CME data is available since the Q3 2025 average of $31.3 billion cited in the Inaugural Edition. MSBT's launch and the broadening of the ETF complex (XRP, SOL, ETH products all posting positive weeks) add institutional distribution nodes that did not exist at the Deep Dive's data cutoff. The signal remains on track for assessment through 2027.
SIGNAL — Deep Dive Part 3 and Part 6: "Tokenized RWA as common collateral infrastructure." STATUS: On track. Total stablecoin market capitalization surpassed $320 billion on April 16, with USDT at approximately $185.5 billion and USDC at approximately $78.6 billion [16]. The tokenized U.S. Treasury market stood at approximately $13.5 billion as of April 13 per rwa.xyz, growing to an estimated $14 billion by mid-April based on the Q1 trajectory reported in multiple sources [17]. Both figures continue to track the Deep Dive's argument that the on-chain settlement base is expanding as shared infrastructure beneath both tracks.
SIGNAL — Deep Dive Part 6: "Whether the U.S. CFTC approves more licensed entities to offer perpetual-contract-style products by 2027." STATUS: New signal activation. Chairman Selig's March 3 commitment to a perpetual futures framework has lapsed by seven weeks without action [13]. The CFTC operates with a single commissioner, and no timeline update has been issued. While Coinbase Derivatives listed BTC and ETH perpetual futures via self-certification in July 2025 (with no CFTC objection [18]), no broader framework enabling additional licensed entities has materialized. This remains an open item; continued silence through Q2 2026 would represent a meaningful delay relative to stated regulatory intent.
SIGNAL — Deep Dive Part 6: "Whether perpetual DEX annual trading volume holds above $5 trillion in 2026." STATUS: New signal activation; under pressure. March 2026 volume of $699 billion annualizes to approximately $8.4 trillion, comfortably above the $5 trillion threshold [11]. However, the monthly trajectory has been declining for five consecutive months from the October 2025 peak of $1.36 trillion [11]. If the decline continues at the current rate, the $5 trillion annual threshold comes under threat by Q3 2026. The April data—not yet fully available—will be a critical check. We will report the April monthly total in Issue 3 or Issue 4.
We will continue tracking additional signals against each weekly data arrival and publish the first consolidated Signal Tracking report in Q4 2026.
References
[1] CoinDesk, "Ether outpaces bitcoin as ETF flows split and Ethereum activity jumps 41% on-week," April 14, 2026. SoSoValue data cited for April 13 flows: $325.8 million in net outflows from spot Bitcoin ETFs. https://www.coindesk.com/markets/2026/04/14/ether-outpaces-bitcoin-as-etf-flows-split-and-ethereum-activity-jumps-41-on-week
[2] Incrypted, "Spot Bitcoin and Ethereum ETFs in the U.S. Attracted Nearly $1.3 Billion in a Week," April 19, 2026. SoSoValue data for April 13–17 weekly flows. https://incrypted.com/en/spot-bitcoin-and-ethereum-etfs-us-attracted-nearly-13-billion-week/
[3] CryptoBriefing, "Iran declares Strait of Hormuz fully open, Bitcoin flirts with $77K," April 17, 2026. https://cryptobriefing.com/strait-reopening-impact-bitcoin-rises/
[4] FinanceMagnates, "Why Bitcoin Is Surging Today? BTC Tops $72,000 After Strait of Hormuz Shock," April 13, 2026. Contains weekly ETF flow context and BTC-Nasdaq correlation data. https://www.financemagnates.com/trending/why-bitcoin-is-surging-today-btc-tops-72000-after-strait-of-hormuz-shock-as-bitcoin-price-prediction-2026-target-80k-resistance/
[5] CoinPaprika, "Morgan Stanley Bitcoin holdings exceed $100M in April," April 19, 2026. Benzinga data cited for MSBT cumulative inflows of $103 million in six trading days. https://coinpaprika.com/news/morgan-stanley-bitcoin-holdings-100m/
[6] Bitcoin.com News, "Morgan Stanley's MSBT Bitcoin ETF Wallets Now Publicly Trackable via Arkham," April 19, 2026. Arkham data as of approximately April 18: 1,348 BTC across three custodial wallet addresses. https://news.bitcoin.com/morgan-stanleys-msbt-bitcoin-etf-wallets-now-publicly-trackable-via-arkham/
[7] Bloomberg Intelligence, Eric Balchunas (Senior ETF Analyst), MSBT Year 1 AUM projection of $5 billion, public commentary on X, April 8–9, 2026.
[8] Bitcoinist, "US-Based Bitcoin ETFs Post Roughly $1B Inflows In Past Week," April 20, 2026. SoSoValue data for April 17: $663.9 million total net inflow; IBIT $283 million, FBTC $163.42 million, ARKB $117.9 million. https://bitcoinist.com/us-based-bitcoin-etfs-post-roughly-1b-inflows/
[9] CryptoTicker, "Iran Closes Strait of Hormuz Again: Oil Rises as Crypto Crash," April 18, 2026. Reports Iranian military announcement reversing the reopening, BTC correction to $76,000. https://cryptoticker.io/en/iran-closes-strait-of-hormuz-oil-crypto-news-impact/
[10] Stonksmaster, Bitcoin Market Analysis, April 18, 2026. April 17 OHLC: Open $75,166.87, High $78,372.28, Low $74,562.88, Close $77,102.12. https://www.stonksmaster.com/2026/04/bitcoin-market-analysis-for-2026-04-18.html; Fortune, current price of Bitcoin for April 17, 2026: $75,746.90 at 8:45 AM ET; ATH $126,198.07 on October 6, 2025. https://fortune.com/article/price-of-bitcoin-04-17-2026/
[11] CryptoBreaking, "On-Chain Perp DEX Volumes Dip for Fifth Straight Month After Oct Peak," April 7, 2026. DefiLlama data: April 4 daily volume $8.4 billion; March monthly total $699 billion vs. October 2025 peak $1.36 trillion; Hyperliquid 30-day share approximately 34%. https://www.cryptobreaking.com/on-chain-perp-dex-volumes/
[12] ICI, "Money Market Fund Assets," release dated April 16, 2026 (data for week ended April 15). Total assets $7.64 trillion, down $175.81 billion from prior week. https://www.ici.org/research/stats/mmf
[13] CoinDesk, "CFTC Chief Selig to Clear Path for U.S. Perpetual Futures in Coming Weeks," March 3, 2026. https://www.coindesk.com/policy/2026/03/03/cftc-chief-selig-to-clear-path-for-u-s-perpetual-futures-in-coming-weeks
[14] SpazioCrypto, "Bitwise Files HYPE ETF BHYP: Hyperliquid to Wall St," April 11, 2026. Bitwise updated S-1 with ticker BHYP, 0.67% fee, Anchorage Digital custody. https://en.spaziocrypto.com/defi/bitwise-hype-etf-bhyp-hyperliquid-wall-street-sec/
[15] SEC EDGAR, Grayscale HYPE ETF (GHYP), Form S-1, filed March 20, 2026, Filing No. 333–294493. https://www.sec.gov/Archives/edgar/data/0002107730/000119312526117603/ck0002107730-20260320.htm
[16] Bitcoin.com News, "Stablecoin Market Crosses $320B as Tether USDT Dominance Falls 2.5% in 2026," April 16, 2026. DefiLlama data: total $320.007 billion; USDT $185.463 billion (57.96%); USDC $78.621 billion. https://news.bitcoin.com/stablecoin-market-crosses-320b-as-tether-usdt-dominance-falls-2-5-in-2026/
[17] CoinSpectator, "Tokenized US Treasuries Near $14B as Circle, Blackrock Lead RWA Market Growth," April 13, 2026. rwa.xyz data: tokenized U.S. Treasuries at $13.53 billion. https://coinspectator.com/bitcoin-com/2026/04/13/tokenized-us-treasuries-near-14b-as-circle-blackrock-lead-rwa-market-growth/; InvesTax, Q1 2026 Real World Asset Tokenization Market Report: tokenized Treasuries reached $13.4 billion by early April. https://investax.io/blog/q1-2026-real-world-asset-tokenization-market-report
[18] Pillsbury Law, "CFTC Permits Listing of Perpetual Futures on BTC and ETH," July 22, 2025. Coinbase Derivatives self-certified BTC-PERP and ETH-PERP; no CFTC objection raised. https://www.pillsburylaw.com/en/news-and-insights/cftc-perpetual-futures-btc-eth-crypto-derivatives.html
The next Market Insights issue covers the week of April 20–26, 2026. Market Insights is published by Bitbase Research alongside our Deep Dive flagship series.