The forward item that dominated Issue 14 arrived on schedule, and it landed soft. June CPI printed at 3.5% year over year on Tuesday, July 14—well under the 3.8% consensus and a full 0.7 percentage points below May's 4.2% [1][2]. On the month, prices fell 0.4%, the biggest monthly decline in more than six years, while core inflation was flat on the month and eased to 2.6% year over year [1]. The front end repriced immediately: odds of a July hike collapsed from roughly 42% on Monday to the teens-to-20% range within hours [3][4]. Risk assets took the invitation. Bitcoin cleared $64,000 on the print and reached a three-week high above $65,000 by Wednesday, ether traded back over $1,900, and the spot-Bitcoin-ETF bid extended to a fourth consecutive inflow day [5][6][7].
Then the reason the number was soft turned around. June's improvement was, by the BLS's own composition, an energy story—prices swooned as Middle East tension briefly eased [1][2]. By Friday, a sixth day of US airstrikes on Iran had the Strait of Hormuz effectively closed and oil back up, and both bitcoin and ether gave back the week's best levels [8]. The market spent the week celebrating a datapoint whose own cause had already reversed underneath it.
Two things make this issue different from the four before it. The first is that a signal this series has tracked since Issue 10 finally moved: the money-fund record broke, in a risk-on week, which is the exact coincidence the inflection test was written to require. The second is that the week's headline number and the week's mechanism point in opposite directions—the CPI print was the best in six years, and the reason it was that good had already reversed by Friday. An issue that reports only the print would be reporting the smaller half.
Week of July 13 to July 19, 2026
Bitbase Research · July 20, 2026
The one chart that matters
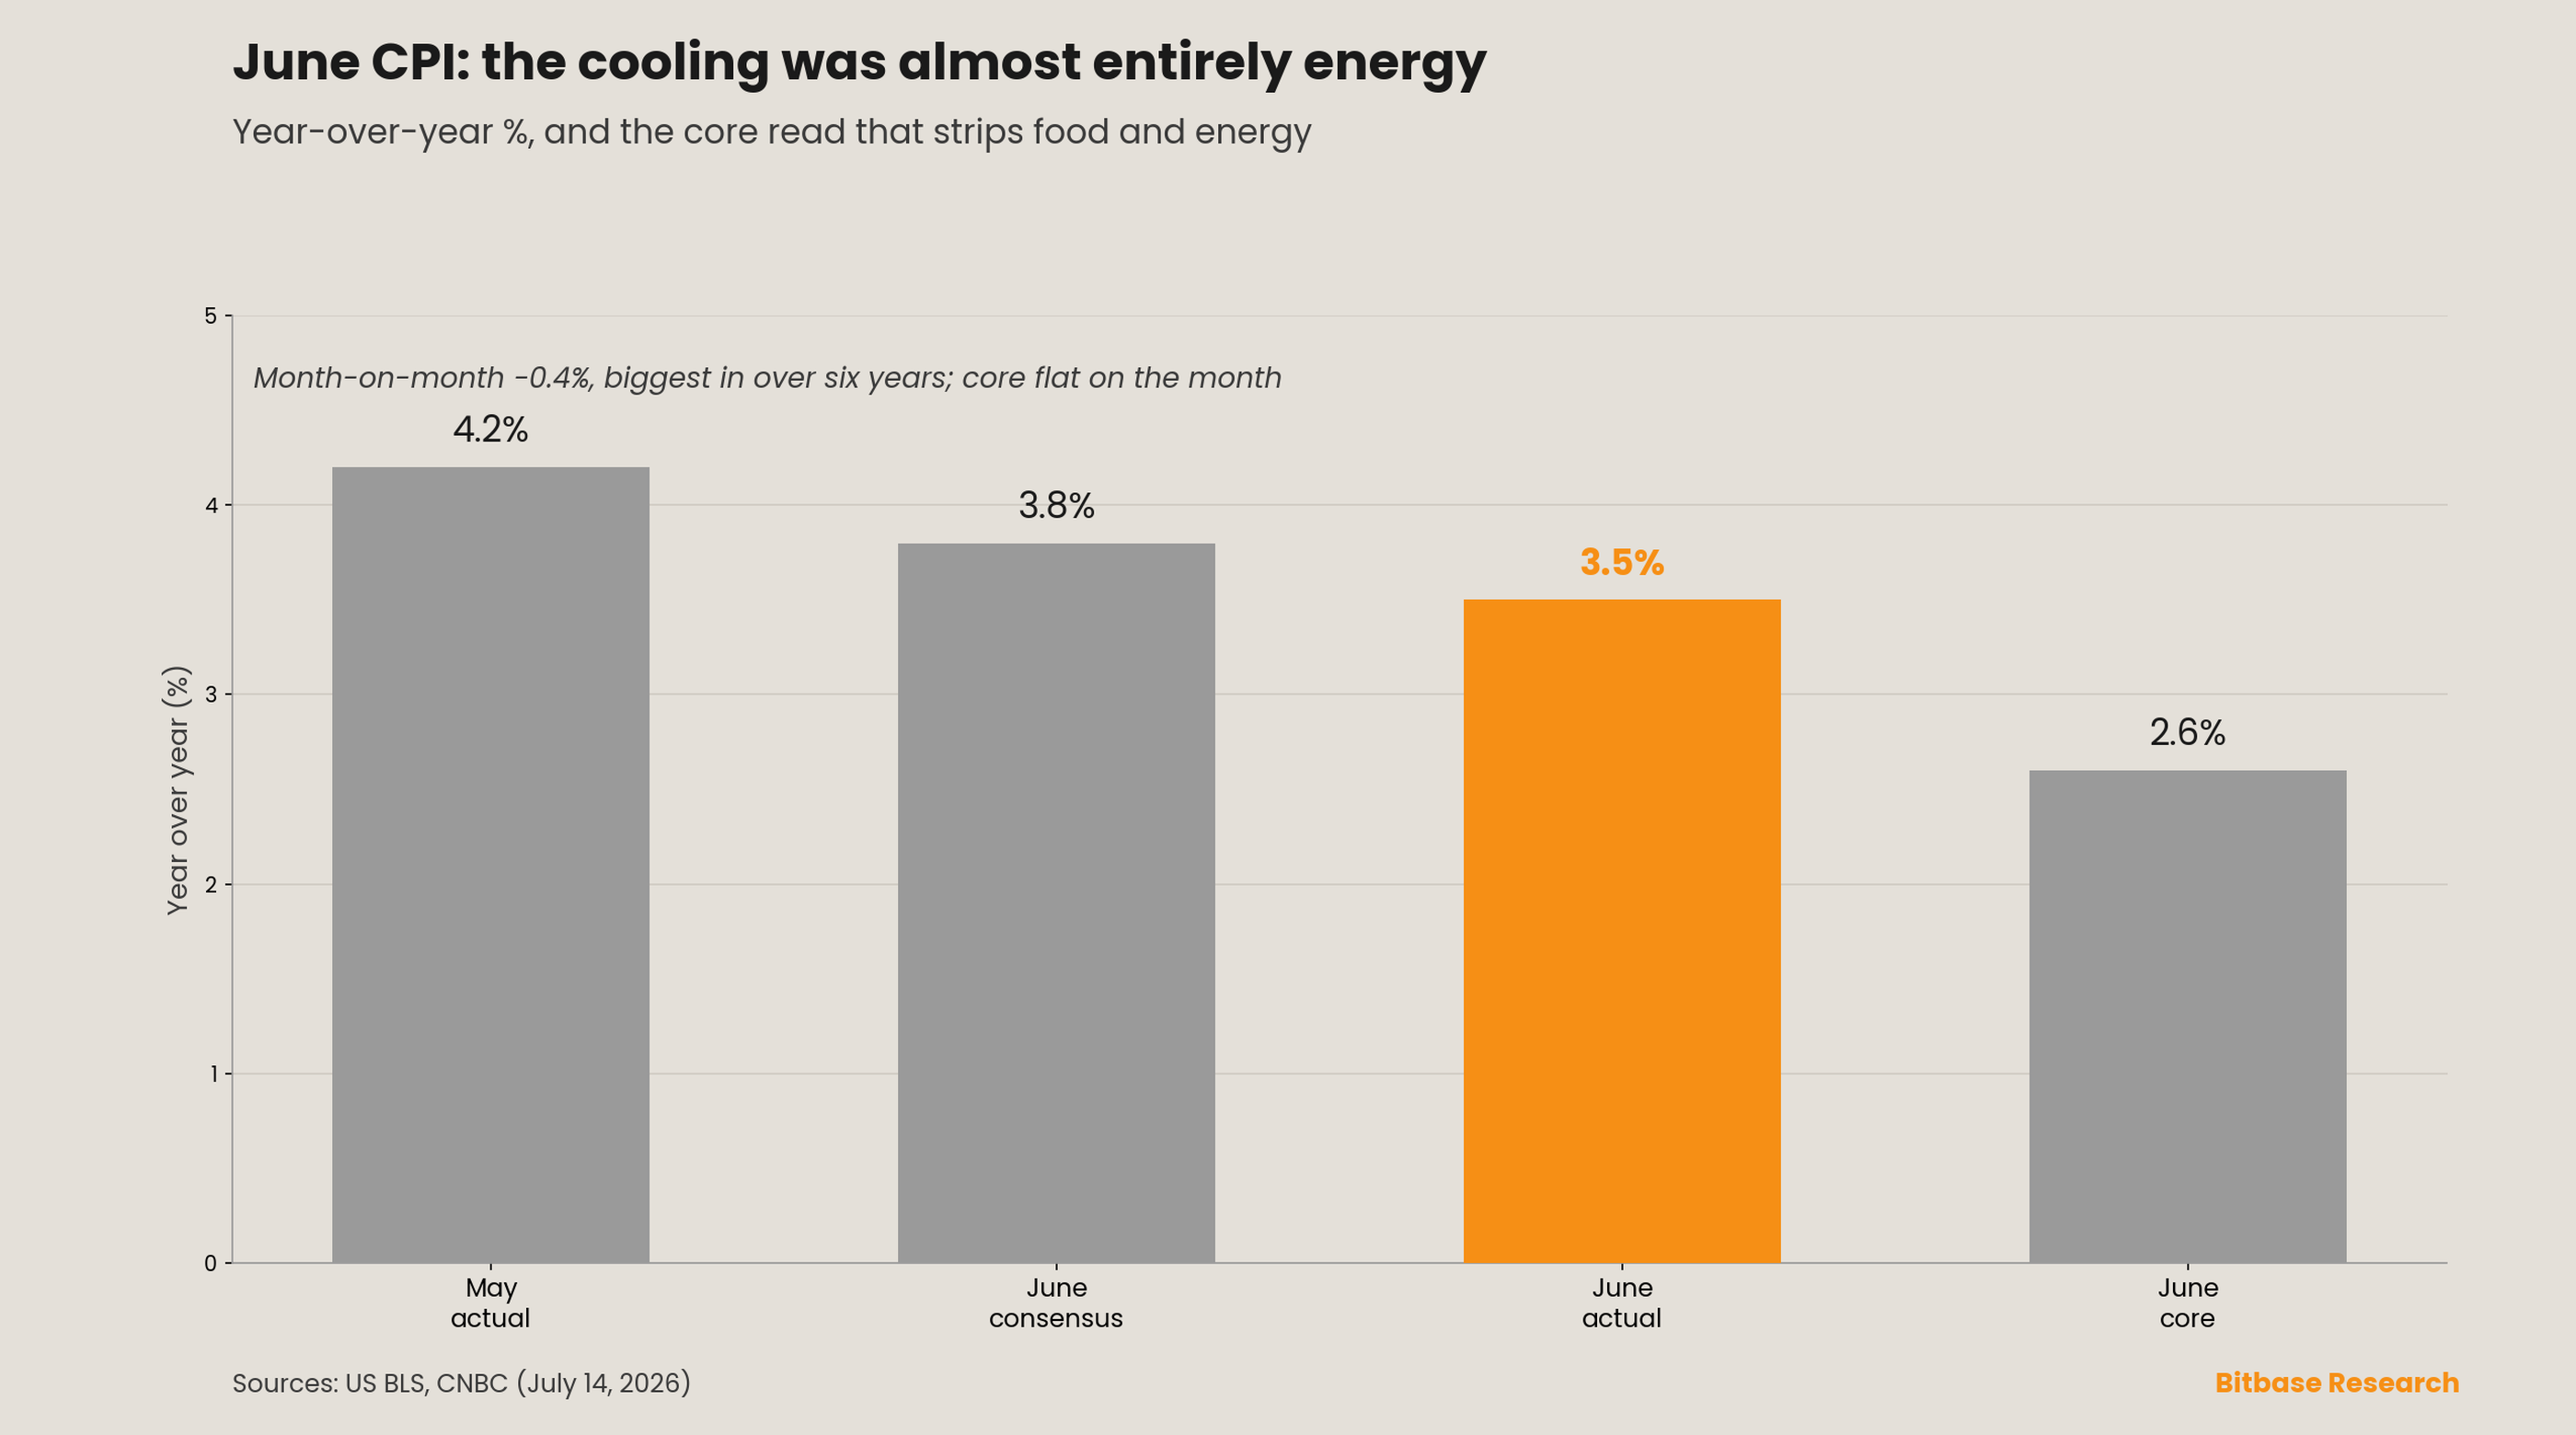
The week's decisive number was not merely cool; it was cool in a specific and fragile way. Headline CPI came in at 3.5% year over year against a 3.8% consensus, down from 4.2% in May, with the monthly change at −0.4%—the largest one-month decline in over six years [1][2]. Core, which strips out food and energy, told a much quieter story: flat on the month, 2.6% year over year, down from 2.9% [1].
That gap between headline and core is the entire issue. A −0.4% headline alongside a flat core means essentially all of the improvement came from the volatile components, and energy did the work. The disinflation was real in the data and thin in its foundation: it depended on a Middle East calm that was already ending as the number was being published.
Energy-led disinflation has a short half-life, and that is not a forecast but an accounting identity. Headline CPI is a weighted basket; when one volatile component does nearly all the work, the improvement lasts exactly as long as that component's level does—not its direction. A one-month −0.4% driven by energy does not compound into a trend unless energy keeps falling, and by Friday it was not falling. Core is the part that carries memory: services and shelter reprice slowly, in contracts and leases, which is why a flat core month is genuinely encouraging and why a 2.6% core year-over-year is the number the Fed's staff will still be looking at in September. The market repriced the front end on the component with no memory.
For the front end, the print was enough. July hike odds fell from about 42% at Monday's open to roughly 17% after the release, with one read as low as 13% and Bloomberg marking 20% [3][4]. The September meeting, however, stayed live—markets still assigned close to a 60% chance that the target rate sits a quarter or half point higher after September [3]. The market did not price an all-clear. It priced a delay.
This week's structural signal
The rally was built on a number whose driver reversed inside the same trading week.
This is the structural point of Issue 15, and it is unusually clean. The causal chain ran: Middle East tension eased → energy prices fell → June CPI undershot → hike odds collapsed → risk assets rallied. Every link held. Then the first link broke. By Friday, July 17, US airstrikes on Iran were in a sixth day, the Strait of Hormuz remained effectively closed, and oil prices were rising again [8].
The market's response was immediate and partial. Bitcoin, which had been above $65,000 midweek, opened Friday at $63,788.52, down 1.4% from Thursday's open, and slipped to $63,130.40 by mid-morning [8]. Ether opened at $1,863.16, down 2.8%, and eased to $1,832.29 [8]. Both remained higher than a week earlier—bitcoin +0.9%, ether +6.8% on that basis—so the week was still a gain [8]. But the highs did not hold, and the reason they did not hold is the same reason the CPI was soft in the first place.
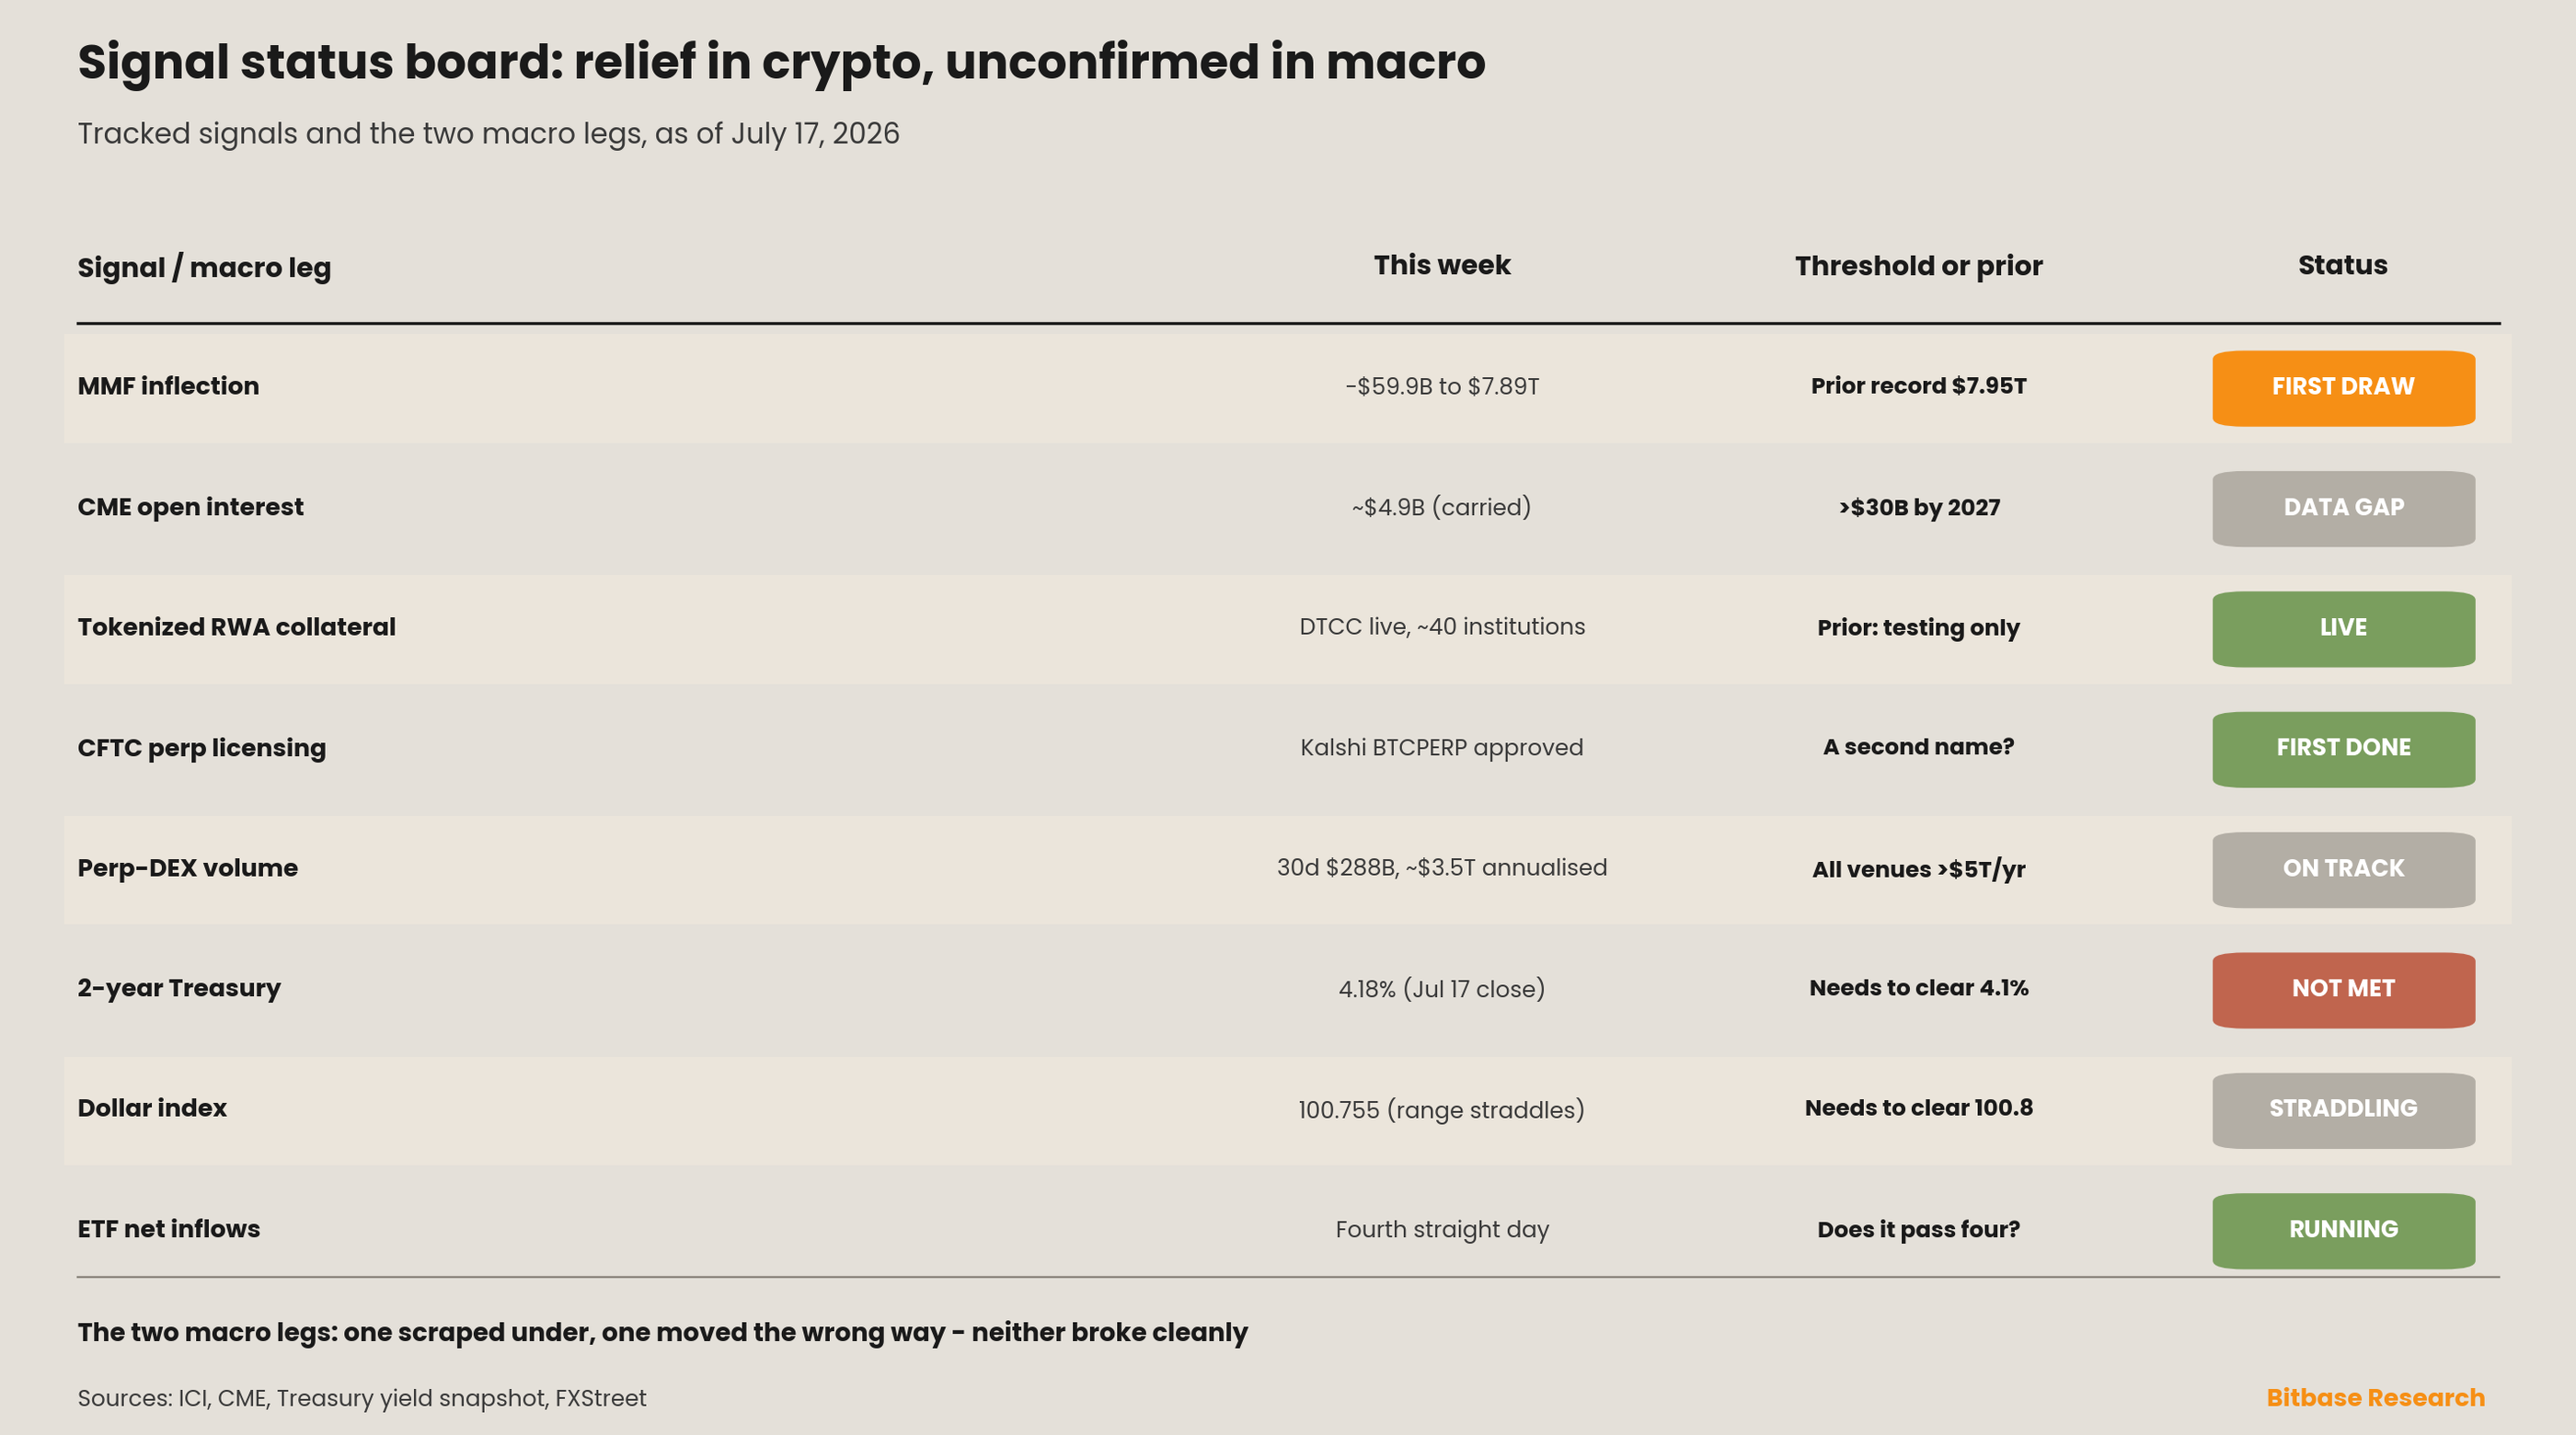
The two macro legs this series watches for a genuine all-clear did not deliver one. Issue 14 set the thresholds: the 2-year Treasury yield near 4.1% and the dollar index near 100.8. This week the 2-year closed July 17 at 4.18%, up 0.03 percentage points on the session and further above its threshold, not below [9]. The dollar index closed at 100.755, marginally under its mark but with the day's range straddling it (100.647–100.867) and upside capped only by mixed US data—housing starts and consumer sentiment beat, building permits and industrial production missed [10]. One leg scraped under; the other moved the wrong way. Neither broke cleanly. The relief was visible in crypto and unconfirmed in macro.
Dual-track scoreboard
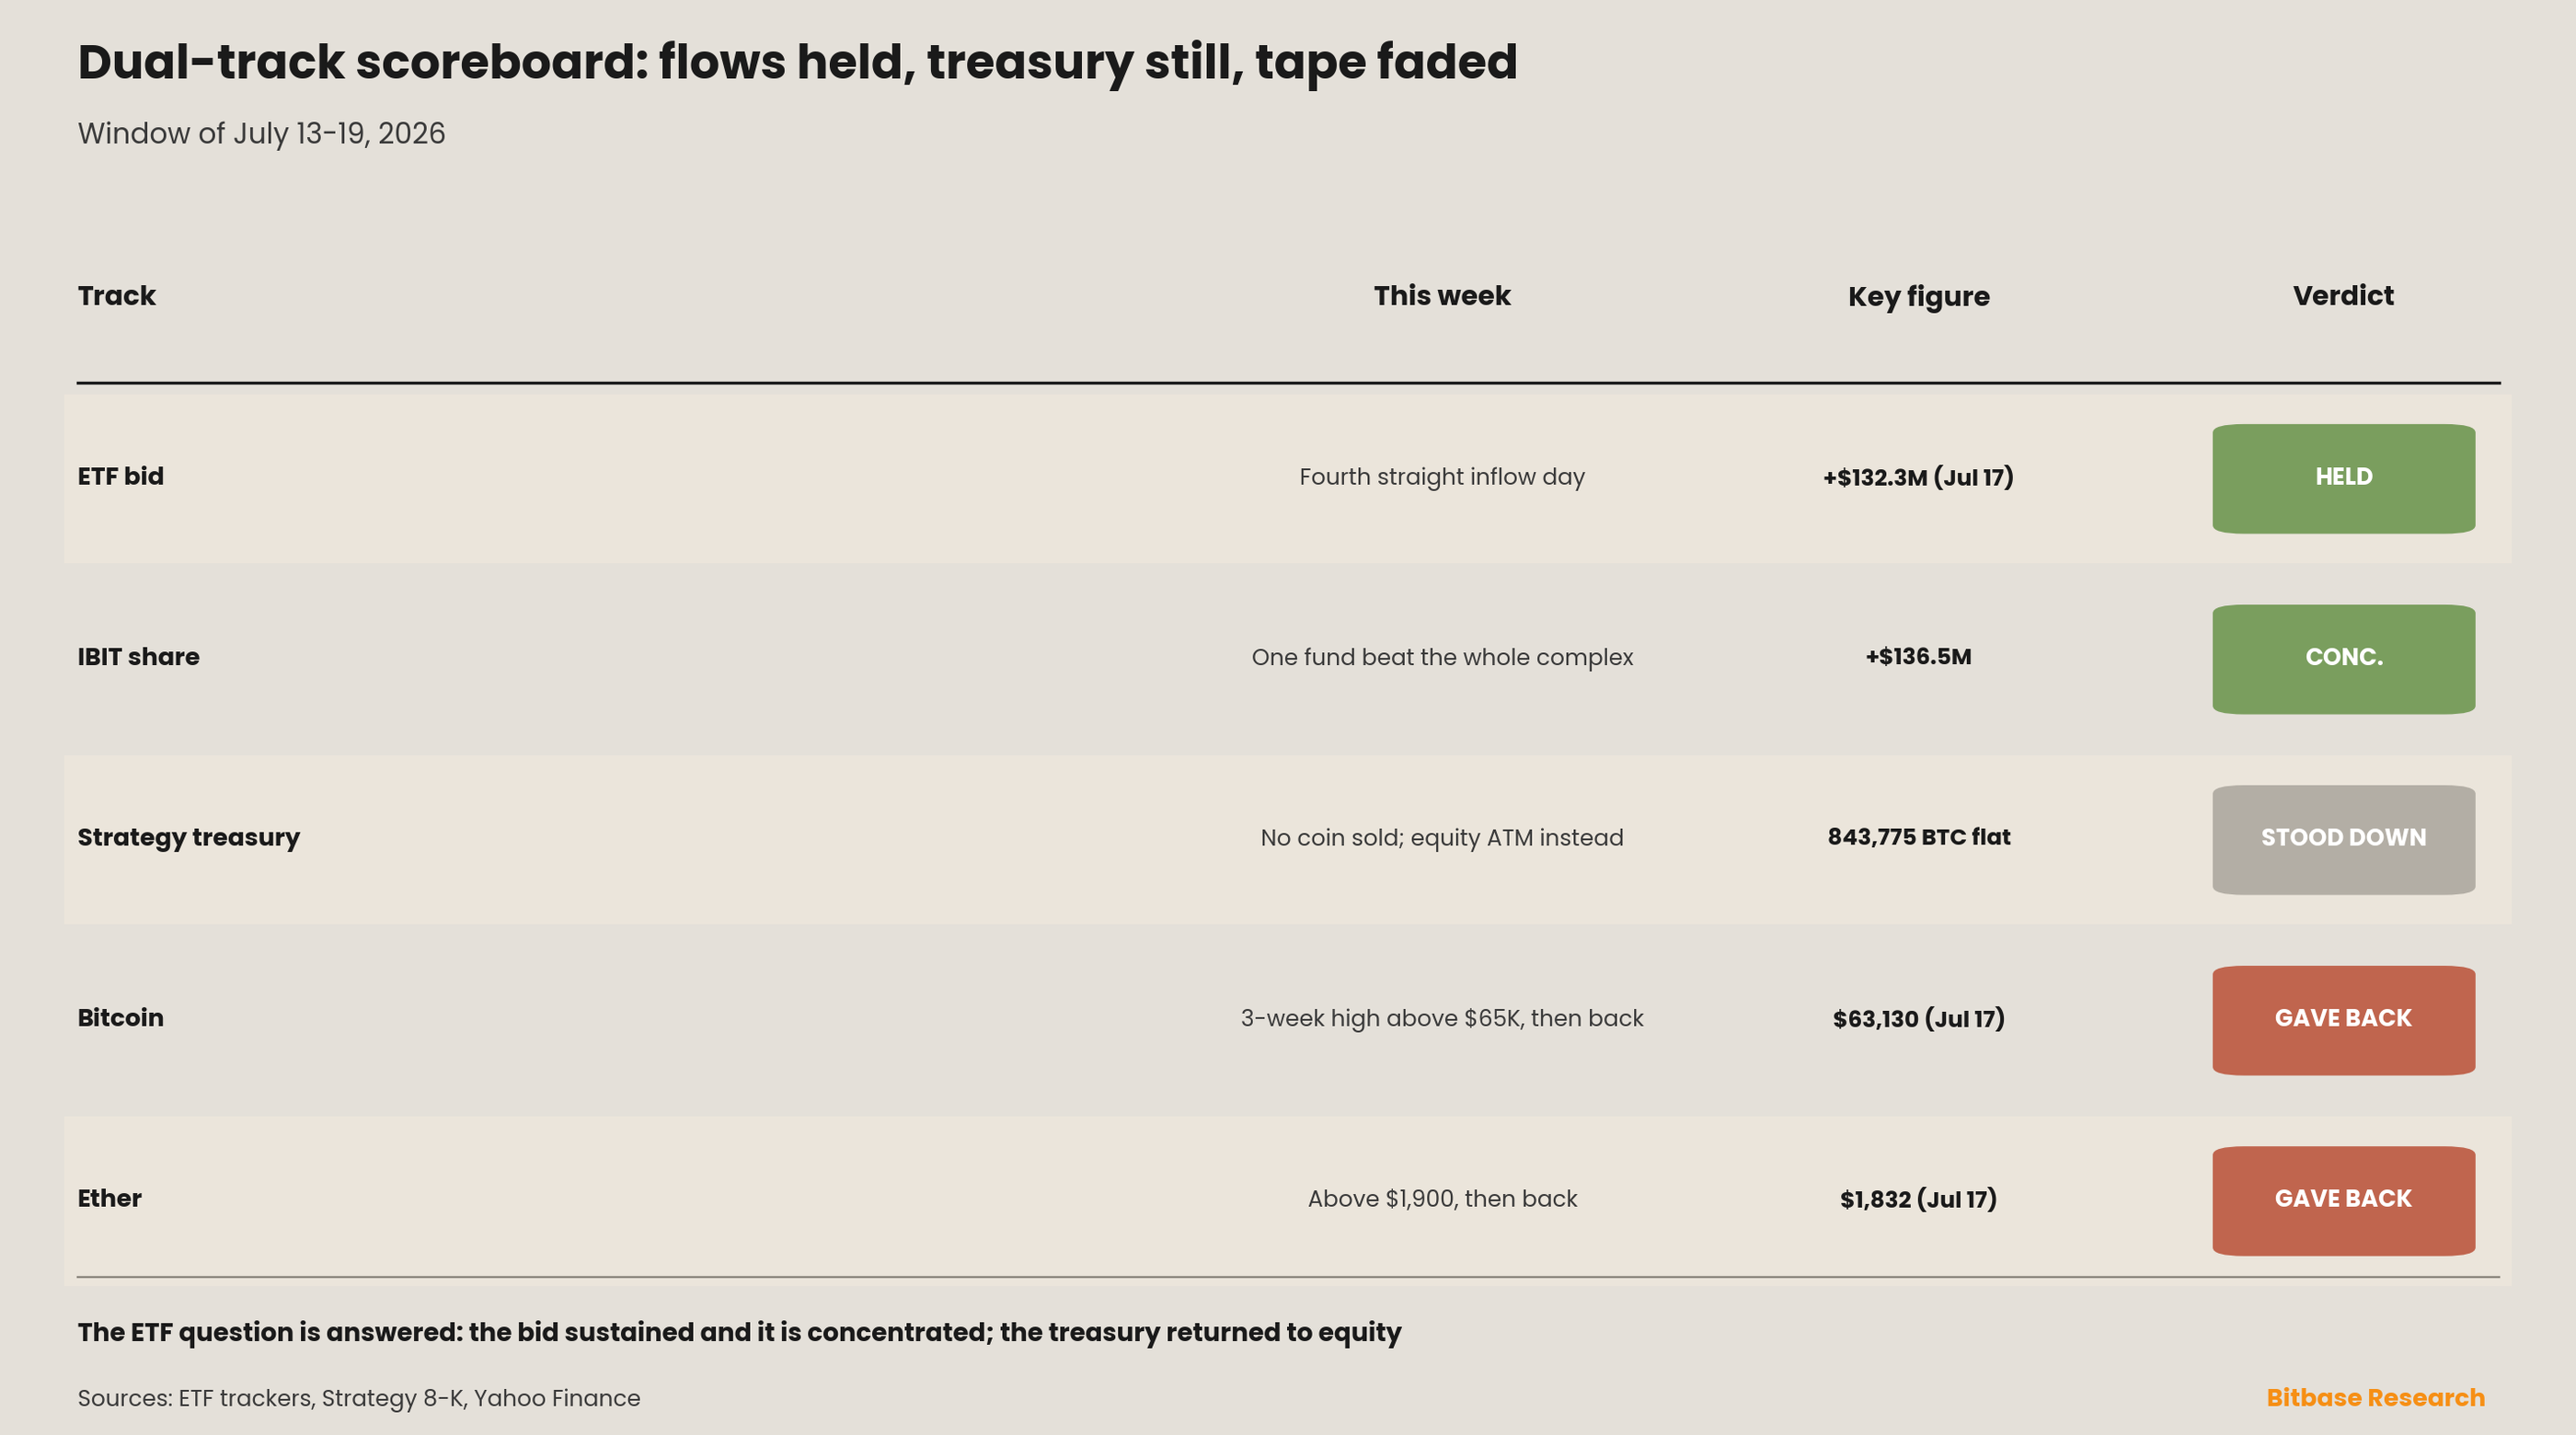
Track one—the ETF bid extended and broadened. The inflow sequence that reopened in Issue 14 did not fade after a few sessions, which was the explicit question this series carried into the week. US spot-Bitcoin ETFs booked +$108 million on July 15, +$79.15 million on July 16, and +$132.3 million on July 17—a fourth consecutive positive session [5][6][7]. BlackRock's IBIT stayed decisively in front, taking $80.82 million on the 15th and $136.5 million on the 17th, the latter exceeding the complex's entire net for that day as FBTC shed $4.2 million [5][7]. The reversal now stands against more than $8 billion of cumulative prior outflows [6]. Question answered: the bid sustained, and it is concentrated.
Track two—the corporate treasury stood down. The other open question was whether Strategy's first-ever bitcoin sale, the 3,588 BTC disposed across late June and early July to fund Digital Credit dividends, was a one-off or the opening of a cadence. The 8-K covering July 6–12 answers it for this cycle: the company raised $466.7 million by selling 4.8 million Class A shares through its ATM program and recorded no bitcoin transactions, leaving holdings unchanged at 843,775 BTC [11]. It returned to the equity playbook rather than the coin. The authorization to monetize up to $1.25 billion of bitcoin remains outstanding and unused [11]. On the evidence so far, the sale was event-driven, not a policy shift.
Track three—the tape. Bitcoin ran $61,600 on Monday to above $65,000 on Wednesday and settled back near $63,100–63,800 by Friday morning; ether ran to above $1,900 and settled near $1,832 [8][12]. Against a month ago bitcoin is −2.8% and ether +4.1%; against a year ago both remain far below, −46.3% and −44.7% respectively [8].
On the radar—week of July 20 to July 26
The calendar hands off from data to decision. With June CPI behind it, the week ahead is about whether the relief survives contact with the two things that can undo it: the oil path and the Fed.
First, the July 29 FOMC is now the whole game. The cool print cut July hike odds to the teens-to-20% range, but September remains near a coin flip weighted toward tightening [3][4]. A committee that has a hawkish chair on record for one to two more hikes this year will read a headline-driven, energy-led undershoot differently than a broad one—and core at 2.6% with a flat month is the number that argues for patience.
Second, and more consequential for the July CPI due in August: does the Hormuz closure reverse the disinflation? Energy delivered essentially all of June's improvement. If oil holds its rebound through the month, the mechanism that produced the soft print runs in reverse, and the market will have rallied on a number that does not repeat.
Third, do the ETF inflows extend past four sessions, and does IBIT keep the lead? A four-day run reopened the question of whether the wrapper bid is durable. A second week of the same, with concentration intact, would make it a trend rather than a bounce.
Fourth—and the single most important follow-up for this series' longest-running signal—does the money-market drawdown repeat? The July 22 ICI print is the test. One week is not a rotation; two would be the first real evidence of one.
Fifth, Strategy's next 8-K, covering July 13–19, shows whether the equity-ATM route or the coin sale is the funding default from here.
Signal tracking update
SIGNAL — Deep Dive 1 Part 1: "MMF asset scale inflection point." STATUS: FIRST DRAWDOWN—the record broke.
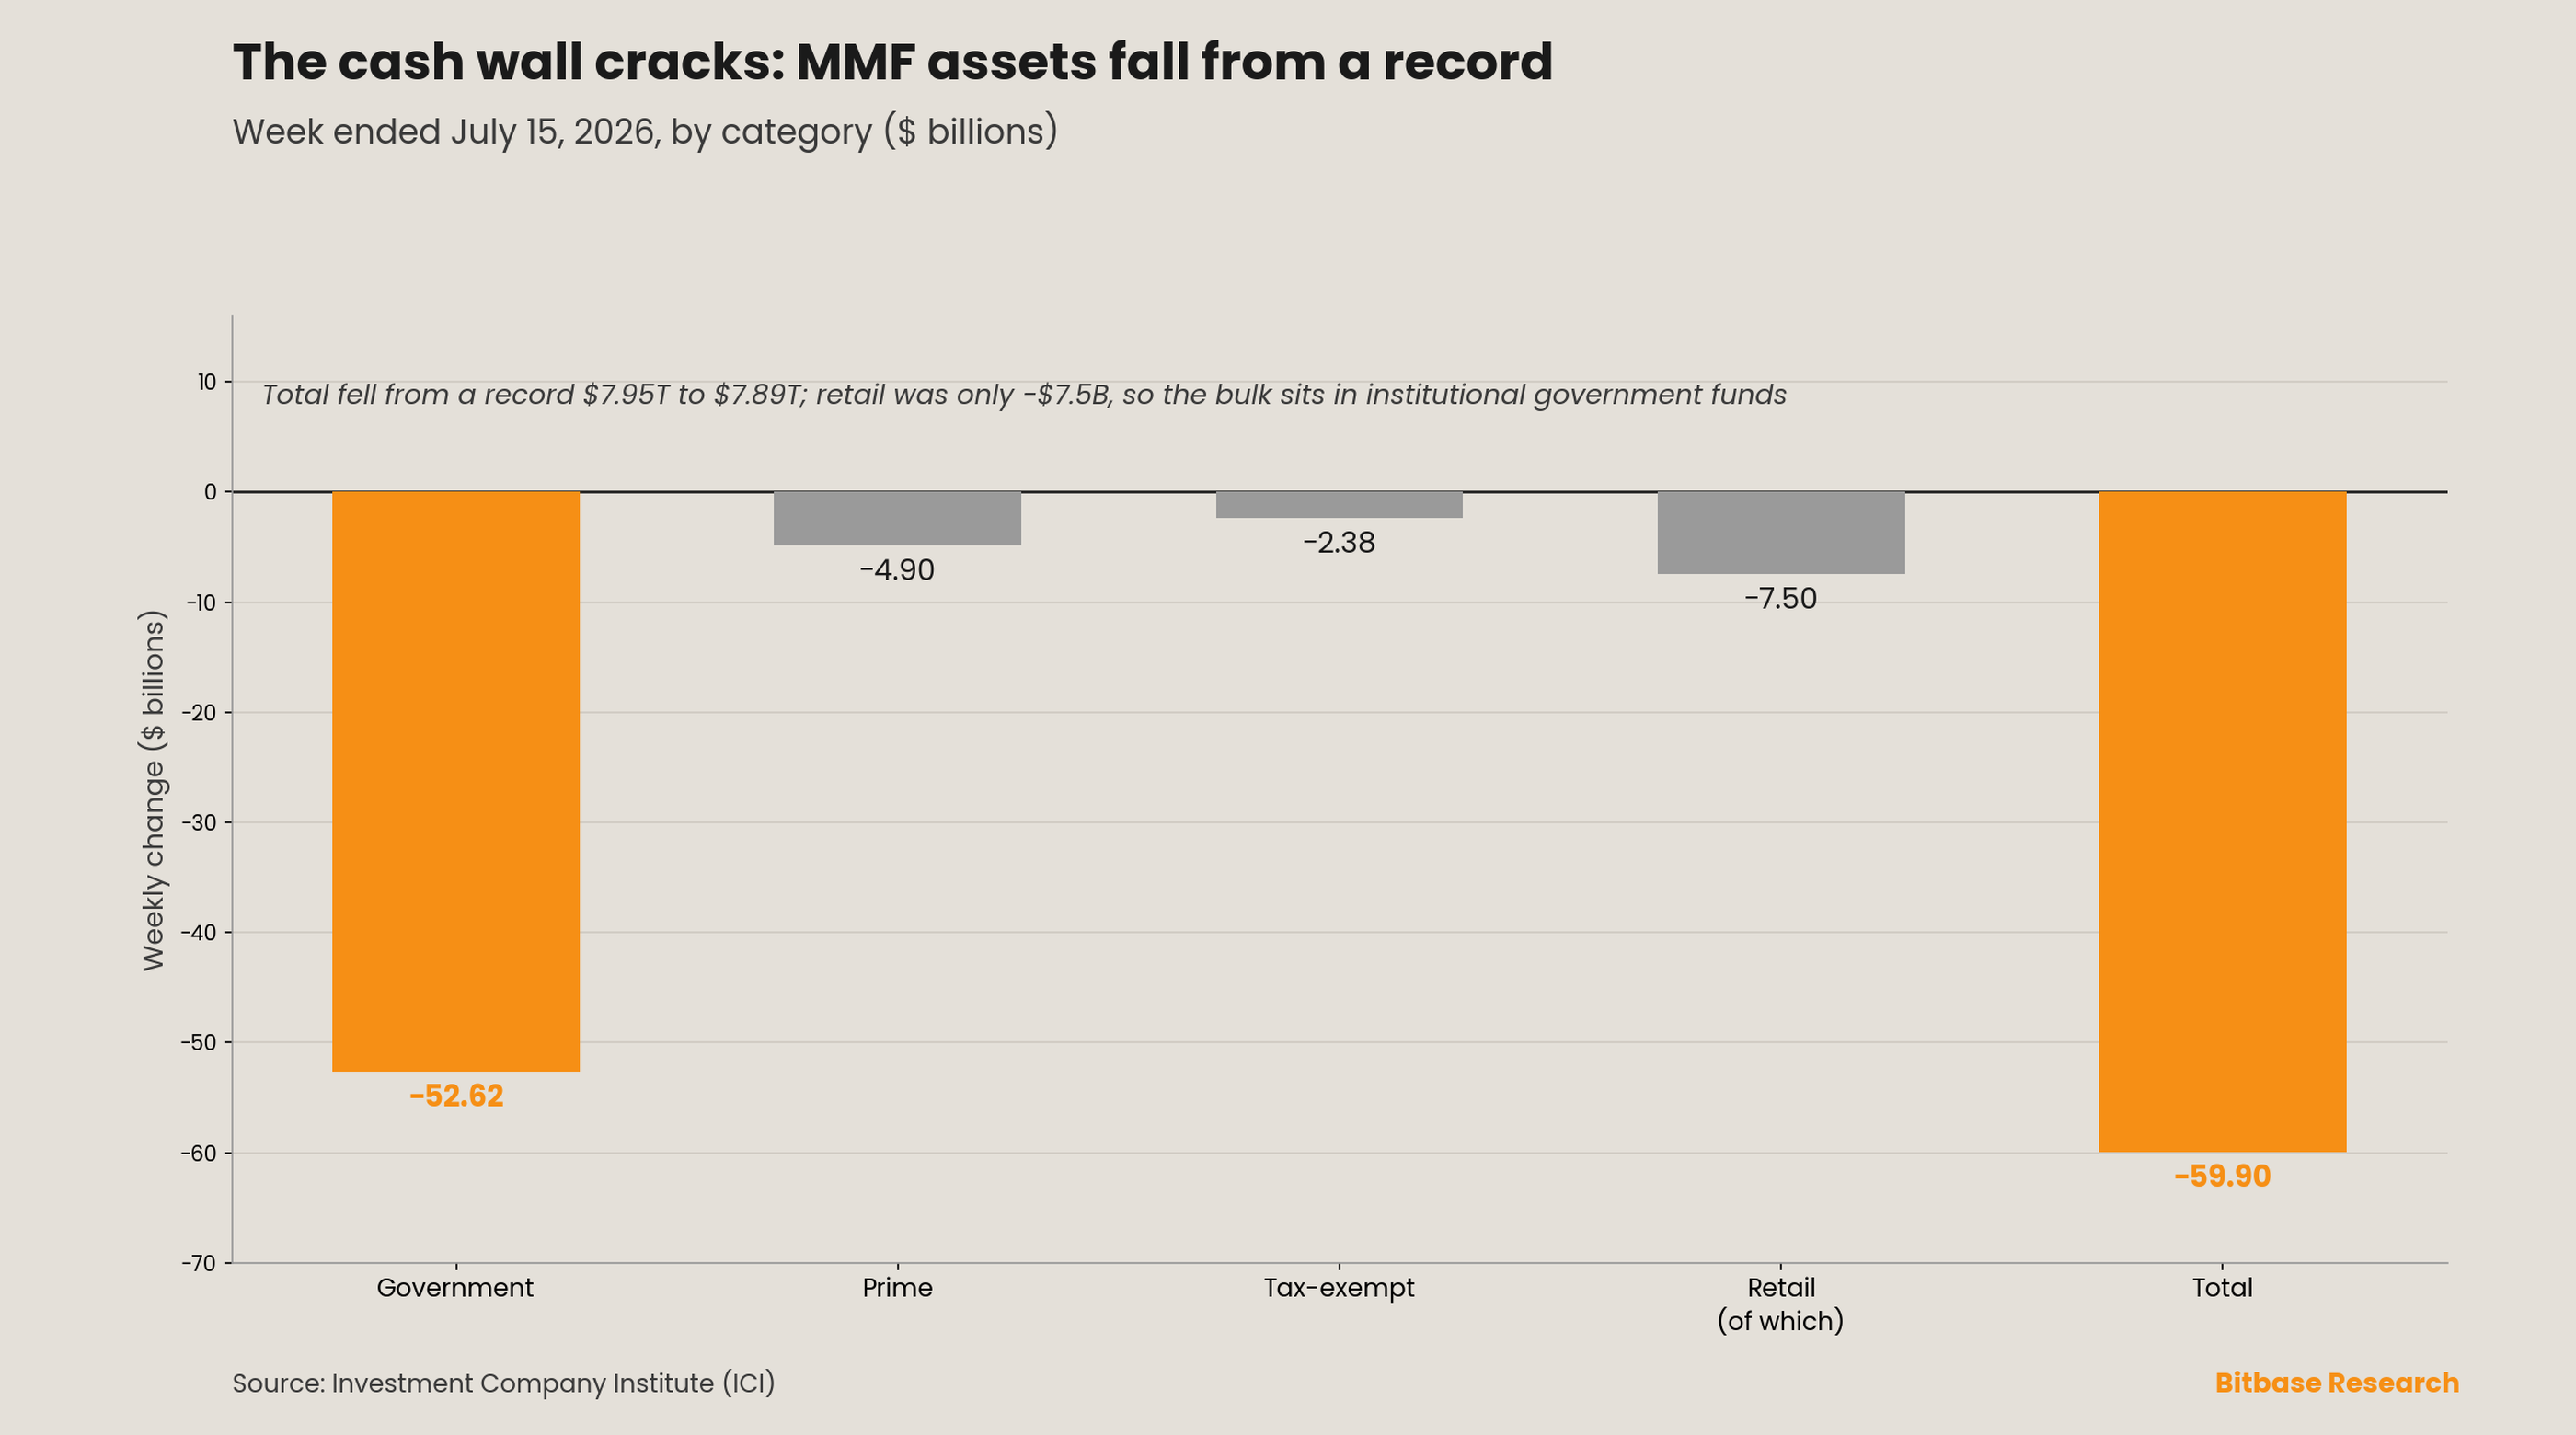
This is the update the series has been waiting four issues to write. Per the Investment Company Institute, total money-market-fund assets fell $59.90 billion to $7.89 trillion for the week ended Wednesday, July 15, down from the record $7.95 trillion set the prior week [13]. The decline was broad across taxable categories: government funds −$52.62 billion, prime −$4.90 billion, tax-exempt −$2.38 billion [13]. Retail accounted for only −$7.50 billion of it, falling to $3.08 trillion, which places the bulk of the move—roughly $47 billion—in institutional government funds [13].
Why this reads as a genuine change. Issue 14 stated the test explicitly: "Until a risk-on week finally coincides with a money-fund drawdown, the inflection stays ahead of us." This week supplied exactly that coincidence. The tape was risk-on—a cool CPI, bitcoin at a three-week high, four straight days of ETF inflows—and the cash pile shrank at the same time, for the first time in this series' tracking. Every prior relief rally left the money-fund record intact, which is what made the cash wall look sticky rather than merely large. This one did not.
The caveats matter and are not small. One week is not a trend, and the concentration in institutional government funds is a caution: those balances move on tax dates, settlement plumbing and bill supply as much as on risk appetite, and a single −$59.9 billion print can reverse without any change in allocation behavior. The honest reading is that the inflection is no longer purely ahead of us—it has produced its first datapoint. Whether it produces a second is the July 22 question.
SIGNAL — Deep Dive 1 Part 6: "Whether CME crypto-derivatives open interest persistently holds above $30 billion by 2027." STATUS: On track; data gap persists.
No Tier-1 source published a standalone CME crypto open-interest read covering July 13–19. The prior level—roughly 15,400 contracts, about $4.9 billion of notional—is carried forward unchanged and flagged, the same gap noted since Issue 10. The signal stays on track against a multi-year horizon and remains far below the $30 billion threshold it watches.
SIGNAL — Deep Dive 1 Parts 3 and 6: "Tokenized RWA as common collateral infrastructure." STATUS: Live—the pilot became production inside this window.
This is the signal's largest step since the series began tracking it. On July 15, the DTCC began live tokenization trades with roughly 40 institutions, among them JPMorgan, Goldman Sachs, BlackRock, Vanguard, Invesco and the New York Stock Exchange [20]. The first batch is deliberately unexotic: Microsoft and Circle shares, the Invesco QQQ Trust, the SPDR S&P 500 ETF, the iShares 0–3 Month Treasury Bond ETF and Treasury securities across maturities. JPMorgan completed an equity token conversion on QQQ as the demonstration case [20].
The design choice is the part that matters, not the headline. These are not synthetic wrappers referencing securities held elsewhere. The tokens are the same legal securities already sitting in DTCC custody, carrying the same dividends, the same voting rights and the same legal protections, and they remain interchangeable with untokenized shares [20]. Settlement runs on either DTCC's private Hyperledger Besu chain or the Canton Network, at the participant's option. That is precisely the shape this signal was written to detect: not a crypto venue borrowing TradFi assets, but the central clearing layer for $114 trillion of custodied securities issuing on-chain claims that are legally the originals. Full platform launch is scheduled for October.
SIGNAL — Deep Dive 1 Part 6: "Whether the US CFTC approves more licensed entities to offer perpetual-swap-style products." STATUS: The first approval is resolved; a second name is still outstanding.
This signal has been carried as "pending" for four issues, and the pending half of it is now settled. In late May the CFTC issued an Order of Approval to KalshiEX for BTCPERP, a cash-settled perpetual contract referencing spot bitcoin—the first perpetual futures listed on a US-regulated exchange [21]. The route matters: the CFTC used the formal product-approval process under Regulation 40.3, which requires affirmative Commission review, rather than the self-certification exchanges normally use. A June policy statement then set the standing framework for listing perpetual contracts [22].
What the series now watches is narrower and harder. The Commission was explicit that perpetuals will be reviewed case by case, because their design varies with the underlying, and that the Kalshi order does not extend to asset classes it did not contemplate [21][22]. So the question is no longer whether an onshore perpetual is possible—it is whether the case-by-case path is fast enough to produce a second and third licensed venue, or whether it functions as a de facto moat around the first mover. Nothing in this window moved that; this reads as a gap, not as a negative.
SIGNAL — Deep Dive 1 Part 6: "Whether perpetual-DEX annual trading volume holds above $5 trillion in 2026." STATUS: On track, and the composition is the news.
On July 13, Hyperliquid's total open interest reached $11.07 billion, its 2026 high, up 9.71% on the week, with the trailing 30-day figure at $288.3 billion [23]. Annualising that 30-day number gives roughly $3.5 trillion for a single venue against a $5 trillion all-venue threshold—consistent with the signal holding, though the series continues to treat single-venue annualisation as indicative rather than dispositive.
The mix is what makes this week worth writing down. Of that record open interest, about $3.69 billion—roughly a third—sat in HIP-3 tokenized equity and commodity markets, with real-world-asset trading at an all-time high on the venue [23]. Read that against the DTCC item above and the two signals stop being separate: the same asset class, index equities and Treasuries, is arriving on-chain from opposite directions in the same week—top-down through the central clearinghouse, bottom-up through a permissionless perpetual venue. On July 14, representatives of the Hyperliquid Policy Center, Highland Labs and Sullivan & Cromwell met the SEC's Crypto Task Force [23], which is the bottom-up track acknowledging it needs the top-down one.
And the price disagreed with all of it. HYPE fell 11.7% over the week to about $59.16, well below its mid-June high near $76.85, while open interest, RWA share and regulatory engagement all set records [23]. That divergence belongs in this issue specifically: it is the same lesson as the CPI print—an improving number and an improving asset are different claims, and the market was willing to sell one while the other made new highs.
New dimension—the World Cup closed, and prediction markets kept the receipts
The tournament ended on Sunday, July 19, and the final was the largest single prediction-market event ever recorded. Spain beat Argentina 1–0 after extra time at MetLife Stadium, Ferran Torres scoring in the 105th minute for Spain's second World Cup title and its first since 2010, in front of more than 70,000 spectators; Enzo Fernández was sent off in stoppage time and Lionel Messi finished a third final on the losing side [14][15].
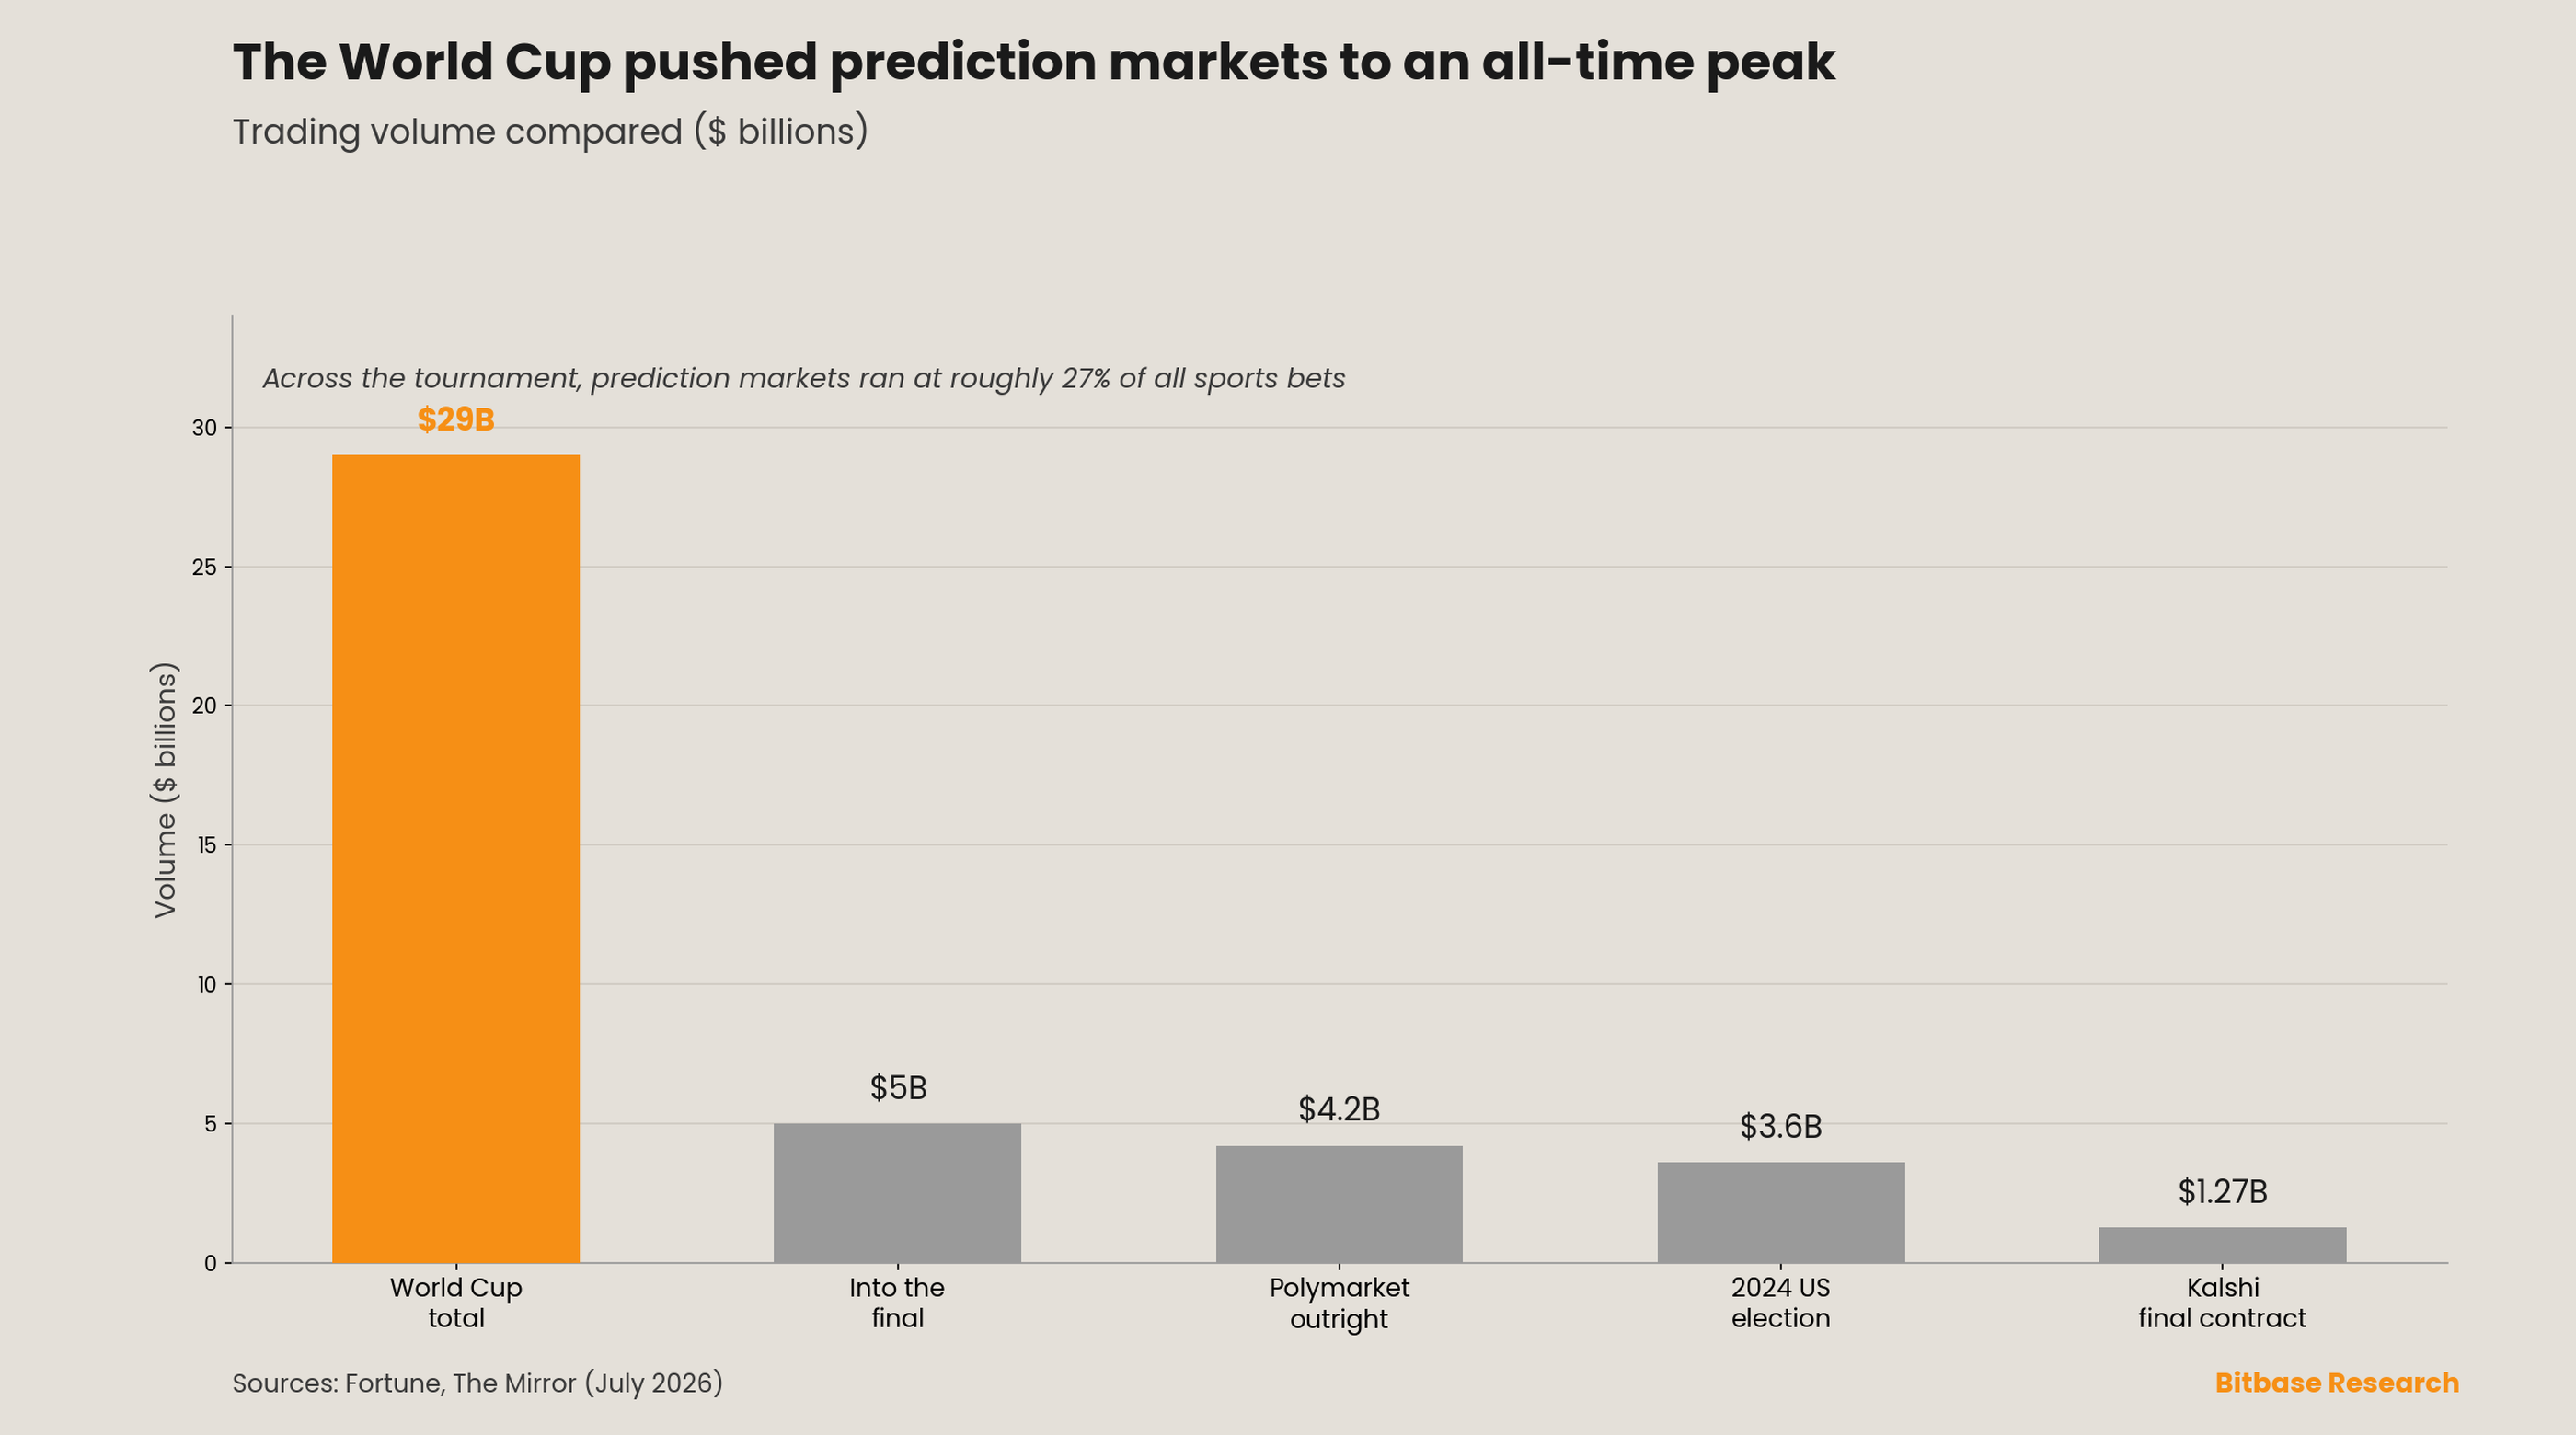
The financial footprint is the part this series tracks. More than $5 billion flowed into prediction markets on Kalshi and Polymarket ahead of the final alone, and total World Cup volume across the two venues exceeded $29 billion [16][17]. The Argentina–Spain outcome contract passed $1.27 billion on Kalshi, while Polymarket drew $4.2 billion on the outright-winner market [17]. The tournament out-traded the Super Bowl, March Madness, the Masters and the NBA Finals—and the 2024 US presidential election, which took $3.6 billion, the only prior event in the same range [17]. Across the tournament, prediction markets swelled to roughly 27% of all sports bets [18].
Why it counts as a new dimension rather than a sports footnote. Issue 14 asked whether the semi-finals and final would drive the category to a tournament peak and close a record June with a larger July. They did, emphatically—June had already run +75% to $44.8 billion in combined volume with the World Cup contributing $832 million, and July's final week alone added multiples of that [19]. The structural read is that event-driven prediction volume has stopped being episodic. A category that can absorb $29 billion on a single tournament, and hold better than a quarter of sports-betting flow while doing it, has crossed from novelty into infrastructure. The open question—now that the tournament is over—is what the runoff looks like: whether volume normalizes back toward the pre-tournament baseline, or whether the World Cup permanently widened the user base these venues carry into the autumn calendar.
Caveats
Date integrity. This issue's window is July 13–19, 2026. The June CPI release (July 14), the ETF flow prints (July 15–17), the Strategy 8-K covering July 6–12, the ICI money-fund week ended July 15, and the World Cup final (July 19) all fall inside it. The July 29 FOMC, the July 22 ICI print, and July CPI all fall after this window and are treated as forward items, not results.
Verification status. The load-bearing figures—June CPI headline, monthly and core prints; the spot-Bitcoin-ETF daily flows and IBIT's share; Strategy's holdings, share sale and absence of bitcoin transactions; the ICI money-market drawdown and its composition; the 2-year yield and dollar-index closes; and the World Cup result and prediction-market volumes—have been traced to primary or named Tier-1 sources.
Data-caliber conflicts and gaps flagged.
- July hike odds are carried as a range (roughly 13%–20% post-print, from about 42% on Monday) because published figures differ by source and by snapshot time on July 14 [3][4]. No single reading is treated as authoritative.
- Bitcoin and ether closing prints for July 18–19 sit at the edge of available Tier-1 data and are carried at the July 17 levels ($63,788.52 open / $63,130.40 intraday for bitcoin; $1,863.16 open / $1,832.29 for ether). Weekend prints are not asserted.
- No single Tier-1 source publishes one authoritative weekly ETF total; daily figures are drawn from named trackers and remain subject to T+1 revision.
- CME crypto open interest has no standalone Tier-1 read for this window; the prior level is carried and flagged, a gap outstanding since Issue 10.
- The dollar index is reported at its July 17 close (100.755, day range 100.647–100.867); because that range straddles the ~100.8 threshold this series tracks, the leg is described as neither cleanly cleared nor cleanly rejected.
- The ICI drawdown's composition is disclosed by category but not by motive; the attribution of roughly $47 billion to institutional government funds is arithmetic from the published retail and total splits, not a stated ICI finding.
- The DTCC pilot is reported from a Wall Street Journal account and the DTCC's own disclosure, not from a regulatory filing; participant counts are given as "roughly 40" because the published figures differ between the May announcement (50+ convened) and the July launch (nearly 40 trading) [20].
- Hyperliquid figures are single-venue and vendor-sourced; the $5 trillion threshold this signal tracks is an all-venue annual number, so a single venue's 30-day annualisation is directional evidence, not a measurement of the threshold [23].
Interpretation risk. The central claim of this issue—that the rally rested on a driver that reversed within the week—is a reading of sequence and composition, not a forecast. Energy-led disinflation can persist if oil retraces; a Hormuz reopening would restore the mechanism as quickly as its closure removed it. Nothing here is investment advice.
References
[1] US Bureau of Labor Statistics, Consumer Price Index news release, June 2026 results, published July 14, 2026. bls.gov
[2] Consumer price index inflation report, June 2026, July 14, 2026. cnbc.com
[3] Treasury yields and Fed hike expectations after the June CPI release, July 14, 2026. cnbc.com
[4] Treasuries rally as cool CPI data cuts July Fed hike bets, July 14, 2026. bloomberg.com
[5] Spot Bitcoin ETF inflows July 15, 2026, IBIT $80.82M. theblock.co
[6] BlackRock's IBIT leads Bitcoin ETFs with $79M inflows on July 16, 2026. cryptobriefing.com
[7] US spot-Bitcoin ETFs see $132.3M net inflow on July 17, 2026, fourth consecutive day. kucoin.com
[8] Bitcoin and ethereum prices, Friday July 17, 2026: prices ease as conflict in Iran escalates. finance.yahoo.com
[9] Treasury yields snapshot, July 17, 2026 (2-year at 4.18%). advisorperspectives.com
[10] US Dollar Index holds as mixed US data limits upside, July 17, 2026. fxstreet.com
[11] Strategy raises $466.7M via stock sales, leaves 843,775 BTC untouched, July 2026 8-K. kucoin.com
[12] Bitcoin hits three-week high above $65K on inflation data, July 15, 2026. bitcoinfoundation.org
[13] Investment Company Institute, weekly money-market fund assets, week ended July 15, 2026. ici.org
[14] Spain v Argentina 1–0, result and statistics, FIFA World Cup 2026 final, July 19, 2026. fifa.com
[15] Spain defeats Argentina 1–0 to win the 2026 World Cup, July 19, 2026. npr.org
[16] More than $5 billion poured into prediction markets before the World Cup final, July 2026. themirror.com
[17] World Cup final is the biggest ever prediction market as Kalshi bets top $1.27 billion, July 17, 2026. fortune.com
[18] Prediction markets swell to 27% of sports bets during the World Cup, July 19, 2026. fortune.com
[19] Kalshi and Polymarket volume surges 75% to $44.8B in June; World Cup drove $832M. bitcoinfoundation.org
[20] JPMorgan, BlackRock and Goldman to tokenize stocks and Treasuries; DTCC live tokenization pilot, July 15, 2026. cryptotimes.io
[21] CFTC approves the BTCPERP contract submitted by KalshiEX, LLC, May 2026. cftc.gov
[22] Policy statement concerning the listing of perpetual contracts, Federal Register, June 3, 2026. federalregister.gov
[23] Hyperliquid open interest at a 2026 high of $11.07 billion with HIP-3 RWA markets at a record, and the July 14 SEC Crypto Task Force meeting, July 2026. cryptotimes.io