The floor Issue 11 left as "untested support" went to the test this week, and the test came from the same place that gated the bottom a week earlier: the macro rate path. The hawkish June FOMC drew its first hard confirmation on June 25, when the May reading of the Fed's preferred inflation gauge printed at a three-year high—headline
PCE +4.1% year over year, the first print above 4.0% since April 2023, and core +3.4%, the hottest since October 2023. The number validated rather than undercut Warsh's dot-plot pivot, and the highest-beta non-yielding asset paid for it: Bitcoin broke the $60,000 psychological floor intraweek to a fresh roughly 20-month low, settling near $60,256 on June 28, down about 4.5%
on the week and pressing toward the early-June low near $59,000. Spot-Bitcoin-ETF demand stayed absent—a seventh straight session of net outflows into June 26, a roughly $445 million single-day exit led almost entirely by BlackRock's IBIT, and about −$1.67 billion on the week—while the one confirmation leg that has held all along held again: Strategy's treasury stood at 847,363 BTC
even as the position sat roughly $13 billion underwater. The sharpest lesson was for the decoupling thesis Issue 11 flagged as a candidate dimension: it did not hold. HYPE, the on-chain-native bellwether that printed an all-time high during the prior down week, fell about 7% and underperformed a market down roughly 4.8%—evidence that when the rate constraint binds hard enough,
even the on-chain-native track re-couples. The one leg moving the other way is disinflation: Brent fell more than 10% on the week toward $72, its lowest since February.
Week of June 22 to June 28, 2026
Bitbase Research · June 29, 2026
Market Insights is Bitbase Research's short-wave companion to our Deep Dive flagship series. Each edition reviews the most structurally meaningful developments of the preceding week in compliant crypto derivatives and on-chain native infrastructure, mapped against the long-wave framework set out in our flagship reports.
The previous issue recorded the week the Fed's June meeting tested whether the post-exhaustion floor could draw demand and found that it could not: Warsh's hawkish hold reset the front end of the curve, spot-Bitcoin-ETF inflows were rejected, and the macro rate path emerged as the gating variable on the bottoming question—with the on-chain-native track, where HYPE printed a record,
flagged as the one place idiosyncratic demand could still express itself [22].
This issue records the week that framework met its first hard test. The data-scope split is unchanged: crypto-native data covers the full seven days (June 22–28), while traditional-finance data—US spot Bitcoin and Ether ETF flows, MSTR equity, Treasury yields, money-market-fund data—trades or releases only on weekdays.
TradFi data is anchored to end-of-day Friday June 26 (ET) unless otherwise stated; crypto data extends through Sunday June 28. The May PCE release (June 25) falls within this window and is the issue's headline.
1. The one chart that matters
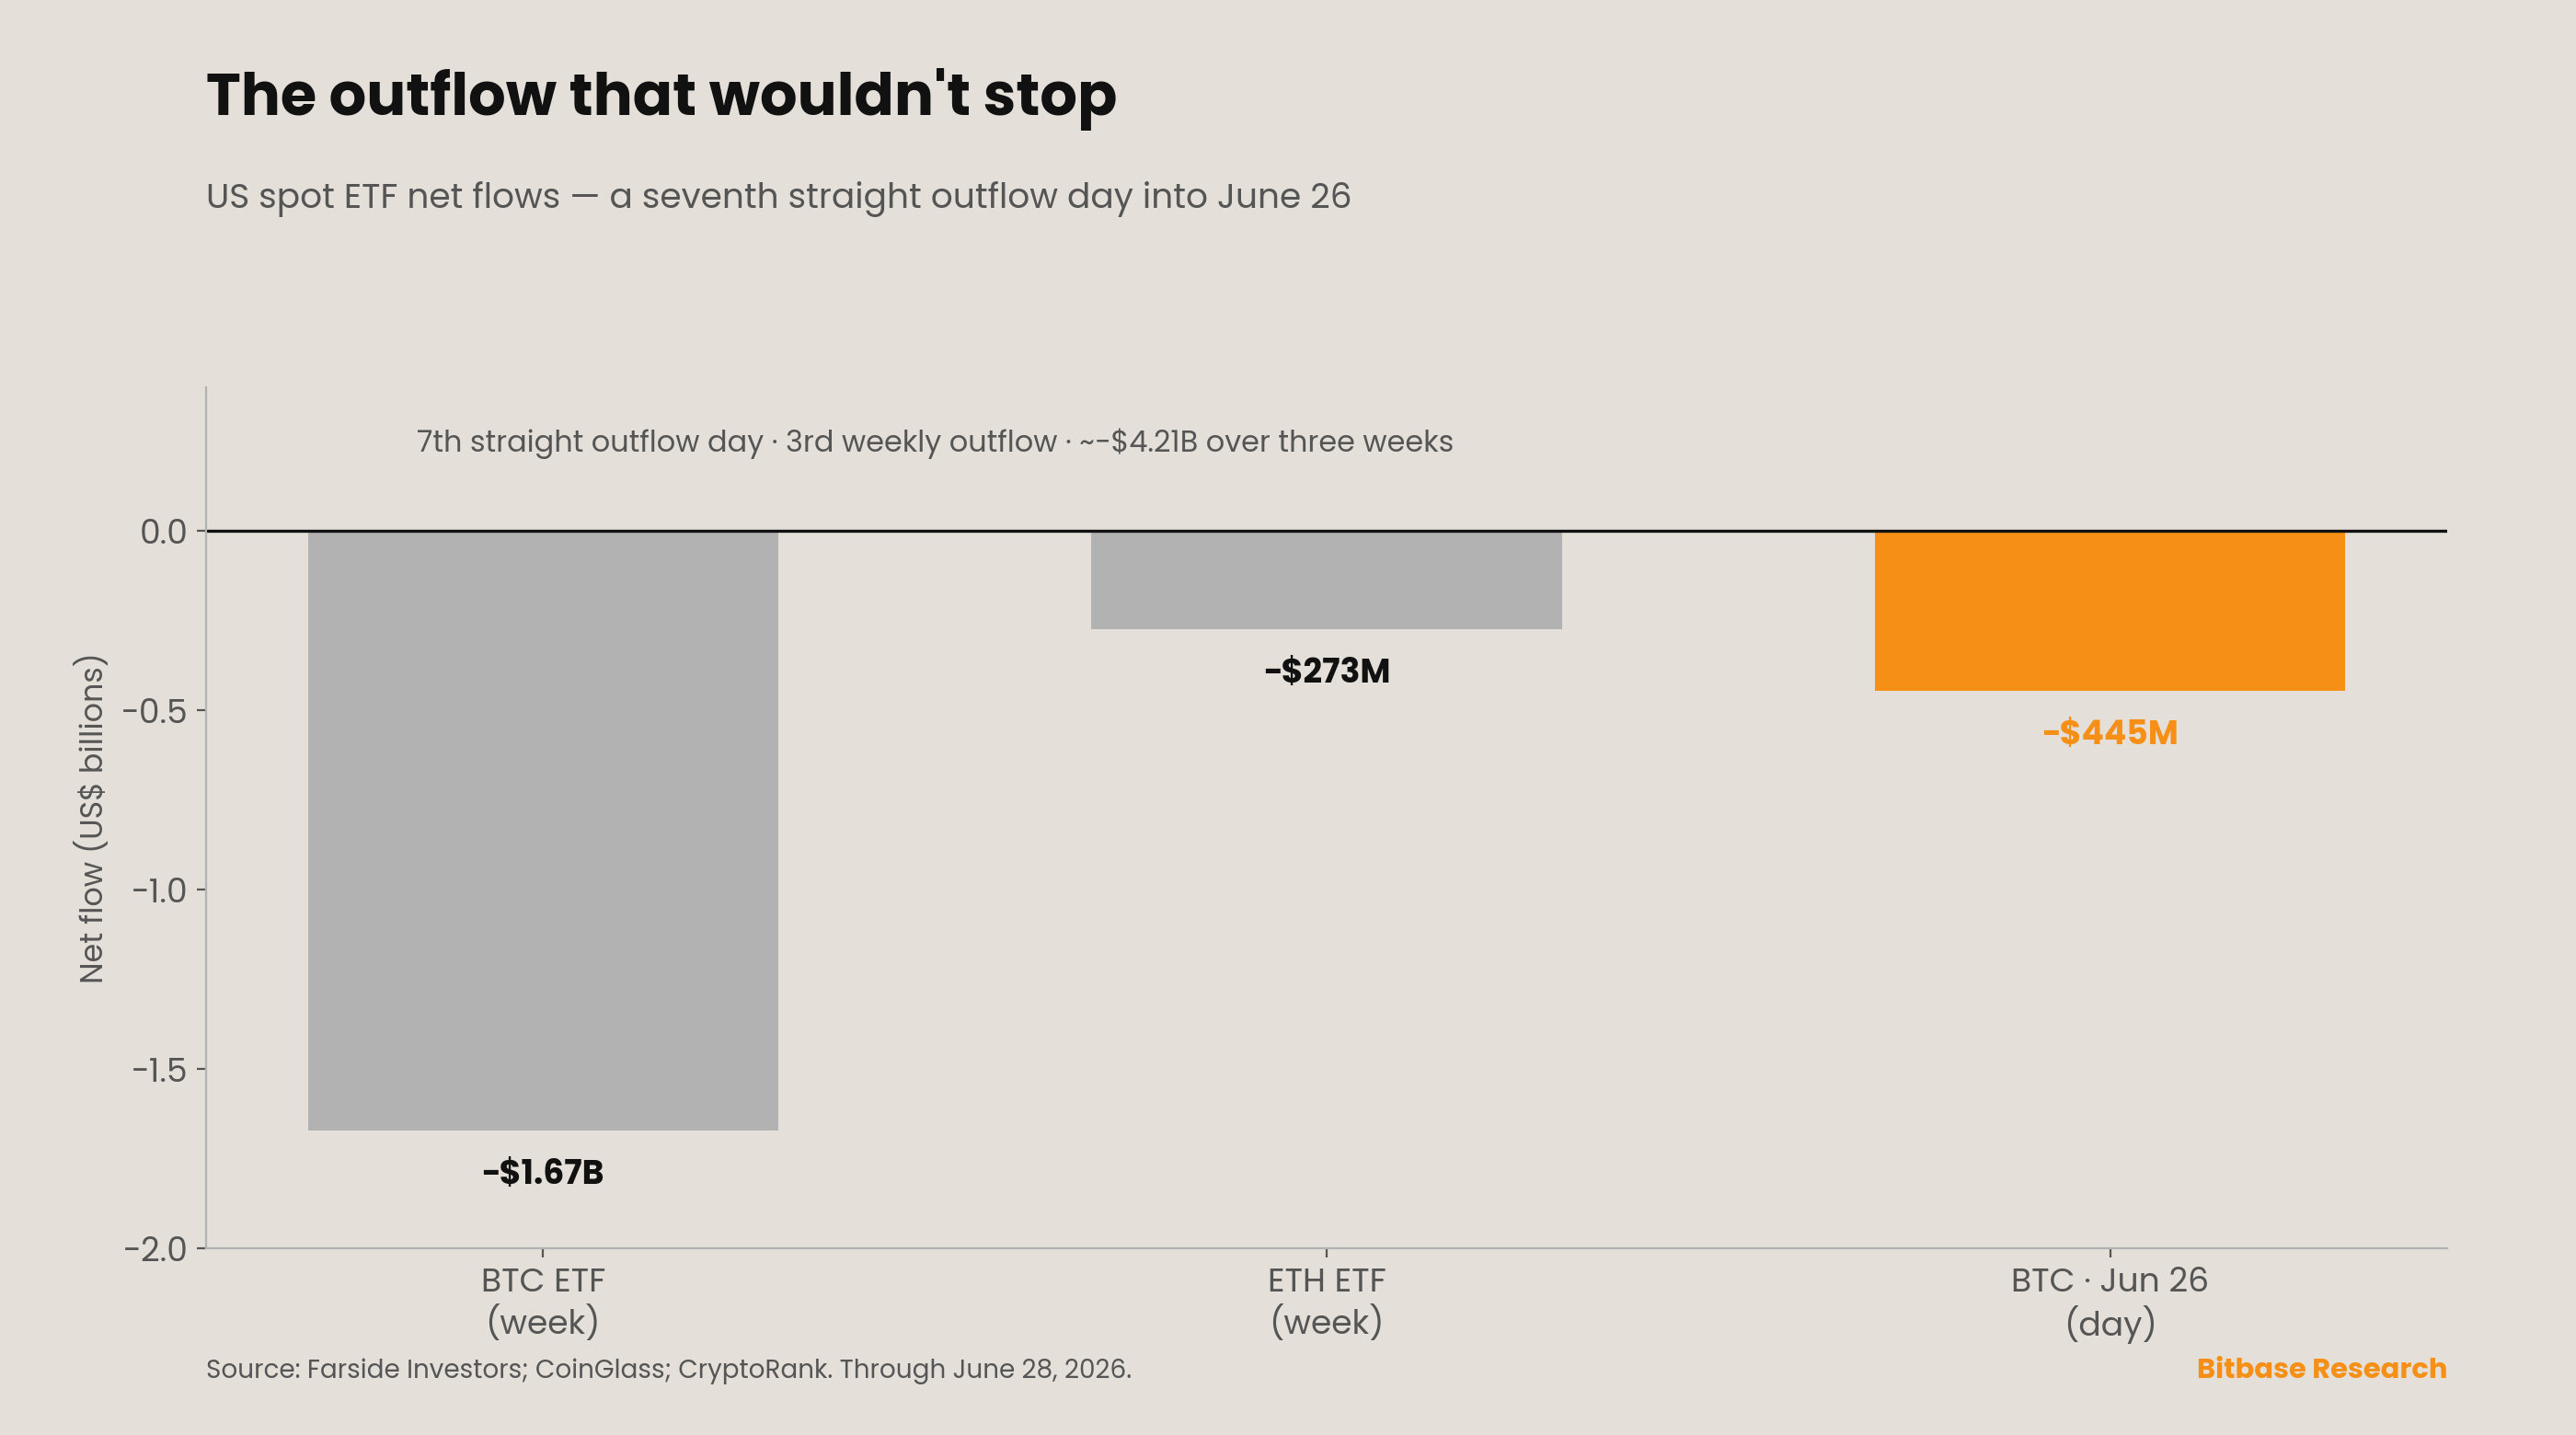
The chart that mattered last week was the failed two-day inflow test; the chart that matters this week is its continuation into an outright streak. US spot Bitcoin ETFs logged a seventh consecutive session of net outflows through June 26, and the week totaled roughly −$1.67 billion—the third straight week of net redemptions, bringing the running three-week total to about
−$4.21 billion [1][2]. The single most concentrated session was June 26, at about −$445 million, of which BlackRock's IBIT accounted for roughly −$444.5 million—one of IBIT's largest single-day redemptions since its January 2024 launch [1]. The streak sits inside the broader pattern the series has tracked since Issue 9: the May 15–June 3 run of 13 consecutive outflow days drained
about $4.4 billion, and the two May–June streaks combined have removed an estimated $7.2 billion from the products [3]. (The full day-by-day June 22–25 series is carried at lower precision pending final Farside prints; the weekly total and the June 26 session are the anchored figures.)
Ether ETFs ran the same direction and the same streak length, but smaller in absolute terms: a seventh straight outflow day into June 26 and a weekly total of roughly −$273 million, with June 22 at about −$66.1 million (BlackRock's ETHA accounting for essentially all of it) and June 26 at about −$12.8 million, again ETHA-led [4]. The distinction Issue
11 drew—decelerating supply versus confirmed demand—now reads cleanly on the demand side: the obstruction in front of ETF demand is the rate path, and this week the rate path got firmer, not looser. The remainder of this issue traces the PCE print and its transmission, the corporate-treasury and on-chain tracks, the prediction-market line, and the eight signals under continuous audit,
before turning in Section 6 to the decoupling thesis that did not hold.
2. This week's structural signal
The structural signal of the week was the May PCE print, the first hard test of the hawkish June dot plot—and it validated the pivot rather than undercutting it.
It matters to this series not as a surprise—the print was broadly in line with consensus—but as confirmation that the rate constraint Issue 11 identified as the gating variable is anchored in the data, not just in the committee's projections.
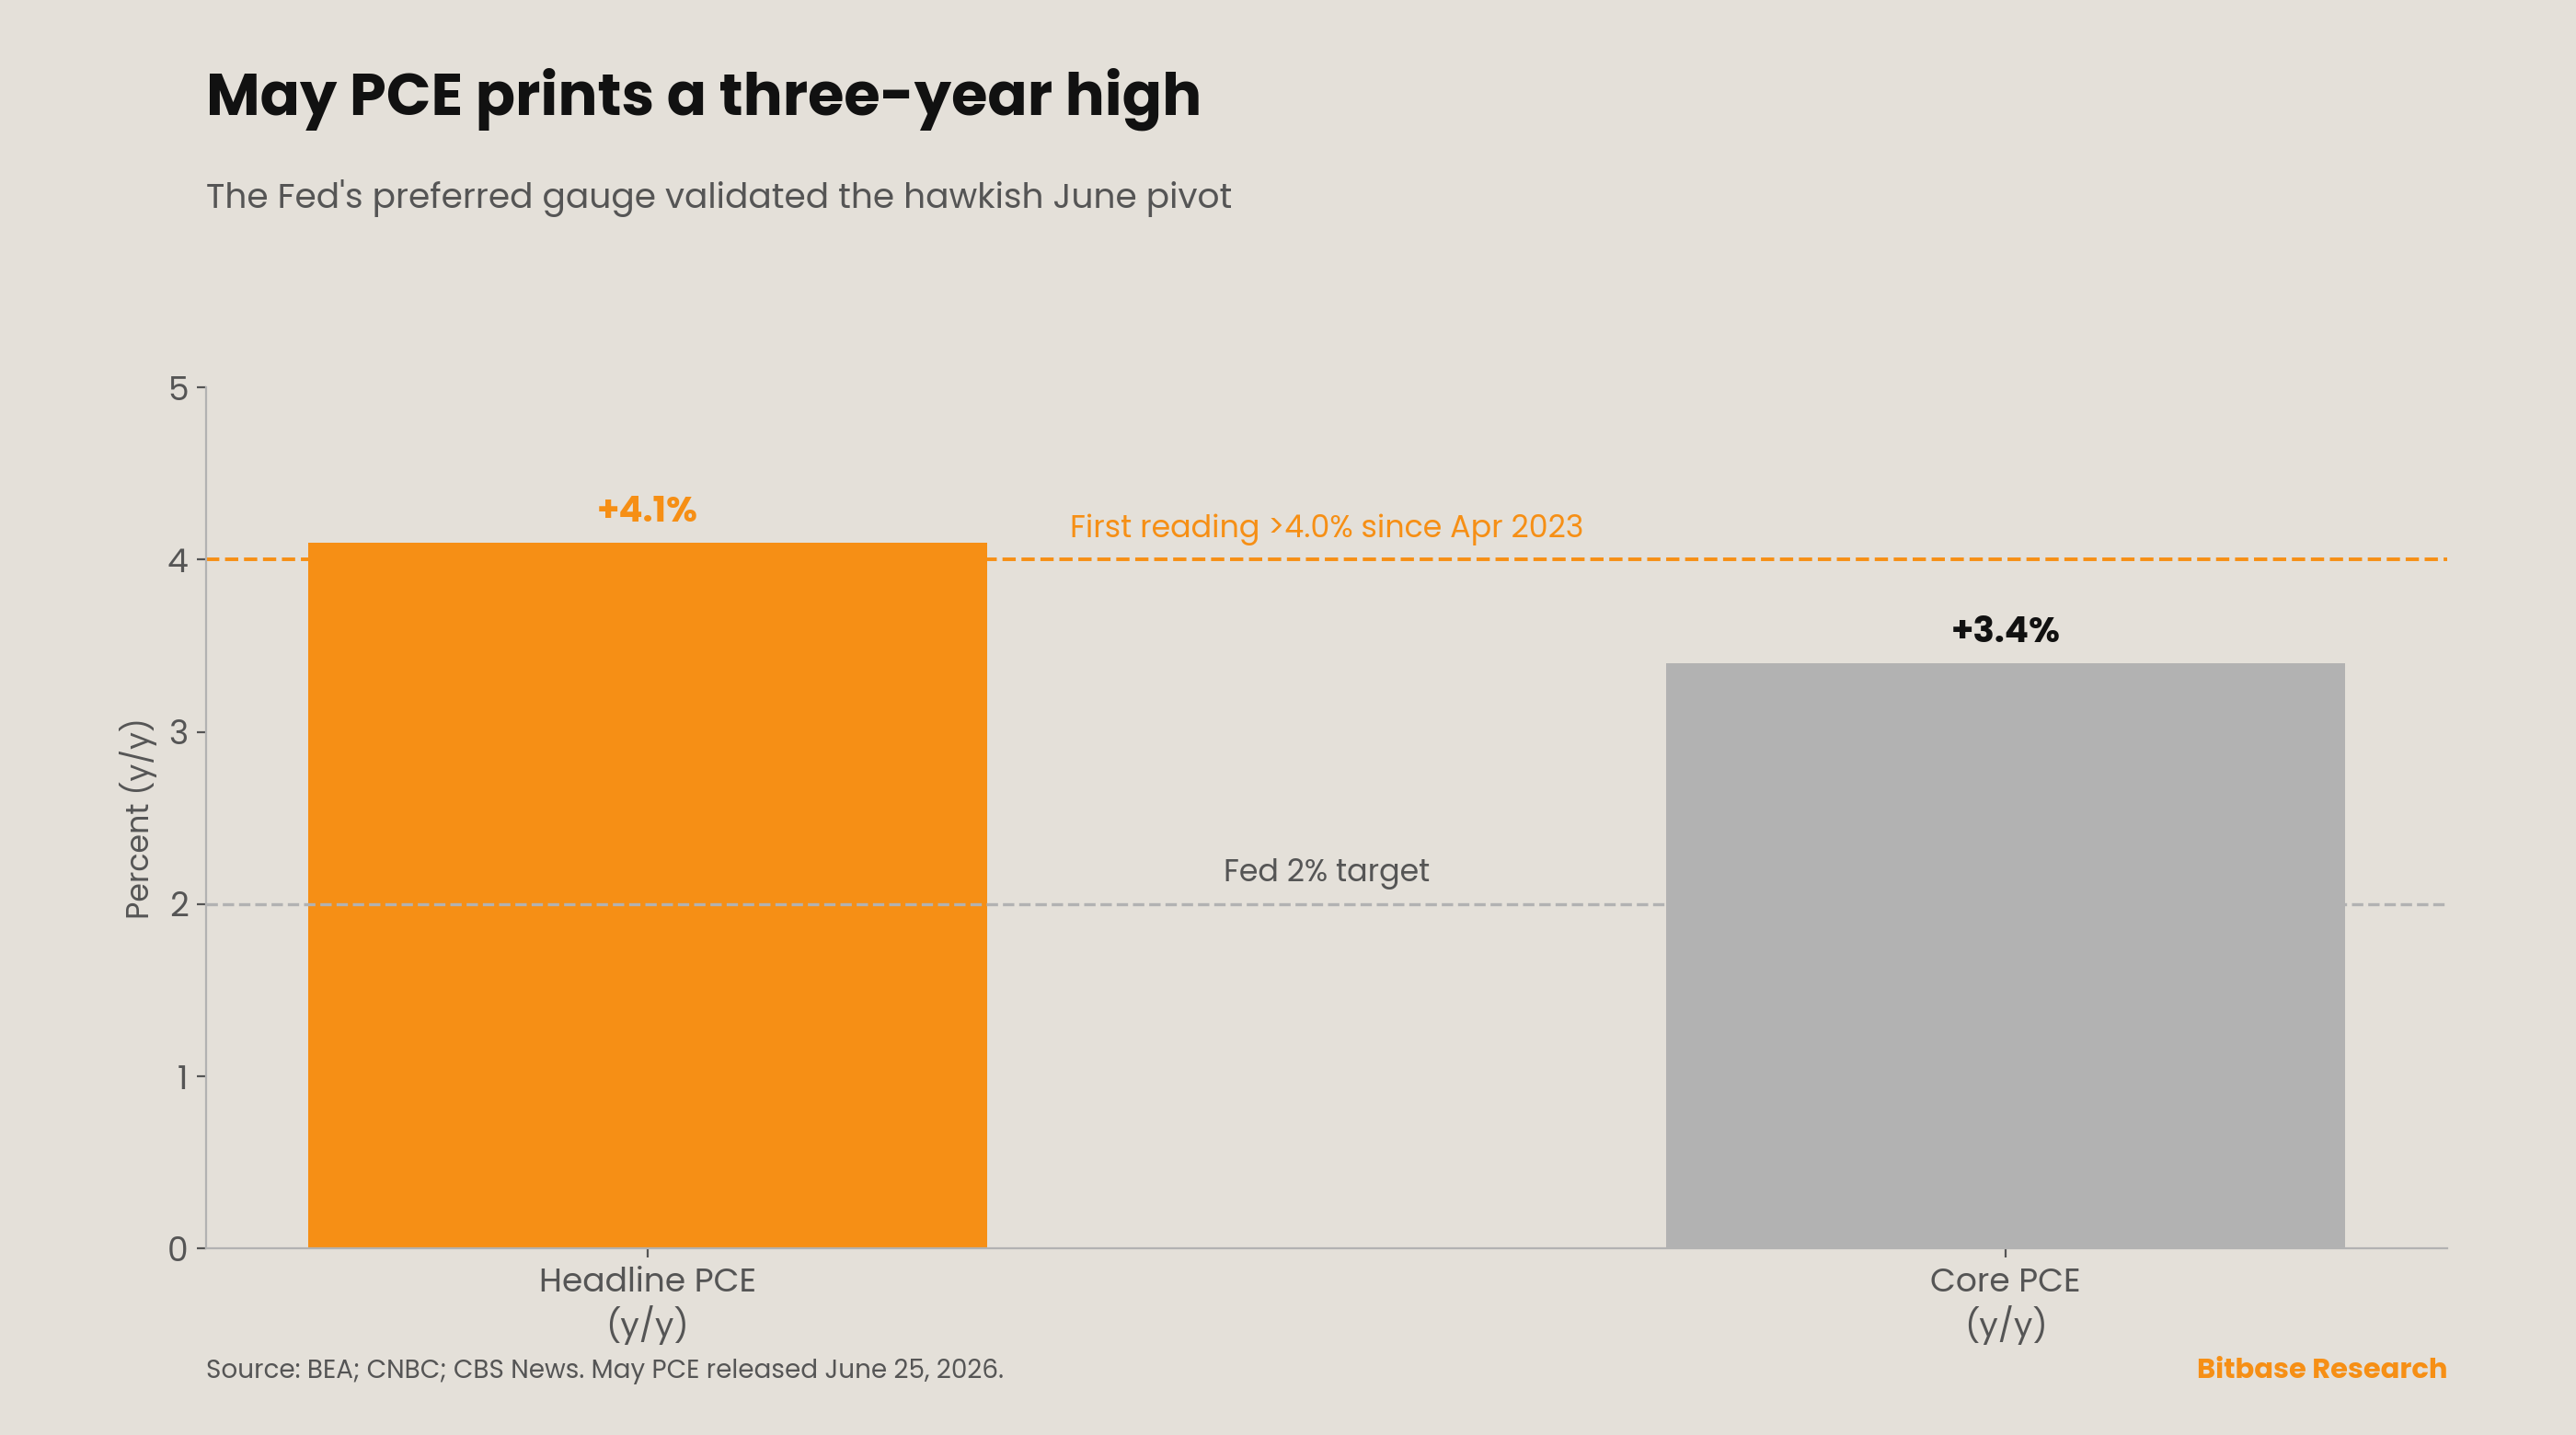
On June 25, 2026, the Bureau of Economic Analysis reported that the headline PCE price index rose +4.1% year over year in May, the first reading above 4.0% and the highest since April 2023; core PCE, the Fed's preferred gauge, rose +3.4%, the hottest since October 2023 (CNBC, CBS News) [5][6]. On a monthly basis headline PCE rose +0.4% and
core +0.3% [5]. Much of the pickup traced to the May spike in oil and gasoline during the US–Iran conflict—a driver that has since reversed (Section 6)—which framed the print as backward-looking even as it confirmed the year-on-year trend the June FOMC had projected. The number landed close to the roughly 4.1% economists had forecast, and because it was in
line rather than a fresh upside surprise, the immediate market reaction was muted: on June 26 the dollar index eased about 0.1% to roughly 101.3—still its highest in more than a year—the 2-year Treasury yield slipped to about 4.1%, and gold rose about 0.7% to roughly $4,029 as fears of an imminent hike were tempered (CNBC, TMGM) [8][9].
The interpretive split is worth reporting evenhandedly. To one camp, an in-line 4.1% with a softening oil input is the first sign that May was the peak of the inflation surge, which would make the hawkish dot plot early; to another, a core gauge at a three-year high with nine FOMC participants already projecting at least one hike leaves the
committee no room to ease, which keeps the dollar and front-end yields bid and the discount rate against the highest-beta non-yielding asset elevated. What is not in dispute is the transmission: through the week Bitcoin slid beneath the $60,000 floor to a roughly 20-month low near $60,256 on June 28, down about 4.5% on the week, with the 10-year yield
sticky near 4.45% and the dollar at a 13-month high [throughout][24]. Bitcoin did not fall because its own buyers exhausted; it fell because the rate environment against which it is valued stayed restrictive into a hot inflation print.
3. Dual-track scoreboard
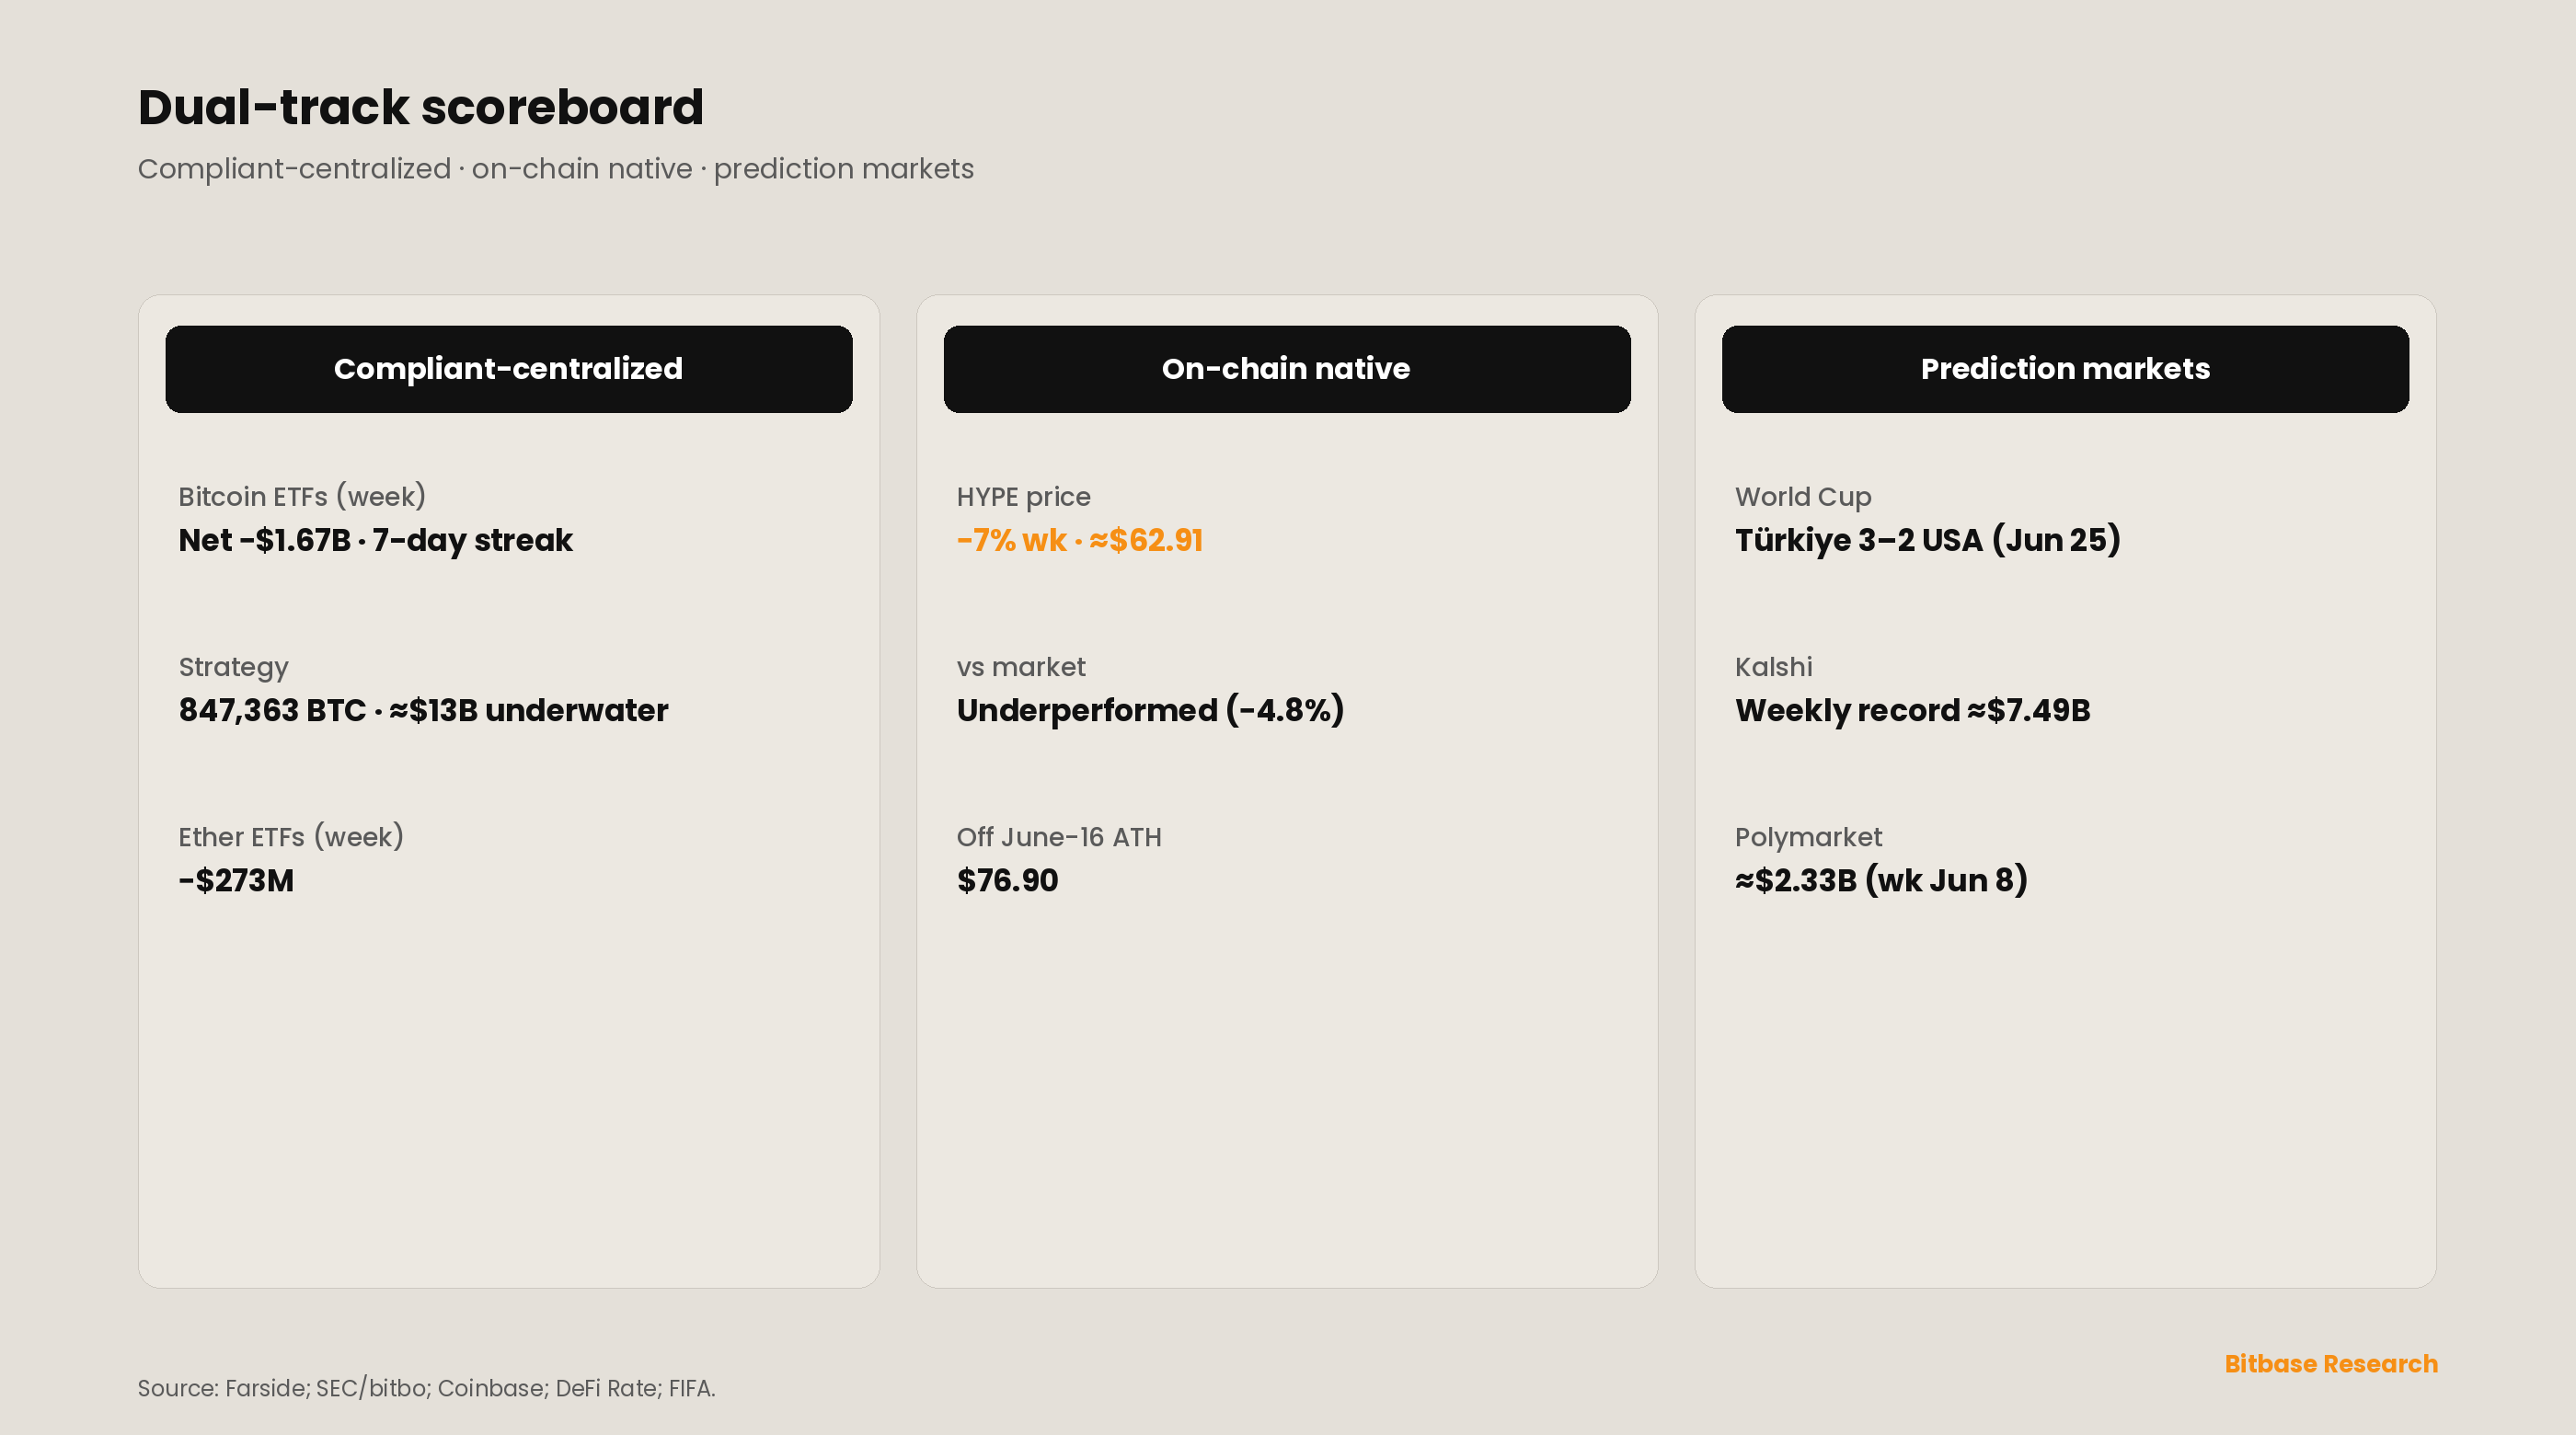
Compliant-centralized track. The one confirmation leg that has held since Issue 10 held again. As of its June 22 disclosure, Strategy's treasury stood at 847,363 BTC at an average cost of about $75,646, an aggregate of roughly $64.1 billion, an incremental addition of about 521 BTC over the 846,842 reported in Issue 11 [10][12]. With Bitcoin near $60,000, the position
sat roughly $13 billion underwater against that average, and the equity wrapper remained visibly stressed (The Block) [11]. (The exact size, average price, and purchase window of the latest buy are carried at lower precision pending the company's SEC Form 8-K for the June 15–21 period; the holdings total and average cost are the anchored figures.) The read is unchanged
from Issue 11: corporate-treasury conviction is intact—Strategy keeps buying below its cost basis—while the financing structure around it is under strain.
On-chain native track. This is where the week broke from the prior one. The decoupling Issue 11 flagged—HYPE printing an all-time high during a down week for the macro-tethered majors—did not repeat. HYPE traded near $62.91 and fell about 7% on the week, underperforming a broad crypto market down roughly 4.8% (Coinbase, CoinGecko) [13][14], well off the June 16 all-time
high near $76.90. The platform's structural footprint did not collapse—open interest remained in the billions and Hyperliquid's record share of global perpetual-futures open interest is a quarter-to-quarter story, not a one-week one—but the token's price tracked the majors lower rather than away from them. The distinction the series has always drawn applies: HYPE's price level is a token event, and
the perpetual-DEX signal tracks volume, not price (Section 5). What changed is the candidate dimension itself, addressed in Section 6.
Prediction-market third line. The line kept setting records into the window. Per DeFi Rate, Kalshi's weekly notional volume reached about $7.49 billion for the week of June 15, a fresh record that surpassed the roughly $6.38 billion of the week of June 8, with Polymarket trailing at about $2.33 billion [15]. The 2026 World Cup remained the proximate driver, and
the marquee in-window event resolved against the home side: on June 25, Türkiye beat the United States 3–2 at SoFi Stadium on Kaan Ayhan's final-kick winner, though the US had already clinched a Round-of-32 berth and advanced regardless (ESPN, NPR, FIFA) [16]. (The precise June 22–28 weekly notional is pending a Tier-1 print; the week-of-June-15 record is the latest anchored
figure.) The distributional question Issue 11 raised—Robinhood's routing of contracts to the CFTC-licensed Rothera—remains unmeasurable at the venue level.
4. On the radar—week of June 29 to July 5
Several scheduled events bear directly on the bottoming question, flagged as forward markers rather than reported facts.
June labor data (early July) and the path to June CPI (mid-July). With May PCE confirming the year-on-year trend, the labor print is the next read on whether the economy is cooling fast enough to loosen the rate constraint; June CPI in mid-July is the more decisive disinflation test.
A soft pair would be the first real crack in the constraint; a hot pair entrenches it.
Strategy's weekly purchase disclosure (expected Monday June 29). A further weekly purchase covering June 22–28 would extend the one confirmation leg that has held; watch SEC EDGAR for an 8-K.
The CLARITY Act and the July 4 deadline. With bipartisan talks fractured and the White House's July 4 target tight, whether the bill reaches a Senate floor vote before the August recess window closes is the binding legislative question (Section 5).
World Cup Round of 32. As the knockout stage opens with the United States through, the test is whether realized prediction-market volume continues to set records and whether Rothera volume becomes visible at the venue level.
The rate path and the dollar. The macro green light for the bottoming case is unchanged and specific: the 2-year yield back below roughly 4.0% and the dollar index back below 100, produced by a sustained disinflation sequence—sub-$80 oil (now in hand) plus a cooler June CPI. Until then, the rate constraint is the binding one.
5. Signal tracking update
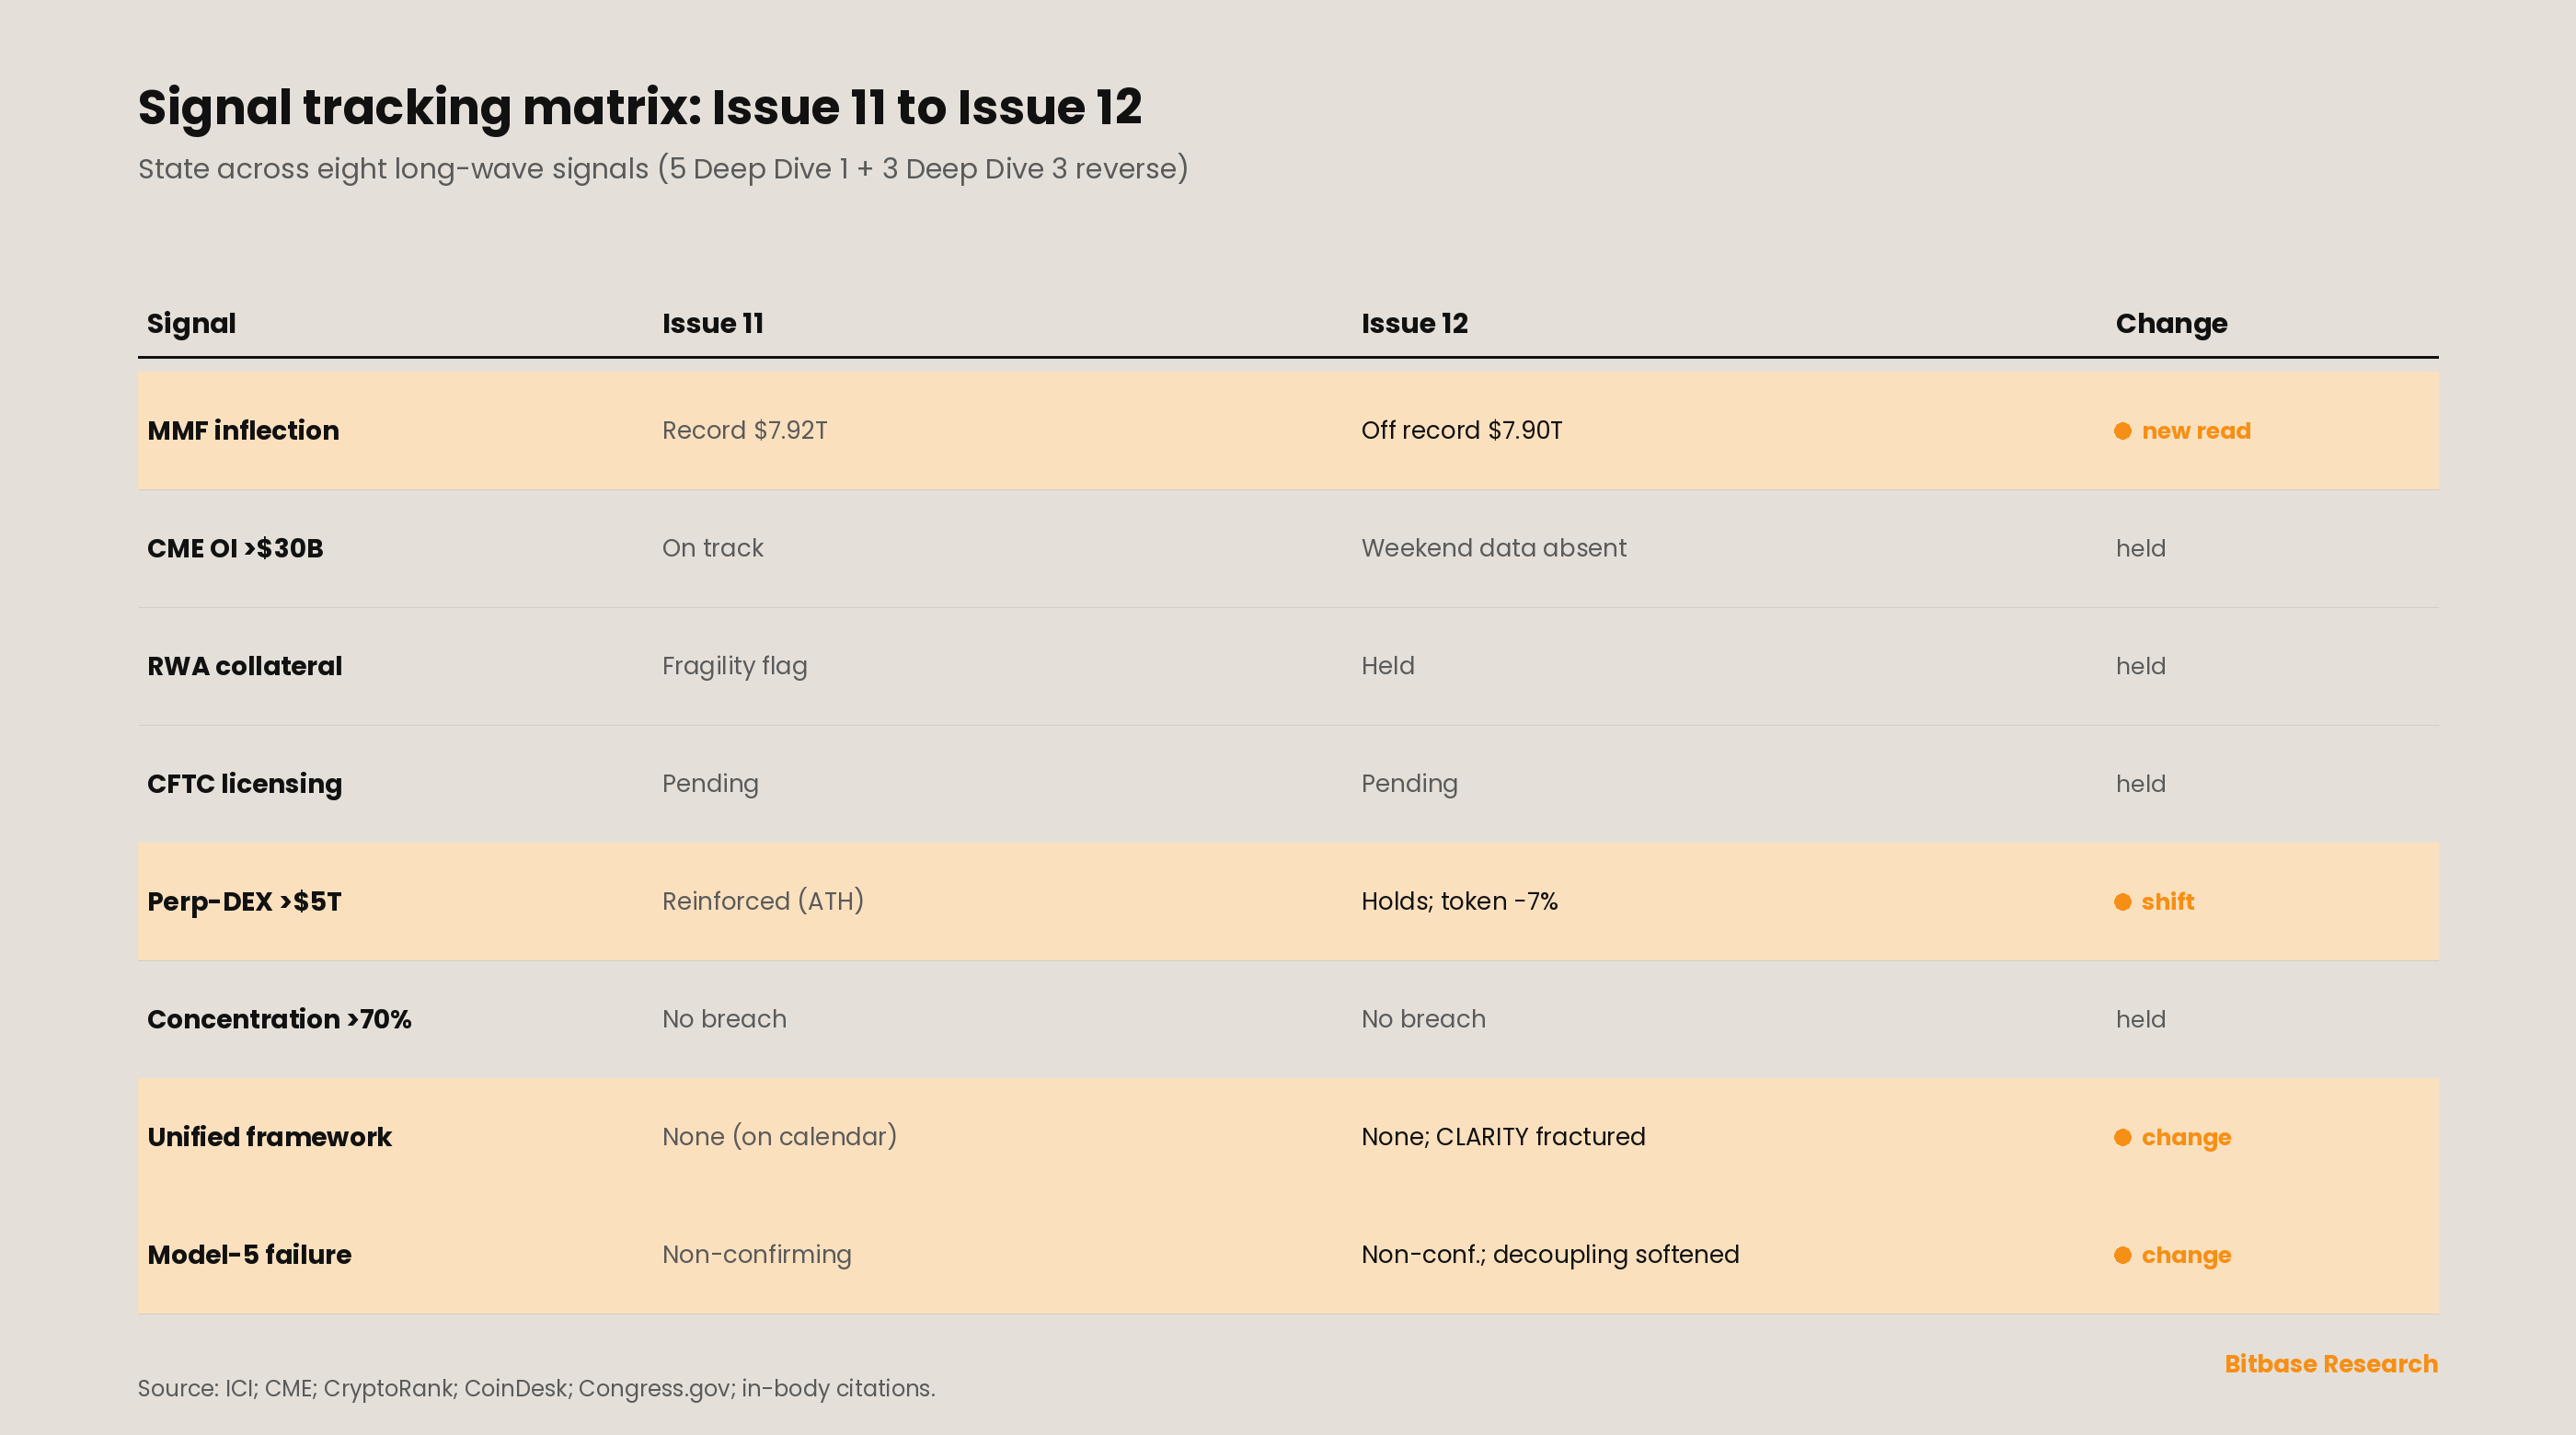
Five Deep Dive 1 signals plus three Deep Dive 3 reverse signals remain under continuous audit [19]. This issue records the money-market-fund signal ticking off its record, the regulatory-framework reverse signal absorbing a fractured CLARITY negotiation, and the perpetual-DEX signal holding on volume even as its bellwether token fell; the others hold their Issue 11 readings.
SIGNAL—Deep Dive 1 Part 1: "MMF asset scale inflection point." STATUS: Plateau; off the record, still no rotation. Per the Investment Company Institute, total money-market-fund assets fell $18.91 billion to $7.90 trillion for the week ended June 24 (released June 25), with government funds down $18.15 billion and prime funds down $1.06 billion [17]. The cash wall ticked back from
the prior week's record $7.92 trillion but did not rotate into risk assets—a marginal drawdown during a risk-off week is not the reallocation this signal tracks. The signal holds at "plateau."
SIGNAL—Deep Dive 1 Part 6: "Whether CME crypto derivatives OI persistently holds above $30B by 2027." STATUS: On track; weekend data still absent. No Tier-1 source published the standalone 24/7 crypto weekend volumes for any weekend after the inaugural one (May 30–June 1) in-window, the same gap flagged since Issue 10.
The signal stays on track against full-year data; the weekend prints remain the next observable evidence and the top microstructure watch into Issue 13 [20].
SIGNAL—Deep Dive 1 Parts 3 and 6: "Tokenized RWA as common collateral infrastructure." STATUS: Held. No new in-window event altered the reading: the broad RWA-perpetual infrastructure continues to deepen while the synthetic pre-IPO sub-layer carries the fragility qualifier Issue 11 attached. The signal holds.
SIGNAL—Deep Dive 1 Part 6: "Whether the U.S. CFTC approves more licensed entities to offer perpetual swap-style products by 2027." STATUS: Pending; tone unchanged. No new CFTC licensing action on perpetual-style products was confirmed in-window. The administrative track holds at pending.
SIGNAL—Deep Dive 1 Part 6: "Whether perpetual DEX annual trading volume holds above $5 trillion in 2026." STATUS: Holds on volume; token price fell. Hyperliquid's platform footprint—open interest in the billions and its record share of global perpetual-futures open interest—held, even as HYPE's price fell about 7% on the week (Section 3).
The signal tracks volume, not price: a token drawdown during a macro-driven risk-off week is not a signal-state change. The signal holds.
SIGNAL (Deep Dive 3 Reverse Signal A)—Market-share concentration above 70%. STATUS: No single-venue breach; concentration intensifying. Hyperliquid's dominance of decentralized perpetual-futures volume, Kalshi's dominance of US prediction-market activity, and IBIT's outsized share of Bitcoin-ETF flows all point to intensifying concentration within each rail, but no single venue breached the 70% threshold within its defined market in-window.
The five-model coexistence thesis holds.
SIGNAL (Deep Dive 3 Reverse Signal B)—Cross-architecture unified regulatory framework. STATUS: No unified framework; negotiation fractured.
The CLARITY Act's bipartisan negotiation split into two tracks, and a closed-door ethics meeting collapsed on June 9 without agreement; the bill remained on the Senate calendar without a floor vote in-window, with the White House's July 4 target described as tight (CoinDesk, Disruption Banking) [18][25]. No new ESMA, FCA, MAS, JFSA, BIS, or Basel coordination statement was issued.
The five-model regulatory divergence remains the state of record—now with a domestic legislative stall as the salient detail.
SIGNAL (Deep Dive 3 Reverse Signal C)—Model 5 regulatory failure. STATUS: Non-confirming (sustained), with a softened decoupling. The reverse signal positing regulatory failure for the on-chain-native model remains non-confirming: the track kept functioning through a risk-off week with no regulatory-failure event.
The qualifier this issue adds is that the on-chain-native bellwether underperformed rather than diverged (Sections 3 and 6)—a market-behavior observation, not a state change.
6. New dimension—when the rate constraint binds, the on-chain-native track re-couples
Issue 11 closed by flagging a candidate standing dimension: in a week when the macro-tethered majors fell on rate repricing, HYPE printed a record, and the open question was how far crypto-native flows could decouple from rate-driven majors, and for how long. This week answered the "how long" with "not through a hot PCE print."
HYPE fell about 7% and underperformed the broad market, tracking the majors lower rather than away from them, even as its platform fundamentals—fee-buyback mechanics, perpetual-DEX share, open interest—stayed intact.
The methodological contribution is therefore a boundary condition on the decoupling thesis: idiosyncratic, non-macro demand can express itself on the on-chain-native track when the rate constraint is moderate, but when the constraint binds hard—an inflation print at a three-year high, a dollar at a 13-month high, a decisive ETF-outflow streak—the whole complex re-couples, on-chain-native included.
That leaves the bottoming question where Issue 11 placed it, only firmer: gated by the macro rate path, and now tested against the floor itself. The two confirmation legs that held this week—corporate-treasury demand (Strategy, still buying) and the oil-and-disinflation leg (Brent down more than 10% on the week toward $72, its lowest since February, as Strait of Hormuz traffic
recovered toward 75% of pre-war levels [21])—are real, but they cannot overpower a Fed that has removed the easing option while inflation prints at a three-year high. The decisive demand leg, ETF inflows, stayed negative for a third straight week. A coherent statement of the bottoming case remains conditional and unchanged in shape from Issue 11: it requires a 60-to-90-day
disinflation sequence—sustained sub-$80 oil (now in hand), a cooler June CPI in mid-July, and a less-hawkish set of September dots—to loosen the rate constraint and let ETF demand re-engage. Until that sequence prints, the early-June low near $59,000 is now an actively tested support rather than a confirmed floor, and the macro green light is observable and specific: the 2-year
yield back below roughly 4.0% and the dollar index back below 100.
Caveats
Date integrity. TradFi data anchors to end-of-day Friday June 26 (ET); crypto-native data extends through Sunday June 28. The May PCE release (June 25) is in-window. Strategy's holdings total reflects its June 22 disclosure; the underlying purchase period for the latest addition is not yet confirmed by an in-window 8-K.
June labor data, June CPI, and the World Cup Round of 32 fall after this window.
Verification status. The load-bearing figures—the May PCE prints; the market transmission (dollar, 2-year and 10-year yields, gold); the spot Bitcoin and Ether ETF weekly totals and the June 26 session; Strategy's holdings and average cost; the ICI money-market-fund figure; Brent's weekly move; and the United States–Türkiye result—have been traced to primary or named Tier-1 sources.
Figures carried at lower precision are noted in-line.
Data-caliber conflicts and gaps flagged. The exact Sunday June 28 Bitcoin close is given as approximately $60,256 (per end-of-week reads) pending a final spot print; the weekly path is stated in ranges accordingly. HYPE's exact weekly close and open-interest level vary by tracker; the ~7% weekly move and underperformance versus the market are the anchored facts. Core-PCE phrasing follows BEA/CNBC;
some outlets emphasize the headline 4.1%, others core 3.4%.
Genuinely unavailable as of June 29, 2026: the full day-by-day spot-Bitcoin-ETF series for June 22–25; the exact size, price, and window of Strategy's latest purchase pending its 8-K; precise June 22–28 prediction-market weekly notional; standalone CME 24/7 weekend crypto volumes for any weekend after the inaugural one.
Source attribution. US spot Bitcoin and Ether ETF flow figures are Farside Investors and aggregators as cited, subject to T+1 revision and not issuer-direct; Strategy holdings are from the company's disclosures as reported; PCE figures are from the BEA release as reported by named outlets; market levels are per named Tier-1 financial outlets.
Causation discipline. All causal attributions—the rate environment driving Bitcoin lower, ETF holders responding to the dollar and yields, oil driving the disinflation path, HYPE re-coupling under a binding rate constraint—reflect the cited outlets' framing and named analysts' reasoning, not independent Bitbase inference.
This is not investment advice. Bitbase Research does not make price predictions or recommend positions; third-party forecasts and analyst views referenced here are reported as named analysts' views, not adopted. Figures are anchored to end-of-day Friday June 26 (ET) for TradFi and Sunday June 28 for crypto-native data unless otherwise stated.
References
[1] Farside Investors, "Bitcoin ETF Flow (US$m)," accessed June 29, 2026. Daily and weekly US spot Bitcoin ETF net flows; June 26 ≈ −$445M (IBIT-led). https://farside.co.uk/btc/
[2] Bitcoin Foundation, "Bitcoin ETF Outflows June 2026: $1.67B Weekly," June 2026. Third consecutive week of net outflows; ~$4.21B over three weeks. https://bitcoinfoundation.org/news/crypto-etfs-news/crypto-etfs-june/
[3] TFTC, "Bitcoin ETFs Shed $7B Across Two Record Outflow Streaks in 2026," June 2026. May 15–June 3 13-day streak ~$4.4B; two streaks combined ~$7.2B. https://www.tftc.io/bitcoin-etf-outflows-2026-record-streaks/
[4] CryptoRank, "US Spot Ethereum ETFs Extend Outflow Streak to Seven Days," June 2026. Weekly ETH ≈ −$273M; June 22 ≈ −$66.1M (ETHA); June 26 ≈ −$12.8M. https://cryptorank.io/news/feed/3c708-us-spot-ethereum-etfs-outflow-streak-2
[5] CNBC, "PCE inflation report May 2026," June 25, 2026. Headline PCE +4.1% y/y (first >4.0% since Apr 2023); core +3.4%; MoM +0.4%/+0.3%. https://www.cnbc.com/2026/06/25/pce-inflation-report-may-2026-.html
[6] CBS News, "The Fed's preferred inflation gauge shows prices rising at fastest pace in 3 years," June 25, 2026. https://www.cbsnews.com/news/pce-report-report-may-2026-federal-reserve-inflation/
[7] Yahoo Finance, "PCE report: Fed's preferred inflation measure hits 3-year high," June 25, 2026. Keeps rate-hike talk in play. https://finance.yahoo.com/economy/policy/article/pce-report-feds-preferred-inflation-measure-hits-3-year-high-keeping-talk-of-possible-rate-hike-in-play-124158491.html
[8] CNBC, "Gold rises as inflation data sends dollar, yields lower," June 25, 2026. June 26 dollar/yields eased on in-line PCE. https://www.cnbc.com/2026/06/25/gold-languishes-near-7-month-low-as-fed-tightening-bets-boost-dollar.html
[9] TMGM, "Gold price rebounds as falling US yields weigh on US Dollar," June 26, 2026. Gold +0.7% ≈ $4,029; DXY ≈ 101.3; 2Y ≈ 4.1%. https://www.tmgm.com/en/analysis/market-news/article/gold-price-rebounds-as-falling-us-yields-weigh-on-us-dollar-202606261935
[10] bitbo, "Strategy (MicroStrategy) Bitcoin Holdings," accessed June 29, 2026. 847,363 BTC at avg ≈ $75,646; aggregate ≈ $64.1B (June 22 disclosure). https://bitbo.io/treasuries/microstrategy/
[11] The Block, "Michael Saylor signals another bitcoin buy as Strategy sits about $13 billion underwater," June 2026. https://www.theblock.co/post/406460/michael-saylor-signals-another-bitcoin-buy-as-strategy-sits-about-13-billion-underwater
[12] Yahoo Finance, "MicroStrategy Buys Bitcoin 2 Weeks After Selling," June 2026. Strategy's buy cadence and treasury context. https://finance.yahoo.com/markets/crypto/articles/microstrategy-buys-bitcoin-2-weeks-122701010.html
[13] Coinbase, "Hyperliquid (HYPE) Price," accessed June 29, 2026. HYPE ≈ $62.91; off the June 16 ATH ≈ $76.90. https://www.coinbase.com/price/hyperliquid
[14] CoinGecko, "Hyperliquid (HYPE) Price," accessed June 29, 2026. ~−7% week over week; underperformed market (~−4.8%). https://www.coingecko.com/en/coins/hyperliquid
[15] DeFi Rate, "Kalshi Crosses $100B Lifetime as World Cup Drives Daily Volume Over $1B," June 2026. Kalshi week of June 15 ≈ $7.49B (record); Polymarket ≈ $2.33B (week of June 8). https://defirate.com/news/kalshi-crosses-100b-lifetime-world-cup-drives-daily-volume-over-1b/
[16] ESPN; NPR; FIFA, "Türkiye 3-2 USA," June 25, 2026. Türkiye 3–2 United States at SoFi Stadium (Kaan Ayhan late winner); US clinched Round of 32. https://www.espn.com/soccer/match/_/gameId/760470/united-states-turkiye
[17] Investment Company Institute, "Money Market Fund Assets," June 25, 2026. Total MMF assets −$18.91B to $7.90T (week ended June 24); gov −$18.15B, prime −$1.06B. https://www.ici.org/research/stats/mmf
[18] CoinDesk, "Clarity Act survival depends on the U.S. Senate getting a lot of non-crypto work done," June 2, 2026; and Disruption Banking, June 23, 2026. Bipartisan talks fractured; ethics meeting collapsed June 9; July 4 target tight. https://www.coindesk.com/news-analysis/2026/06/02/clarity-act-survival-depends-on-the-u-s-senate-getting-a-lot-of-non-crypto-work-done
[19] Bitbase Research, "Deep Dive 1" (five signals) and "Deep Dive 3" (three reverse signals). Signal framework referenced in Section 5.
[20] CME Group, "CME Group Announces Launch of 24/7 Cryptocurrency Futures and Options Trading," June 1, 2026. Inaugural weekend May 30–June 1; subsequent standalone weekend volumes unpublished. https://www.cmegroup.com/
[21] Trading Economics, "Brent crude oil," June 26, 2026. Brent ≈ $72 (lowest since Feb 27), weekly decline >10%; Strait of Hormuz traffic toward 75% of pre-war levels. https://tradingeconomics.com/commodity/brent-crude-oil
[22] Bitbase Research, "Market Insights — Issue 11," June 22, 2026. Prior-week framework: hawkish hold; ETF inflows rejected; the macro rate path as gating variable; HYPE's record and the candidate decoupling dimension.
[23] U.S. Bureau of Economic Analysis, "Personal Consumption Expenditures Price Index," May 2026 release (June 25, 2026). Primary source for PCE figures. https://www.bea.gov/data/personal-consumption-expenditures-price-index
[24] investingLive, "Bitcoin analysis over the weekend, 28 June 2026," June 28, 2026. BTC broke the $60,000 floor to a ~20-month low; ≈ $60,256; ~−4.5% week over week. https://investinglive.com/Cryptocurrency/bitcoin-analysis-over-the-weekend-28-june-2026-20260628/
[25] Congress.gov, "H.R.3633 — Digital Asset Market Clarity Act," accessed June 29, 2026. Senate calendar status; no floor vote in-window. https://www.congress.gov/bill/119th-congress/house-bill/3633/text