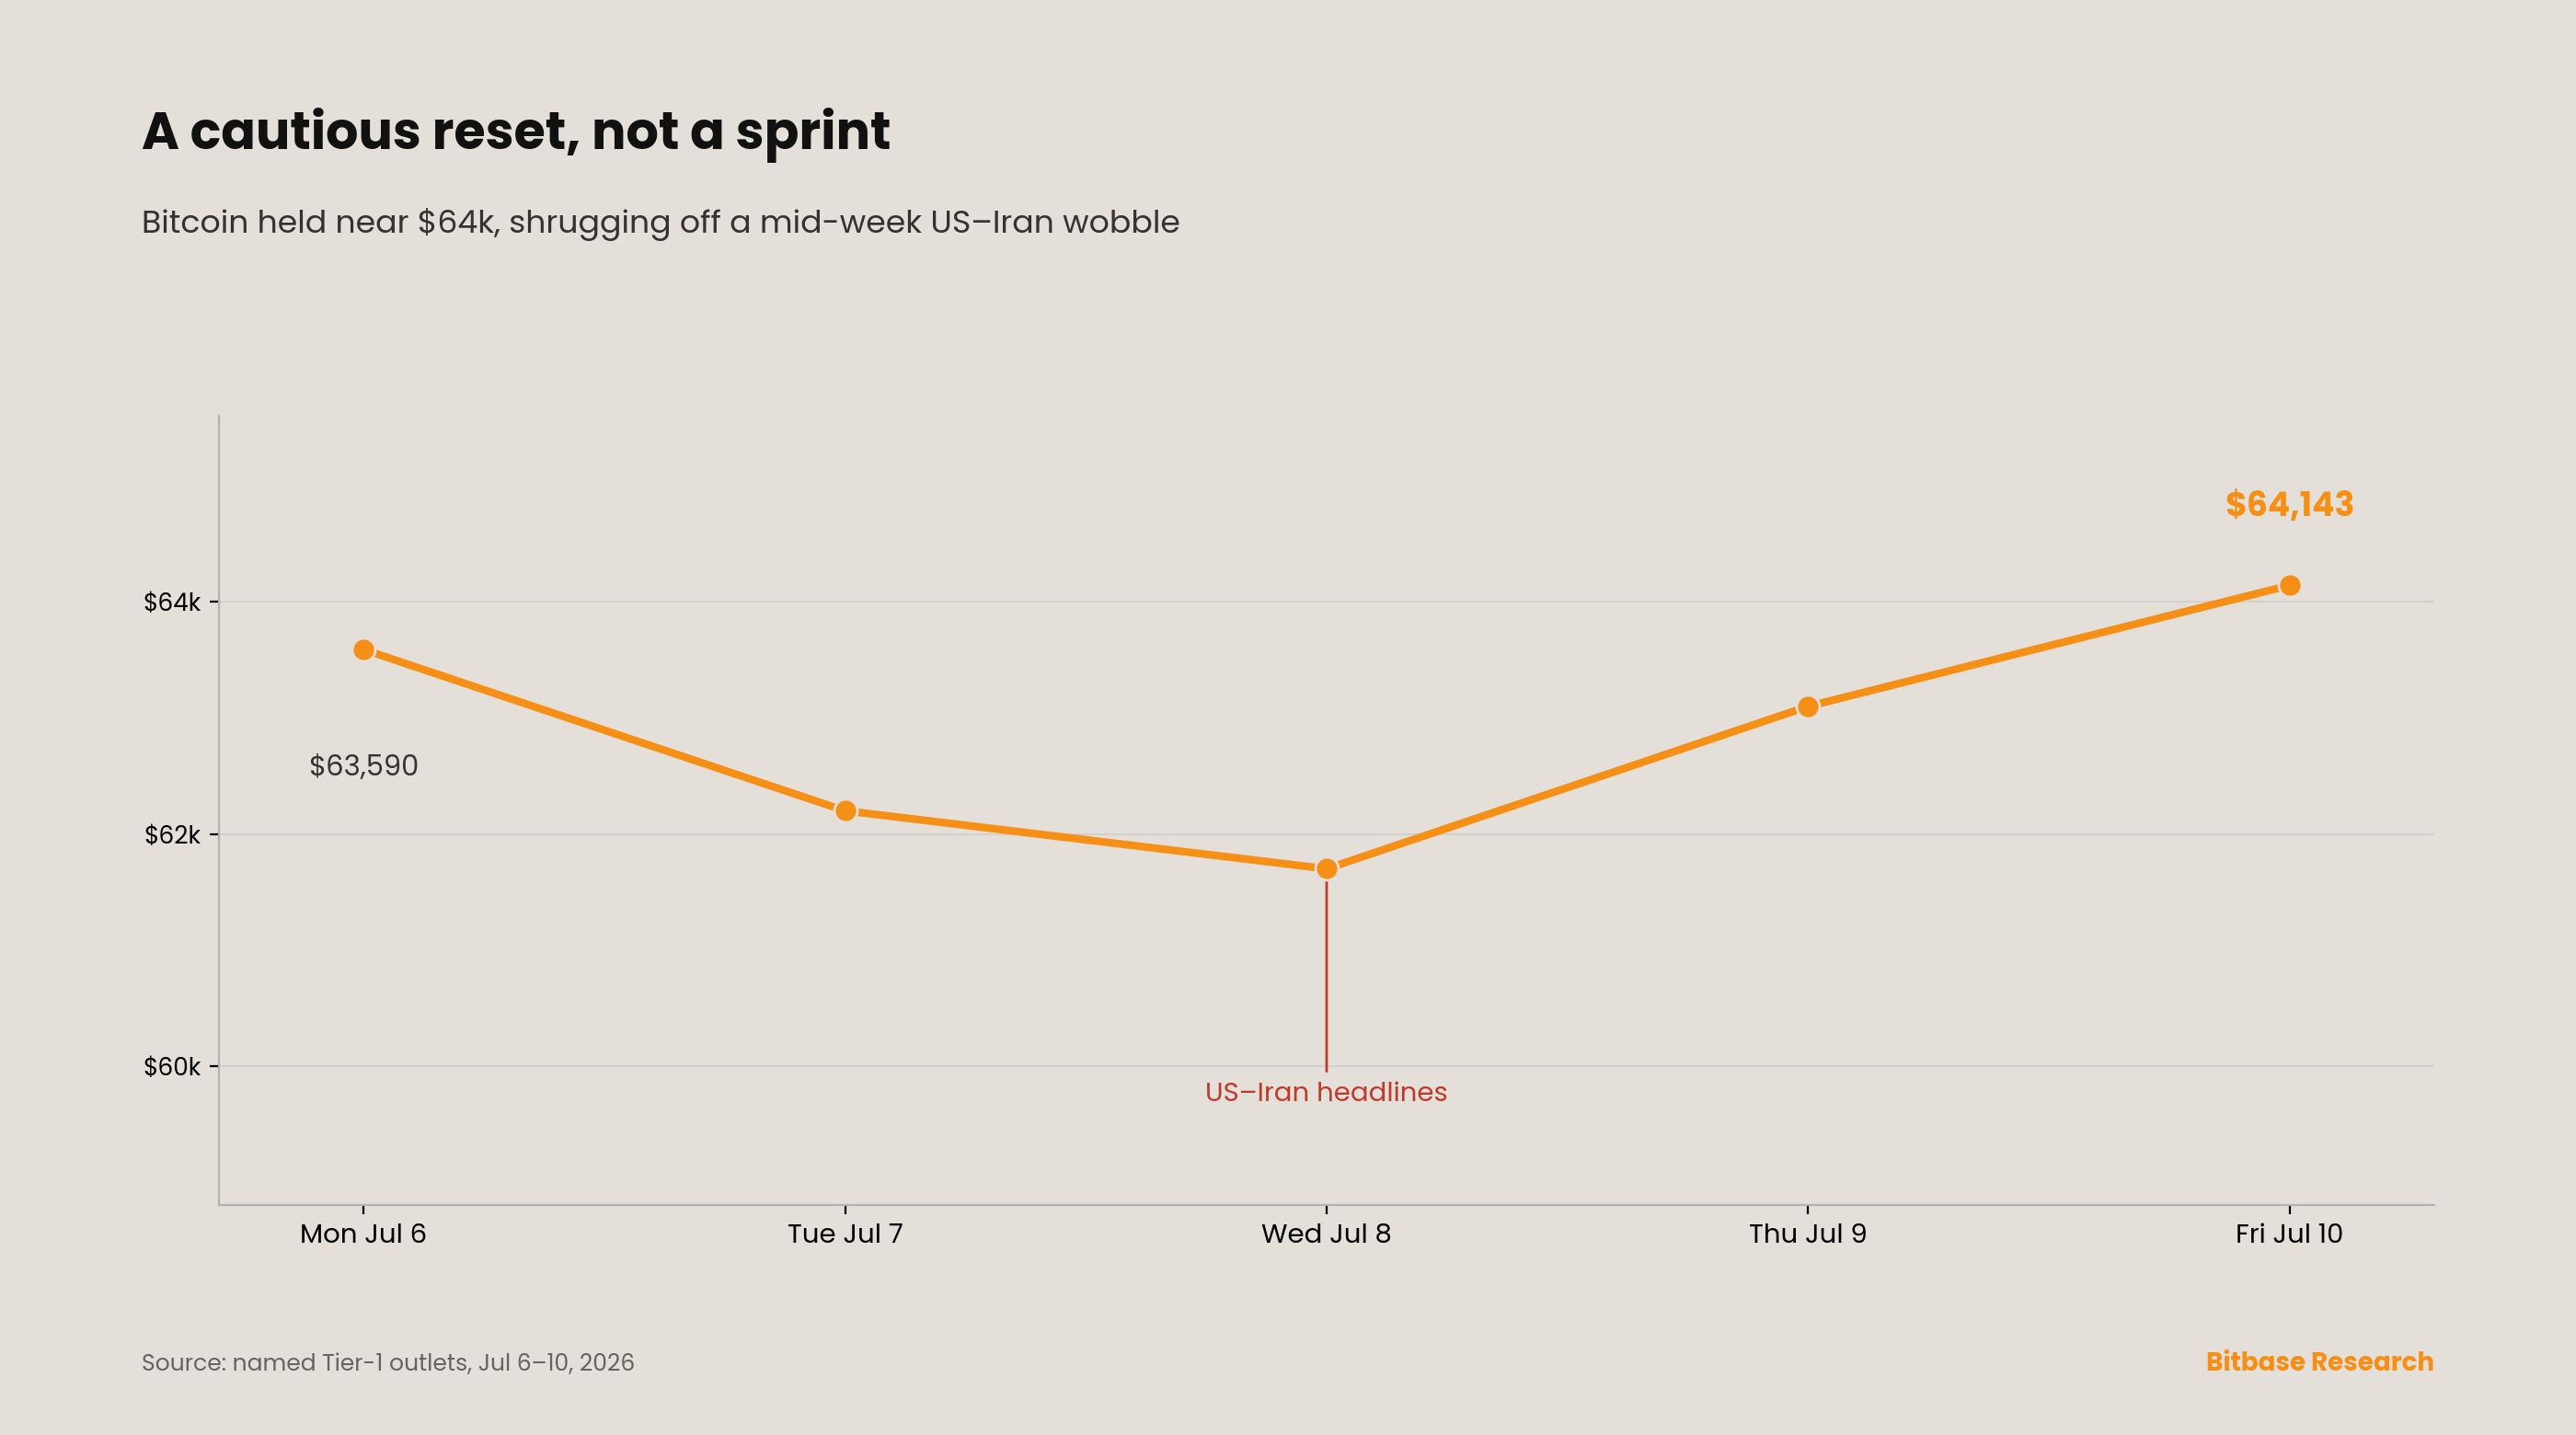
The turn that cracked in Issue 13 swung open this week—on one side. The demand vacuum that defined the June lows kept filling, and this time it broadened. After the roughly ten-day, ~$2.7 billion spot-Bitcoin-ETF outflow streak snapped on July 2, inflows did not merely reappear; they widened and the bellwether came back. BlackRock's IBIT logged its first green session in twelve on July 7 with about $54.45 million, and the complex built to roughly $510 million over three sessions into July 9 with IBIT—not Fidelity's FBTC or ARK's ARKB, the funds that had carried June's rare green days—back at the front of the tape. That is the confirmation the flow signal had been missing. Bitcoin held the footing: it opened the week near $63,590, dipped toward $61,700 as headlines around US–Iran strikes briefly pressured risk mid-week, and recovered to close near $64,143 on July 10, up about 2.8%, with Ether up roughly 2.7%—a cautious reset, not a risk-on sprint, inside a June-13-to-July-13 band that ran from about $57,830 to $67,280. But the same week took a hinge off the other side. The corporate-treasury bid did not merely halt: Strategy disclosed the sale of 3,588 BTC for about $216 million—the first bitcoin sale in the company's history—cutting its position to 843,775 BTC to fund preferred-stock dividends. The demand side confirmed; the confirmation leg reversed. The door is open, and the marginal buyer walking through it is no longer the one the market had learned to lean on.
Week of July 6 to July 12, 2026
Bitbase Research · July 13, 2026
The one chart that matters
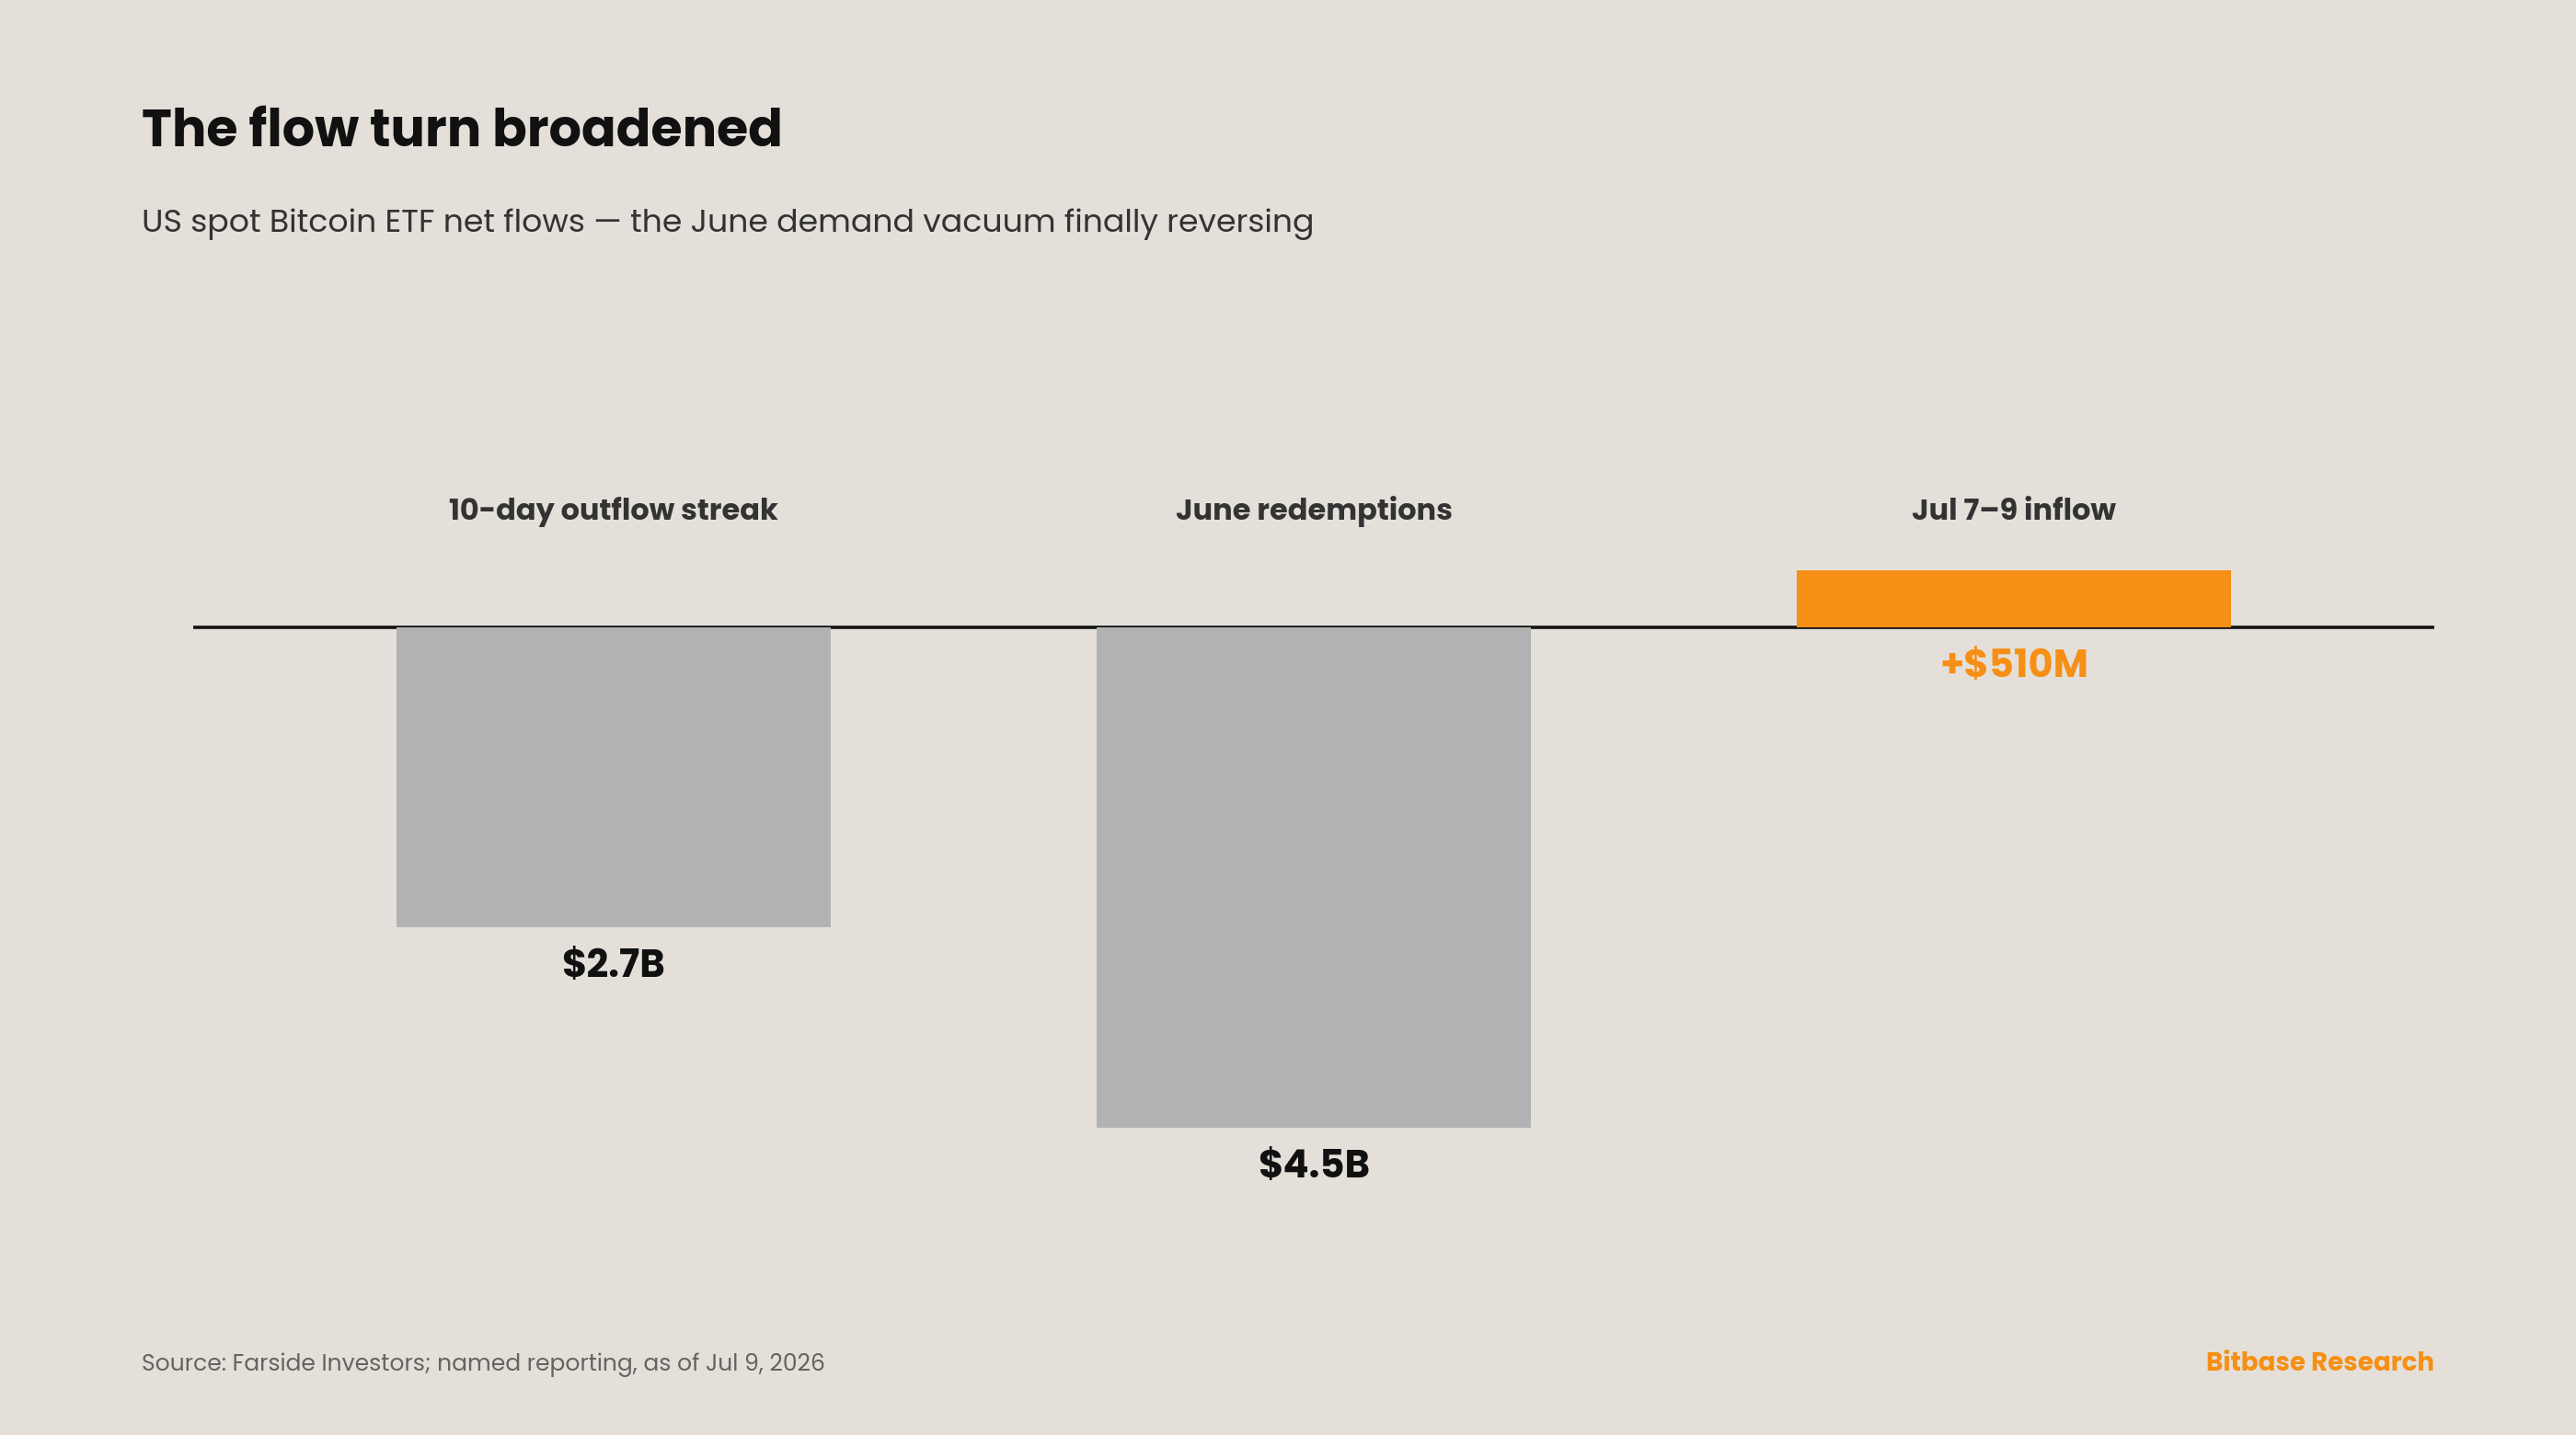
The most legible development of the week is that the flow reversal held and widened. Issue 13 could only report the streak's end—one green session on July 2 against a still-negative four-day tape. This week the follow-through arrived: the complex printed a net positive on July 7 of roughly $21 million, with BlackRock's IBIT taking in about $54.45 million—its first inflow after eleven consecutive red days—and the next sessions built on it, with about $510 million flowing in over three days into July 9 as IBIT resumed its place at the front of the tape [1][2]. That last detail is the signal, not the headline number. Through the June drawdown the scarce green days had been carried by FBTC and ARKB while IBIT bled; a durable turn needs the largest fund—the one whose creations and redemptions set the tone for the category—leading rather than lagging, and for the first time since the spring it did [2]. The caveat is scale, and it is a real one. Year-to-date net flows for the US spot-Bitcoin-ETF complex remain roughly $5.4 billion in the red, and June still stands as the worst month on record near $4.5 billion of redemptions; a few hundred million over a handful of sessions does not reverse that [3]. But direction precedes magnitude. For the first time since late April, the marginal ETF dollar is being added rather than withdrawn—and it is being added by the fund that leads, which is what separates a bounce from a bottom.
This week's structural signal
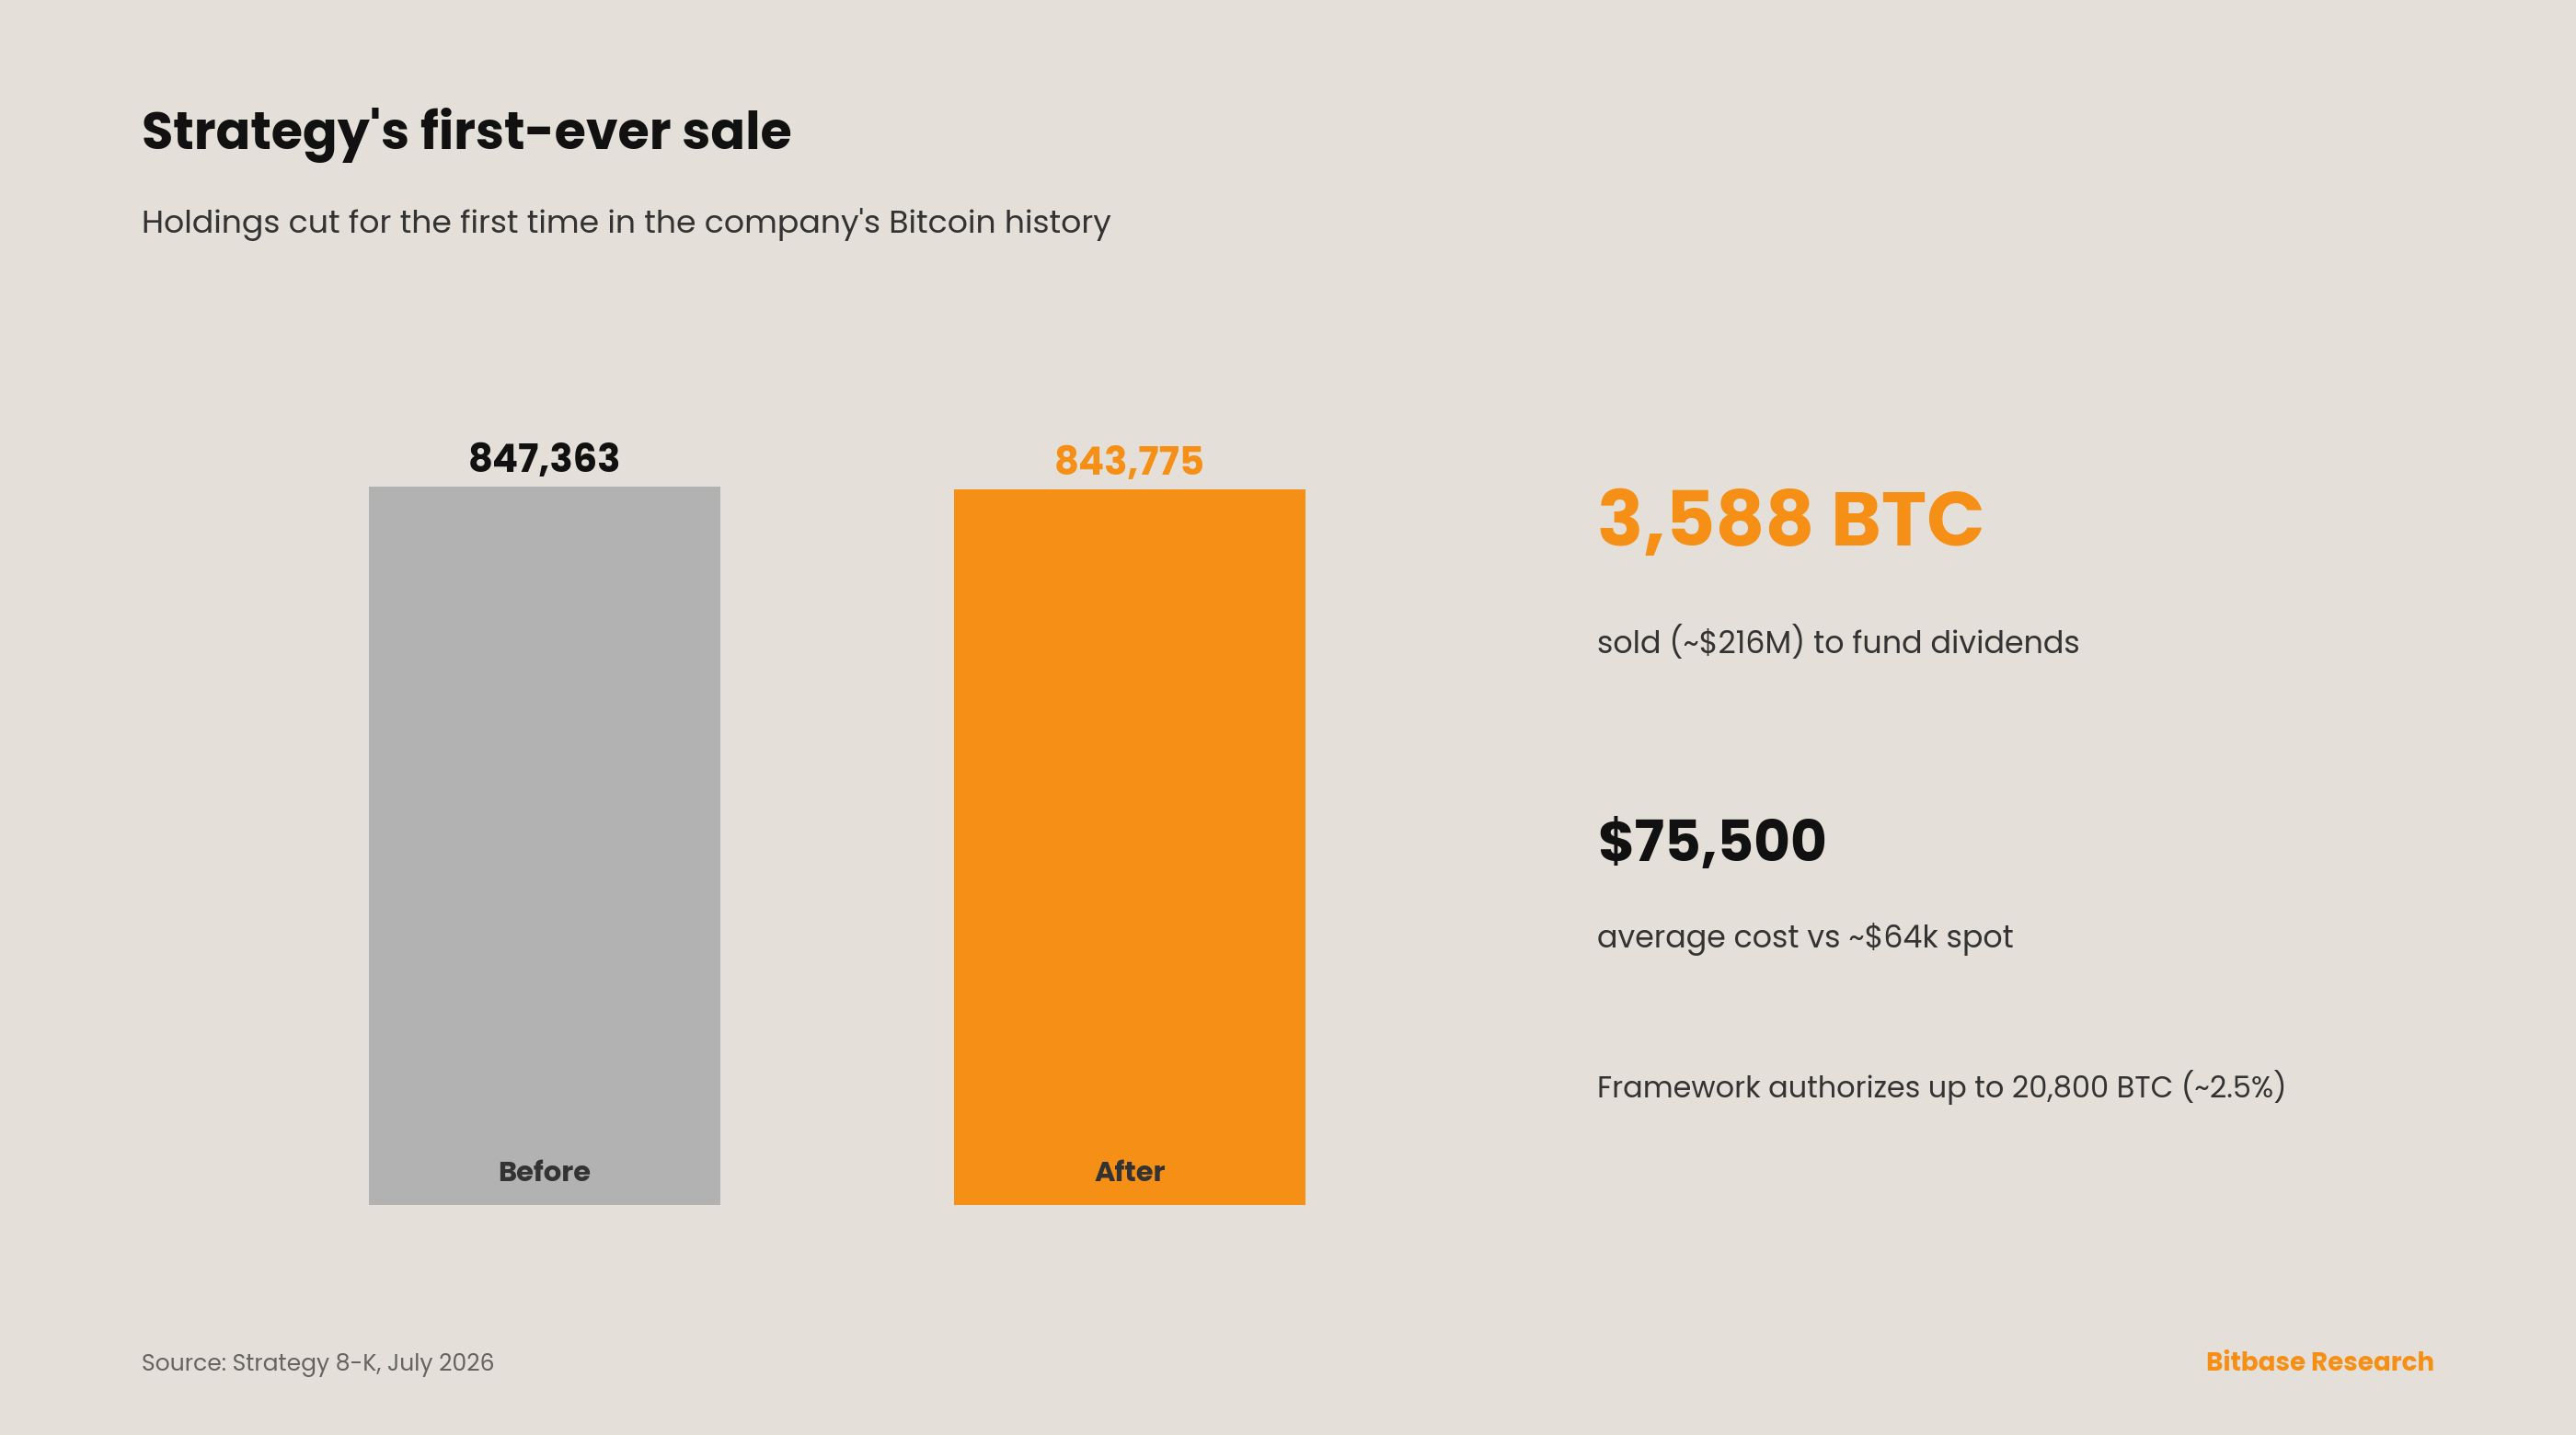
Issue 13's structural signal was the authorization; this week's is the execution—and the two are not the same event. Strategy's disclosure confirmed the company sold 3,588 BTC for approximately $216 million over the June 29–July 5 window, the first sale of bitcoin in its treasury history, carried out under the "Digital Credit Capital Framework" the board approved the prior week to fund preferred-stock dividends [4][5]. Holdings fell to 843,775 BTC from 847,363, at an average cost near $75,500 against an aggregate basis around $63.7 billion, and the quarter closed with a roughly $8.32 billion loss on digital assets for the three months ending June 30 [4][6]. The framework is broader than a single sale: it establishes a USD reserve on the order of $2.55 billion, authorizes up to about $1 billion of MSTR buybacks, and permits monetizing up to roughly 20,800 BTC—about 2.5% of the position. The dollar amounts are small against a holding of that size, and MSTR shares actually firmed on the news as the market read a dividend-funding trim as manageable rather than existential. But the direction is the whole point. For four years the reliable, price-insensitive bid beneath this market was a corporate treasury that bought on a cadence and never sold; that posture is now formally retired and a selling mechanism is live and used. The read the series has carried since Issue 10 has to change: corporate-treasury conviction is no longer a confirmation leg. It is a two-way variable, and this week it printed negative for the first time.
Dual-track scoreboard
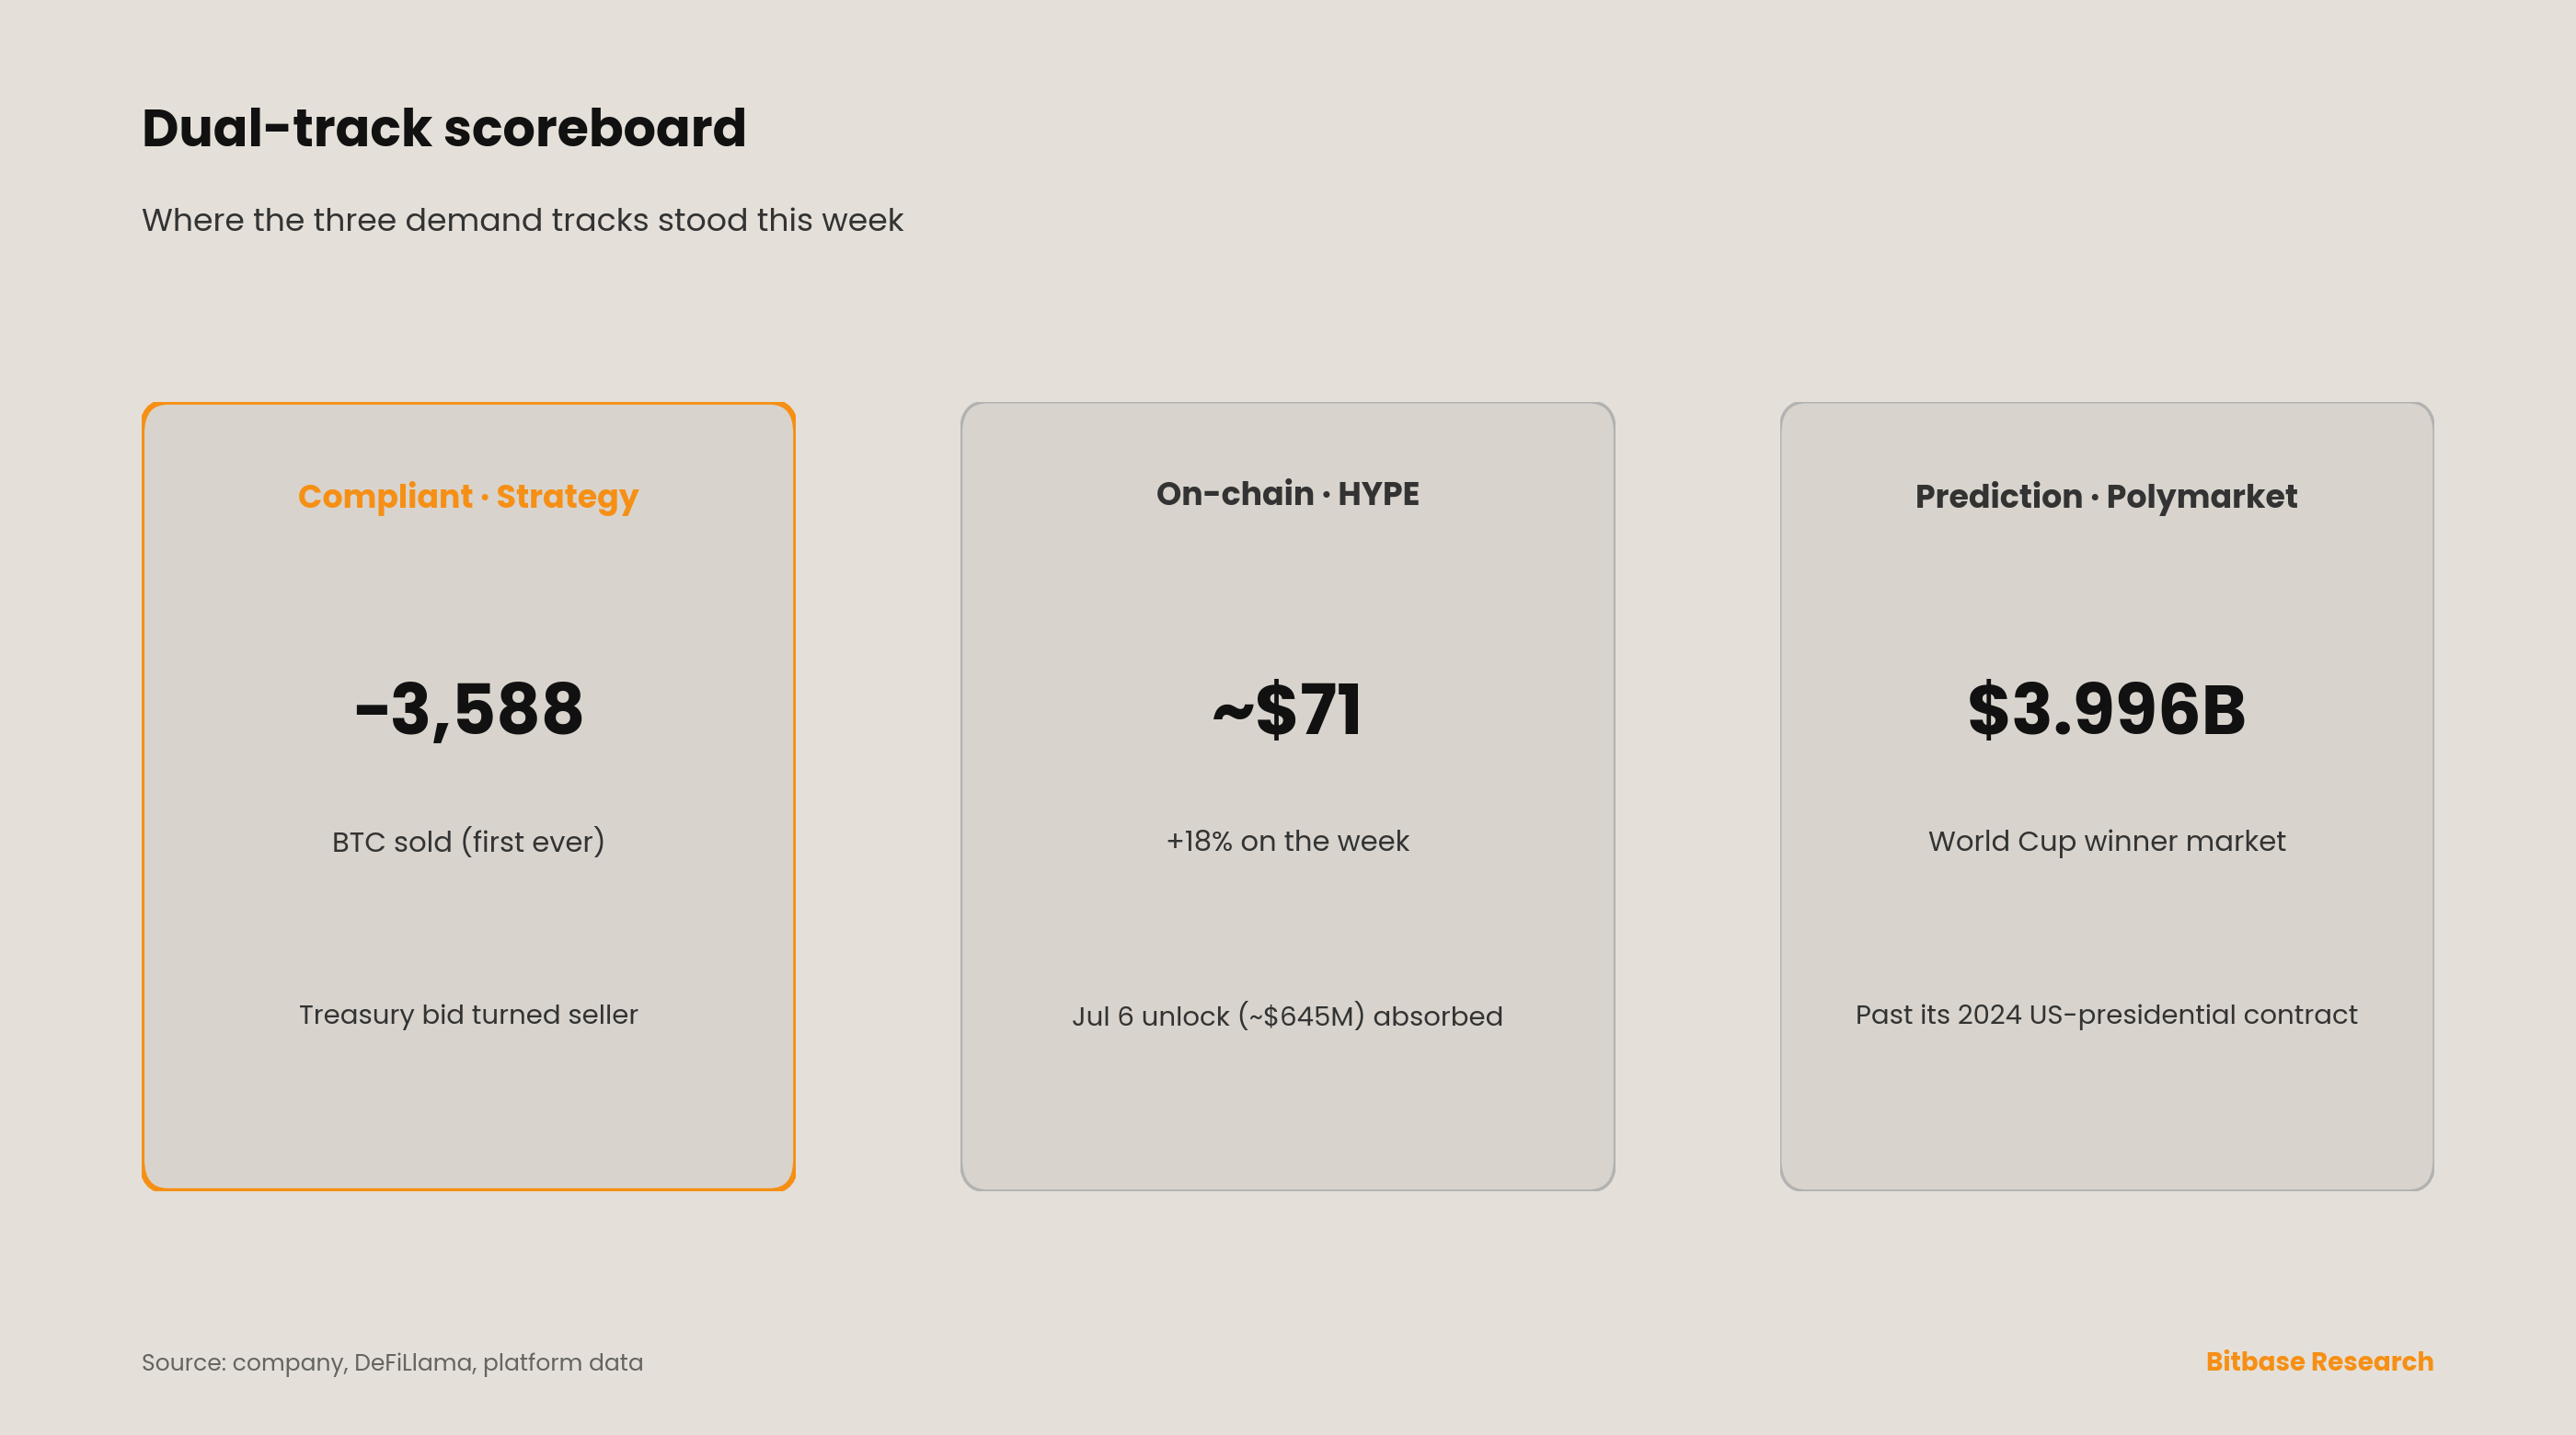
Compliant-centralized track. The two legs of this track pulled in opposite directions, and the split is the story. On flows, the ETF turn is the clearest positive on the board (Section: the one chart)—inflows broadening with IBIT back in front, the demand vacuum of June finally taking in air. On treasuries, Strategy executed its first sale, and the stock took it in stride, holding up on the view that funding dividends from a 2.5% trim is a liquidity choice rather than a change of thesis. With bitcoin near $64,000 against a ~$75,500 average, the position remains several billion dollars underwater, and the company is now, at the margin, a seller into strength rather than a buyer into weakness. The centralized bid is intact but reconstituted: it now comes from spot-ETF demand—flow-visible, price-sensitive, printed daily—rather than from a treasury that accumulated regardless of price and disclosed weekly after the fact. Same direction on the tape this week; a different, more fickle source underneath it.
On-chain native track. The on-chain-native bellwether had the cleaner week. HYPE rallied with the majors and then some, trading near $71 by mid-week against roughly $60 a week earlier—an implied gain around 18%—and within about 13% of its $76.70 all-time high, with a market capitalization near $15.9 billion; the outperformance during the recovery mirrors, in reverse, the relative weakness it showed on the way down [7][8]. The token event the series flagged in Issue 13 arrived and passed cleanly: the July 6 Core Contributor unlock of about 9.92 million HYPE—roughly $645 million at the week's price—met a buyback program reported to hold several times that amount, and the supply was absorbed without a break in the price. That unlock is not a one-off; a new tranche vests on the sixth of every month through 2027, so the market's ability to absorb it monthly is now itself a standing test. The structural footprint held: Hyperliquid still commands the large majority of on-chain perpetual flow—on the order of 70% of the category—with multi-billion-dollar daily perpetual volume [8]. The distinction the series draws holds: HYPE's price level is a token event; the perpetual-DEX signal tracks volume and share, and both stayed dominant.
Prediction-market third line. The line kept rewriting its own records. June closed as a record month for the category near $45 billion in combined volume, up about 75% month over month, with Kalshi around $30 billion and Polymarket at a record near $10.8 billion [9][10]. The World Cup pushed a single Polymarket contract—the tournament-winner market at roughly $3.996 billion of traded volume—past its own 2024 US-presidential contract to become the largest market in the platform's history [10]. Daily activity stayed elevated through the knockout stage: the July 6 fixtures alone drew tens of millions in a single match across the two venues—about $64 million on Kalshi and $122 million on Polymarket for one game—and Kalshi has run above $1 billion in daily volume for stretches since the tournament began on June 11 [10][11]. With the semi-finals on July 14–15 and the final on July 19 still ahead, the category's structural moment is not behind it. The series continues to read this as onchain-adjacent infrastructure maturing in public—a demonstration of settlement and liquidity at scale—rather than as a directional trading signal for the crypto majors.
On the radar—week of July 13 to July 19
One data release dominates the week. June CPI prints Tuesday, July 14 at 8:30 ET—the last major inflation read before the July 29 FOMC and, with a hawkish chair on record signaling one to two more hikes this year, the single number most able to reprice the front end [5][12]. May ran hot at about 4.2% year over year, its highest since 2023, with energy costs up sharply on the war premium; a hot June keeps the hike debate live and pressures the fresh risk bid, while a cool print would hand the bad-news-is-good-news trade begun by the July 2 jobs miss its cleanest confirmation yet. Around that release sit four questions the series is tracking directly. First, whether the ETF inflows sustain past a few sessions and keep IBIT in the lead, or fade back into the year-to-date redemption trend. Second, whether Strategy's sale was a one-time dividend-funding event or the opening of a cadence—each weekly 8-K now carries two-way risk. Third, whether the two macro legs the series watches for a genuine all-clear—the 2-year Treasury yield near 4.1% and the dollar index near 100.8—finally clear their thresholds; both have leaned the right way since the June FOMC but neither has broken. And fourth, on the sentiment side, whether the World Cup semi-finals and final drive prediction-market volume to a tournament peak, closing the category's record June with an even larger July. The calendar, for once, front-loads the decisive input: everything routes through the CPI tape on the 14th.
Signal tracking update
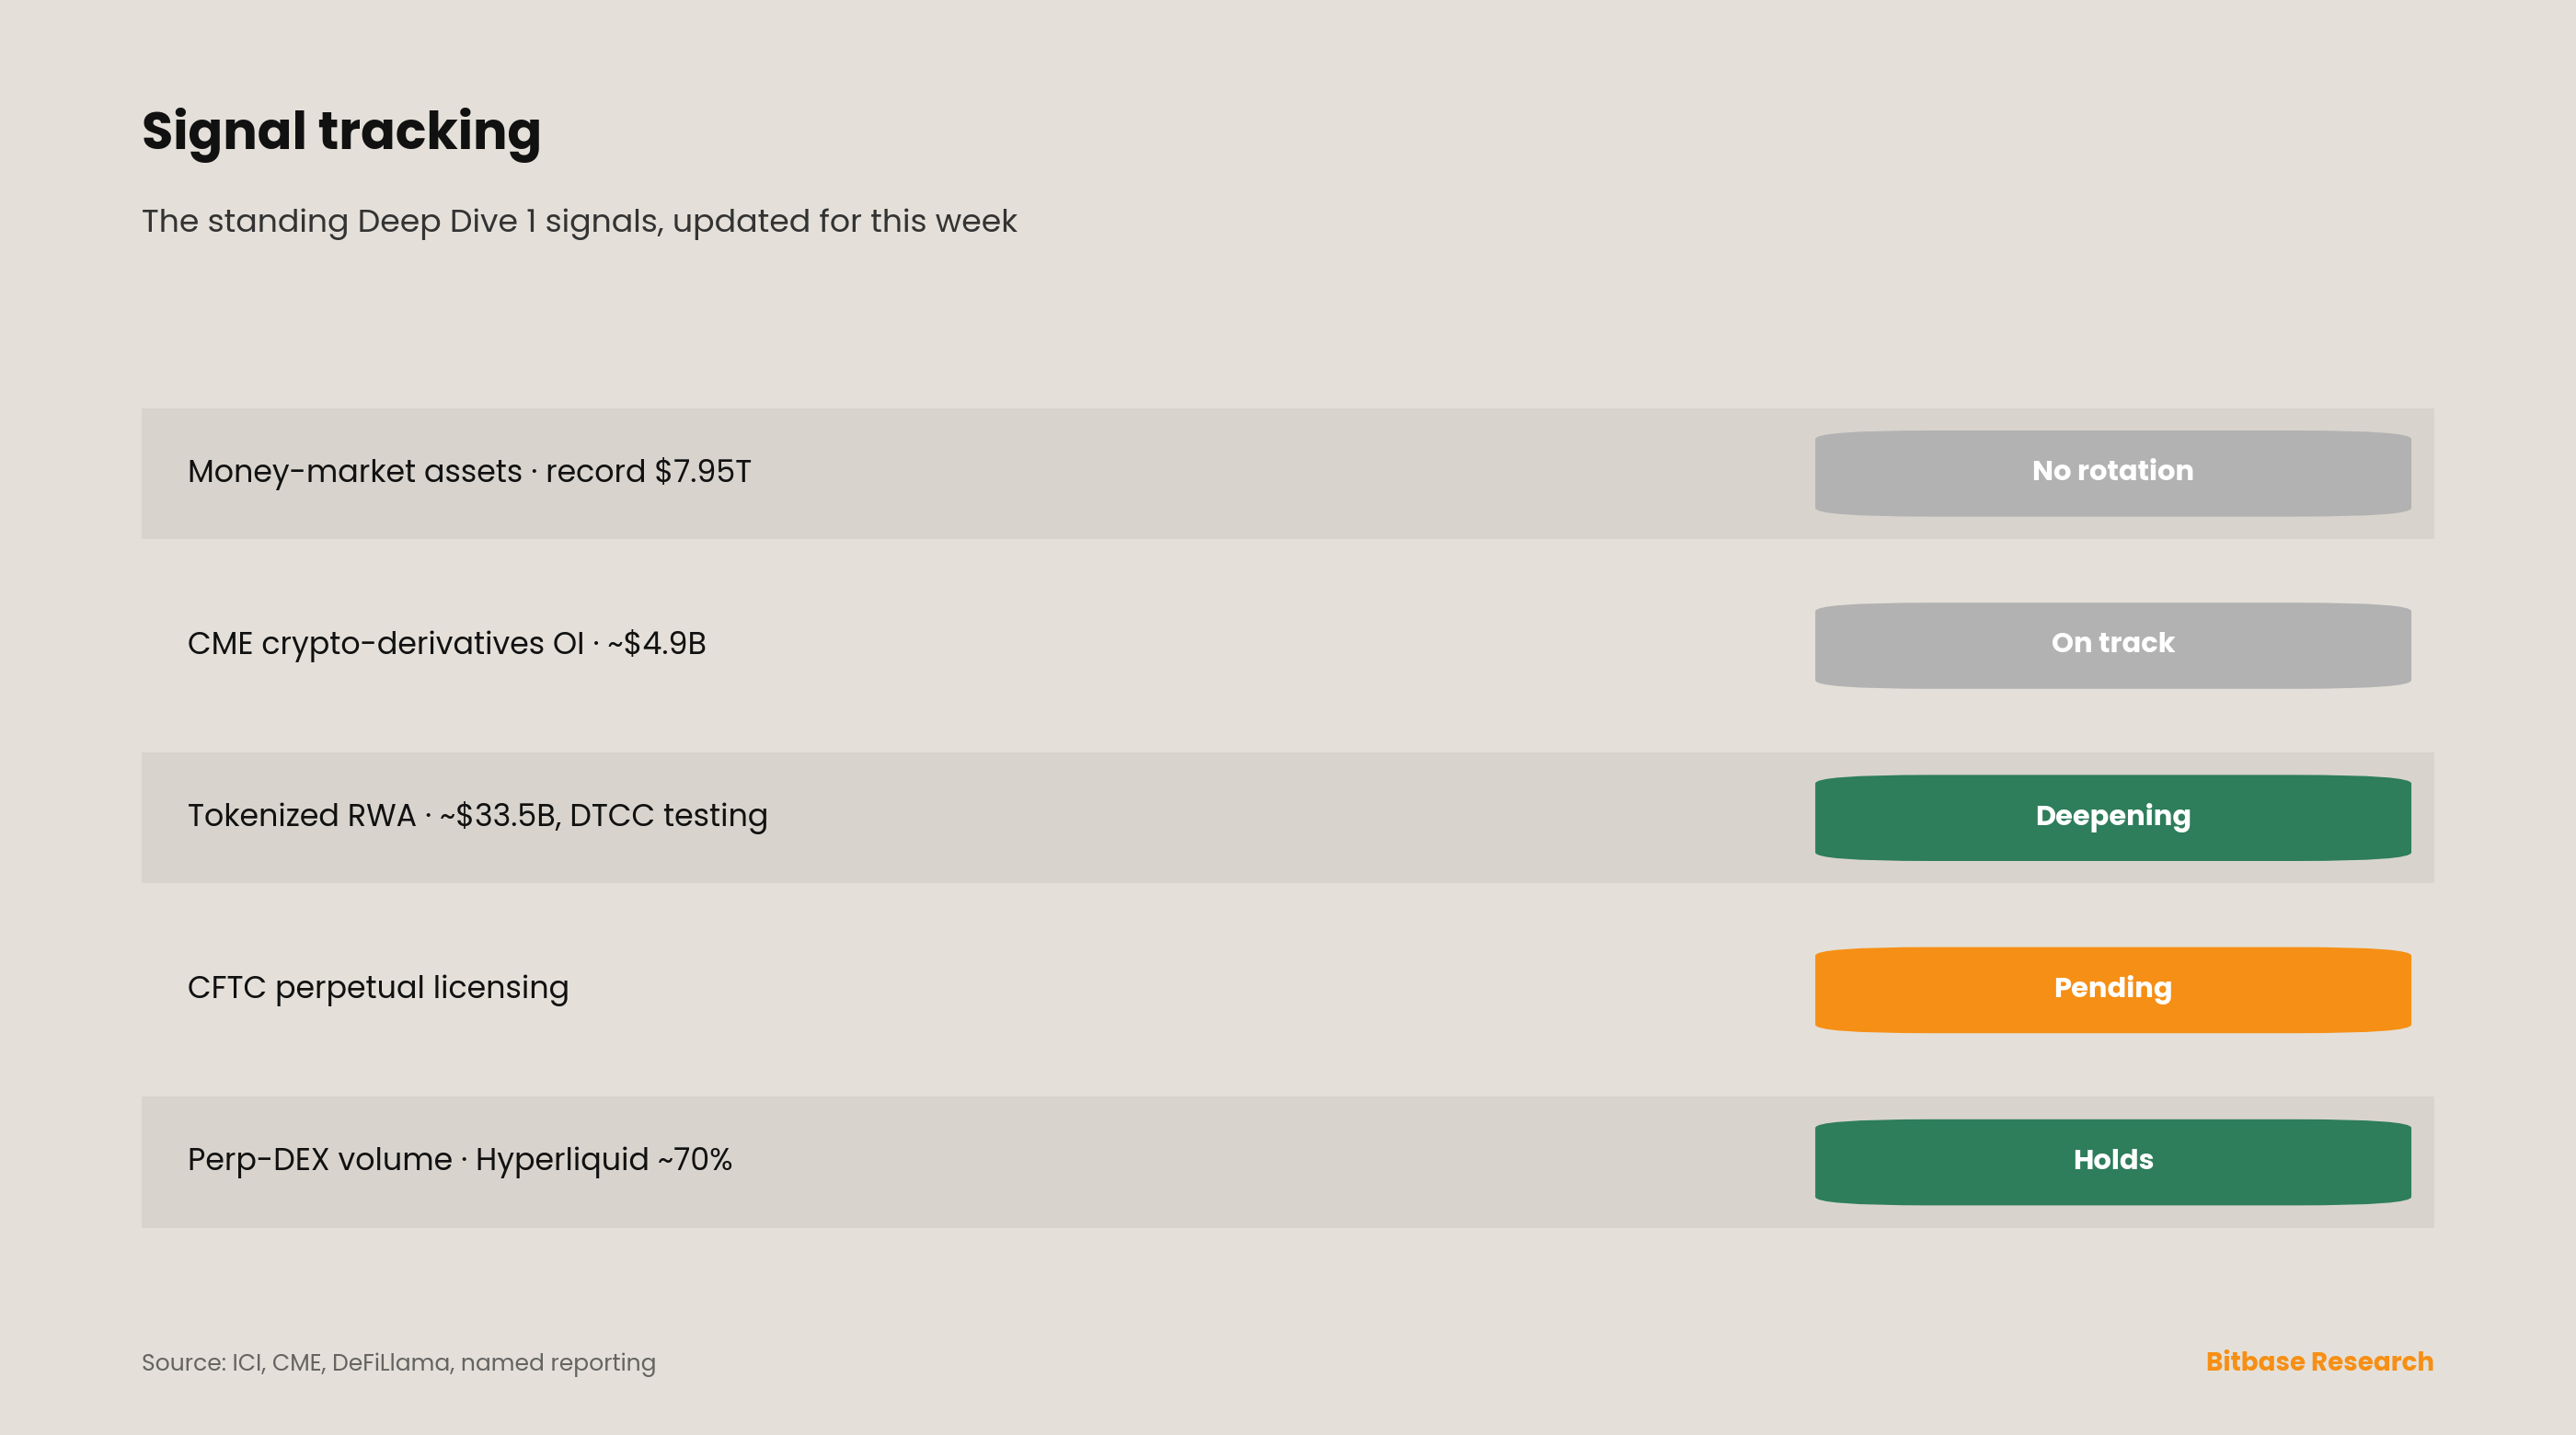
SIGNAL—Deep Dive 1 Part 1: "MMF asset scale inflection point." STATUS: Record holds; still no rotation. Per the Investment Company Institute, total money-market-fund assets rose about $5.23 billion to a fresh record $7.95 trillion for the week ended July 8, a smaller build than the prior week's ~$47.7 billion surge but a new high all the same [13]. The read is unchanged and, if anything, sharper: cash held at a record even as equities firmed, Bitcoin recovered and the ETF bid returned. A relief rally that fails to pull a single dollar out of money funds is the opposite of the reallocation this signal tracks; the cash wall is not just large, it is sticky. Until a risk-on week finally coincides with a money-fund drawdown, the inflection stays ahead of us.
SIGNAL—Deep Dive 1 Part 6: "Whether CME crypto-derivatives open interest persistently holds above $30 billion by 2027." STATUS: On track; still well below target. CME Bitcoin-futures open interest sat near 15,400 contracts—about 77,000 BTC of notional, roughly $4.9 billion at the week's price—a level consistent with the prior read once the low-confidence caveat is applied, and far from the $30 billion the signal watches for on a multi-year horizon [14]. The 24/7 complex live since May 29 continued trading through the weekend, but no Tier-1 source published a standalone weekend-volume record for the July 4–5 or July 11–12 windows, the same data gap flagged since Issue 10. The signal stays on track against full-year data, not this week's snapshot.
SIGNAL—Deep Dive 1 Parts 3 and 6: "Tokenized RWA as common collateral infrastructure." STATUS: Deepening, with a settlement-rail milestone. On-chain tokenized real-world-asset value reached roughly $33.5 billion by July 8, extending the build the signal tracks [15]. Two in-window developments matter more than the level. Ondo—by most counts the leader in tokenized equities—announced an integration with RWA Inc. to widen distribution of its tokenized assets, and, more structurally, the DTCC began production testing of tokenized securities in July with a full-service launch targeted for October [15][16]. A central clearer moving tokenization from pilot to production is exactly the "common infrastructure" leg of this signal, and it firms the thesis a notch beyond the app-layer growth of prior weeks.
SIGNAL—Deep Dive 1 Part 6: "Whether the US CFTC approves more licensed entities to offer perpetual-swap-style products by 2027." STATUS: Pending; federal track still live. No new CFTC licensing action was confirmed in-window. The salient administrative thread remains the SEC's late-June "novel ETFs" comment period, the attempt to standardize the framework under which event-contract, staking-yield and altcoin-basket products reach US markets; it advances by calendar, not by headline, and stays at pending with a live rulemaking attached. The prediction-market boom above gives this signal its commercial urgency—regulated venues are already running billion-dollar days—but the licensing itself has not moved.
SIGNAL—Deep Dive 1 Part 6: "Whether perpetual-DEX annual trading volume holds above $5 trillion in 2026." STATUS: Holds on volume. Hyperliquid's footprint held through the week—the large majority of on-chain perpetual flow, on the order of 70% of the category, with multi-billion-dollar daily perpetual volume and open interest that remains the largest of any perpetual DEX [8]. A rallying HYPE and a cleanly absorbed unlock did not disturb the volume base the signal actually tracks; the price event and the flow signal stayed decoupled, as designed. On a full-year run-rate the $5 trillion line remains within reach.
New dimension—the marginal buyer changed hands
The series has spent four issues describing a market held up by a single, unusually reliable source of demand: a corporate treasury that bought on a schedule and never sold. This week the identity of the marginal buyer rotated. That treasury became a seller—small but real—while the demand that stepped back in came through the spot-ETF wrapper with BlackRock at the front. It matters that the market did not lose its bid; it swapped one bid for another. But the two are not the same animal. The treasury bid was price-insensitive and opaque, disclosed weekly after the fact and effectively indifferent to entry level; the ETF bid is price-sensitive and flow-visible, printed daily for everyone to read and quick to leave when the tape turns. A market leaning on the first learns patience—the buyer would be there regardless. A market leaning on the second learns to watch the flows, because the buyer is only there while the numbers are green. The recovery is real, and it is being led by a more legible but more fickle buyer than the one it replaced. The practical consequence for reading this series: for four issues the load-bearing number was Strategy's weekly 8-K; from here it is the daily ETF flow print—and, on the 14th, the CPI that will tell that buyer whether to stay.
Caveats
Date integrity. This issue's window is July 6–12, 2026. US spot-ETF and TradFi data anchor to end-of-day prints within that window; the June-payrolls-driven repricing and the July 2 ETF reversal that opened the move belong to Issue 13's window and are referenced here only as the setup. The June CPI (July 14), the World Cup semi-finals (July 14–15) and final (July 19), and any Strategy disclosure covering July 6–12 fall after this window and are treated as forward items, not results.
Verification status. The load-bearing figures—the spot-Bitcoin-ETF daily flows and the July 7 IBIT reversal; the three-day inflow total; Strategy's holdings, average cost, the 3,588-BTC sale and the capital framework; Bitcoin's weekly close and range; the ICI money-market record; the tokenized-RWA total and the DTCC testing milestone; and the prediction-market records—have been traced to primary or named Tier-1 sources. Figures carried at lower precision are flagged in-line.
Data-caliber conflicts and gaps flagged. No single Tier-1 source publishes one authoritative weekly ETF total; the three-day and streak figures are drawn from named reporting and daily trackers subject to T+1 revision. Bitcoin's intra-week path is assembled from daily reads (open near $63,590, a mid-week dip toward $61,700, a July 10 close near $64,143); the exact July 11–12 closing prints fall at the edge of available Tier-1 data and are carried at the July 10 level. The Ether weekly move is confirmed as a percentage (about +2.7%); an absolute Ether level circulating in one feed is treated as low-confidence and omitted from the body. CME Bitcoin open interest is carried at moderate confidence from a contract-count read. HYPE's exact close and the unlock-absorption ratio are single-source and softened accordingly. Hyperliquid open-interest and share figures are DeFiLlama-class estimates that vary by tracker.
Source attribution. US spot Bitcoin ETF flow figures are from named financial outlets and daily trackers as cited, subject to revision and not issuer-direct; Strategy holdings, the sale and the framework are from the company's SEC 8-K as reported; Bitcoin and Ether levels are per named Tier-1 outlets; money-market-fund figures are from the ICI weekly release; tokenized-RWA figures are from named analytics and reporting; prediction-market figures are from platform data as reported by named outlets; Fed-policy context is per the BLS release schedule and named reporting.
Causation discipline. Causal links—the ETF inflow broadening on the back of the prior week's macro turn, the HYPE rally tracking the majors' recovery, the money-fund record signalling caution rather than capitulation—are framed as association, not proof. A single week is a small sample; the series tracks direction and threshold crossings across issues, not one print. Nothing here is a recommendation to buy, sell or hold any asset, and none of it is investment advice.
References
[1] Bitcoin ETF daily flows and the July 7 IBIT reversal, per Farside Investors data and named reporting, week of July 6, 2026. farside.co.uk
[2] Spot Bitcoin ETF three-day inflows (~$510M) with BlackRock leadership, July 7–9, 2026. techtimes.com
[3] US spot Bitcoin ETF year-to-date net flows (~−$5.4B) and June redemption record, per Farside. farside.co.uk
[4] Strategy (MSTR) Form 8-K—bitcoin sale, holdings and Digital Credit Capital Framework, July 2026. sec.gov
[5] Strategy bitcoin sale and Fed-policy context, per public reporting, July 2026. crowdfundinsider.com
[6] Strategy second-quarter digital-asset loss and cost basis, per company disclosure. stocktitan.net
[7] Hyperliquid HYPE price, market cap and the July 6 token unlock, per public reporting. coingecko.com
[8] Hyperliquid open interest, perpetual volume and category share, per DeFiLlama. defillama.com
[9] Prediction-market June volume records, per public reporting. cnbc.com
[10] Polymarket World Cup winner market vs 2024 US-presidential contract and single-match volumes. finance.yahoo.com
[11] Kalshi daily volume during the World Cup, per public reporting. defirate.com
[12] US June CPI release schedule (July 14) and the July 29 FOMC, per BLS and reporting. bls.gov
[13] ICI money-market-fund assets, record $7.95T for the week ended July 8, 2026. ici.org
[14] CME Bitcoin-futures open interest, contract-count read, July 2026. cmegroup.com
[15] Tokenized RWA on-chain value (~$33.5B) and Ondo–RWA Inc integration, July 2026. en.cryptonomist.ch
[16] DTCC tokenized-securities production testing beginning July 2026. dtcc.com