
Bitbase Research · May 22, 2026
Executive Summary
On January 17, 2025, the TRUMP token launched on Solana. Eighty percent of the one-billion-token total supply was held at launch by two Trump-affiliated entities — CIC Digital LLC and Fight Fight Fight LLC [1]. Within 36 hours, the token reached an all-time high of $74.27 on January 19, 2025 [2]. By the May 22, 2026 snapshot date of this report, TRUMP had drawn down approximately 97% from that peak [2]. During the launch sequence, the relative strength index on hourly closes printed deep into overbought territory and the moving-average convergence-divergence histogram flipped positive at the inflection; both indicators triggered the canonical readings their authors documented in the 1970s. Both indicators were applied to a price series that, by every regulatory and academic definition extant at the snapshot date, has no underlying asset to which "overbought" could meaningfully refer.
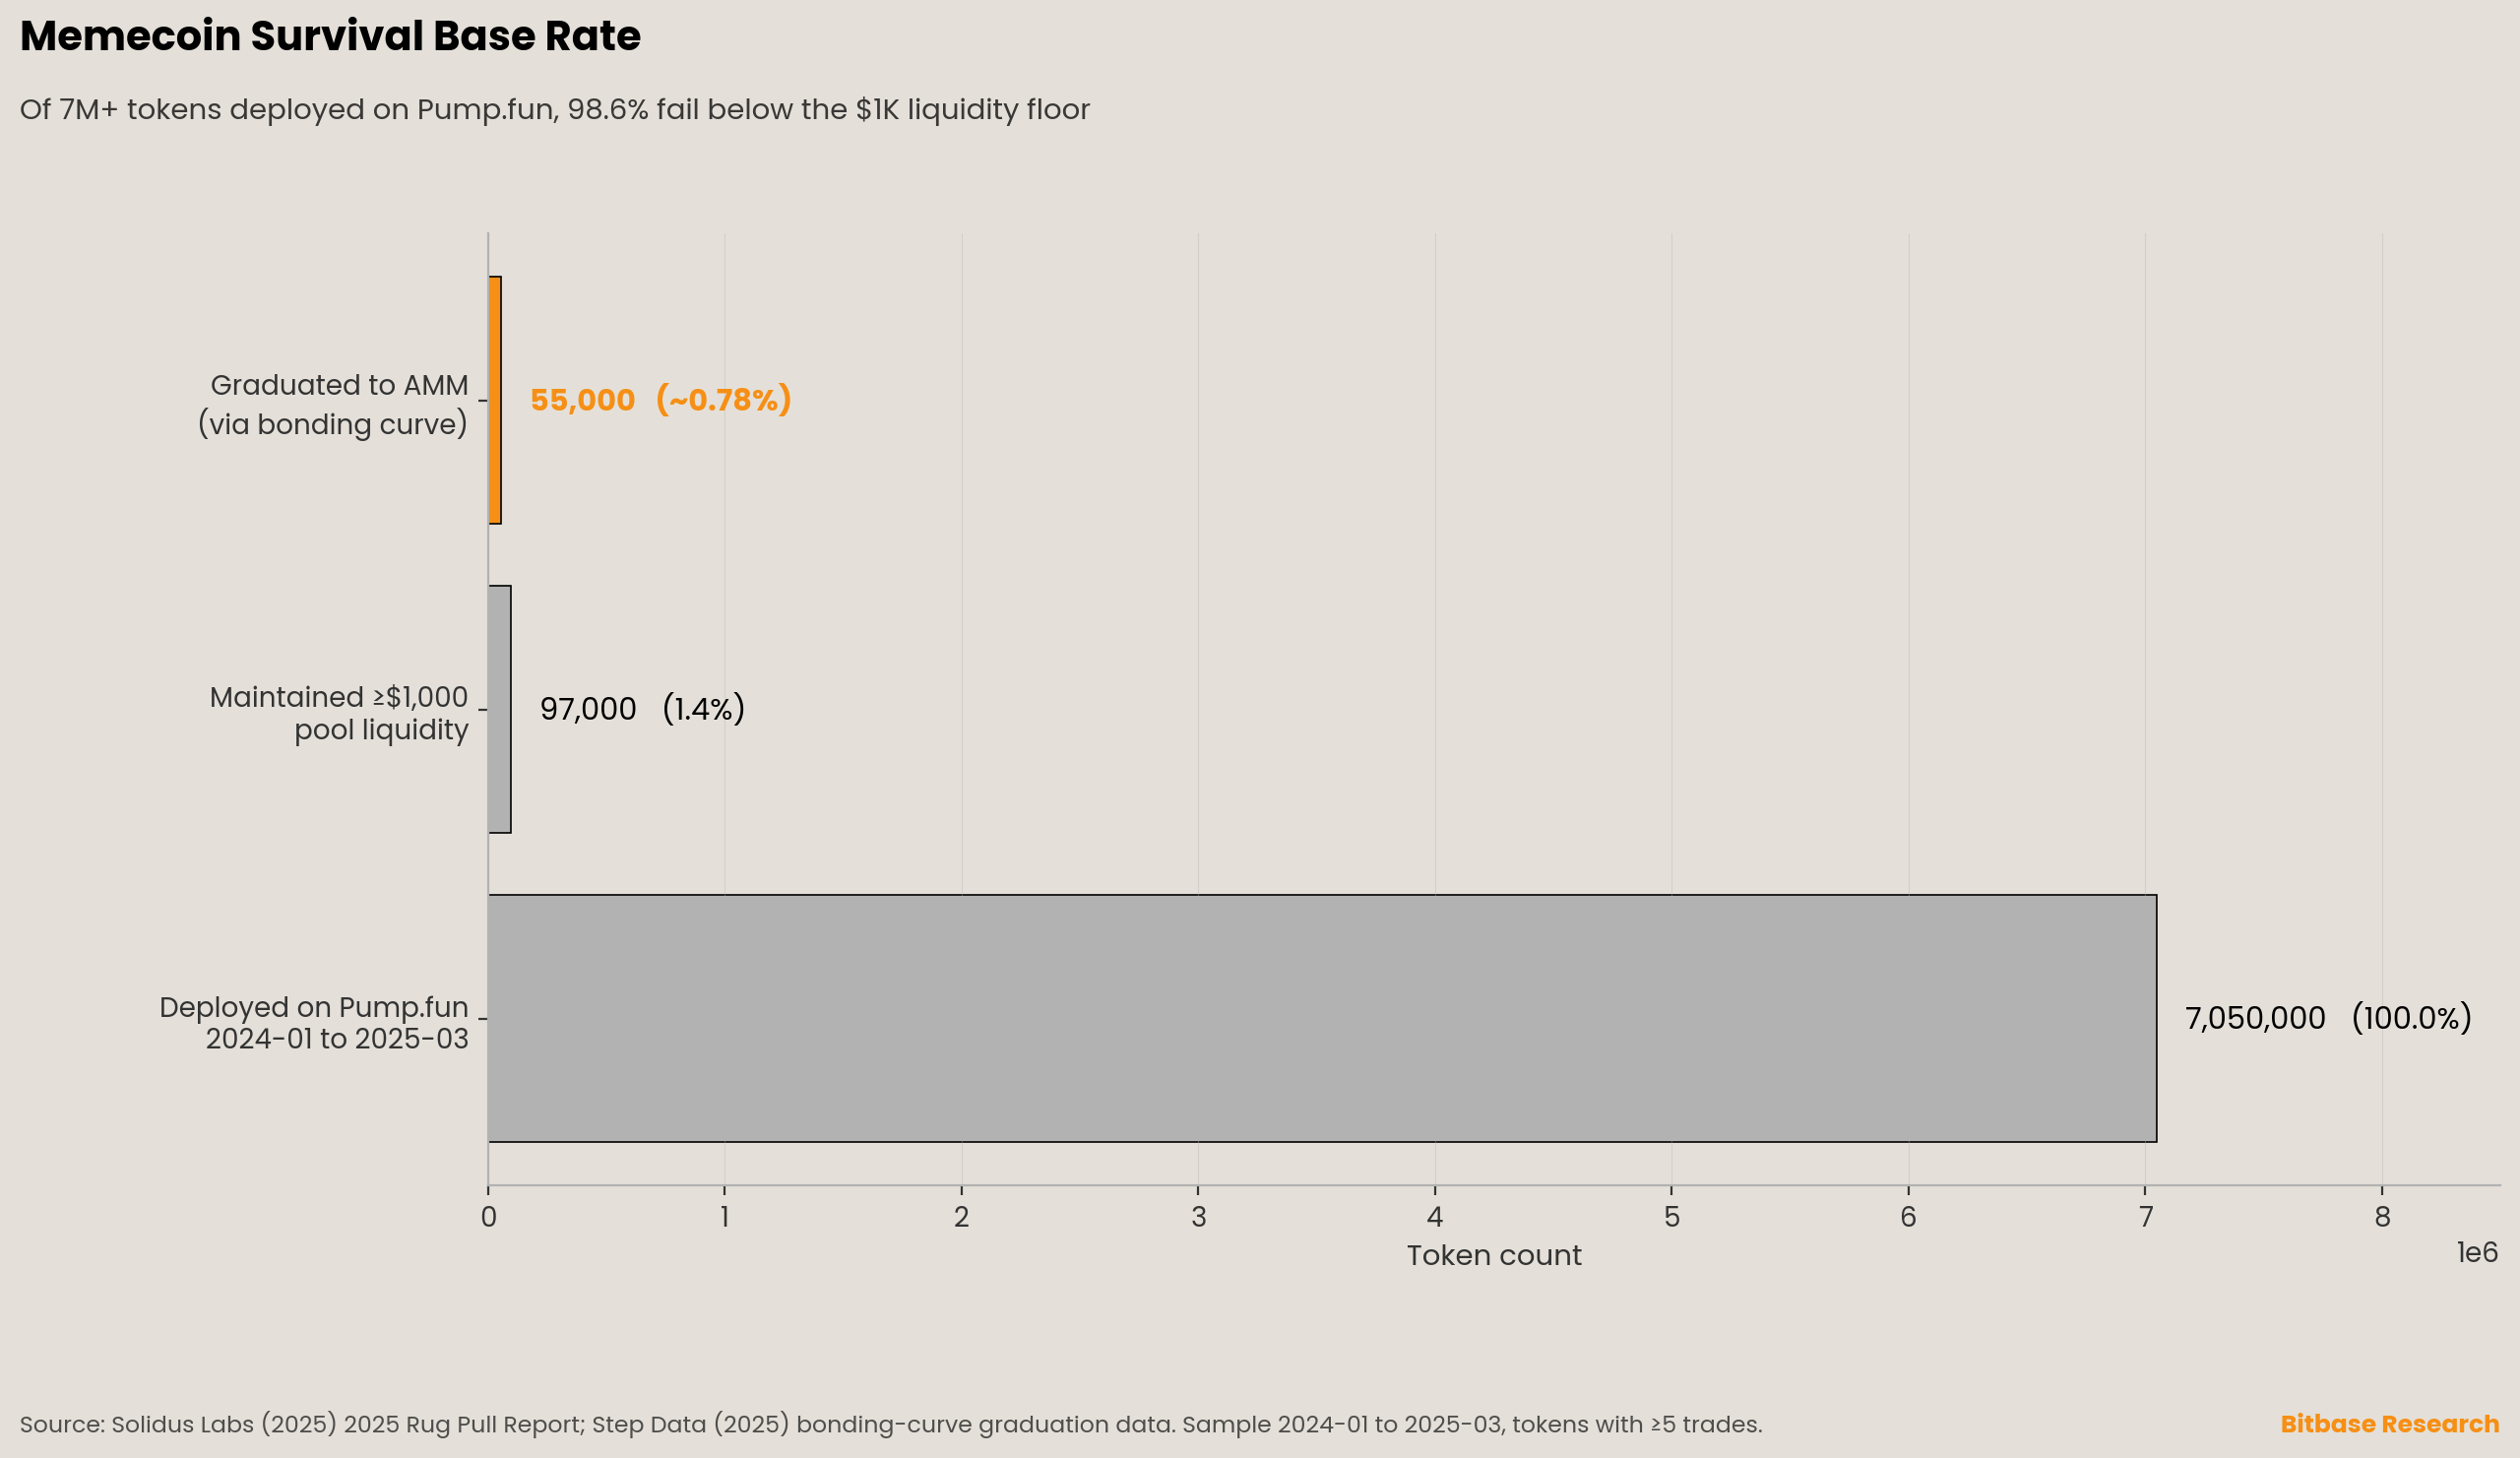
The U.S. SEC Division of Corporation Finance issued its Staff Statement on Meme Coins on February 27, 2025, characterizing memecoins as having limited or no use or functionality and concluding that transactions in such tokens do not involve the offer and sale of securities [3]. Commissioner Crenshaw's contemporaneous dissent contested the legal conclusion but did not dispute the underlying observation that the asset class lacks fundamentals [4]. Solidus Labs documented in May 2025 that 98.6% of the more than seven million tokens deployed on Pump.fun between January 2024 and March 2025 failed below the $1,000 pool-liquidity floor, with only approximately ninety-seven thousand surviving to that threshold [5]. The graduation rate from Pump.fun's bonding curve to a standard automated market maker averaged 0.78% in 2025-Q2 per Step Data [6], holding in the 0.7%–0.8% range during July and August 2025 per Cointelegraph reporting on platform mechanics [7].
This report develops three claims and specifies the methodological framework to test them.
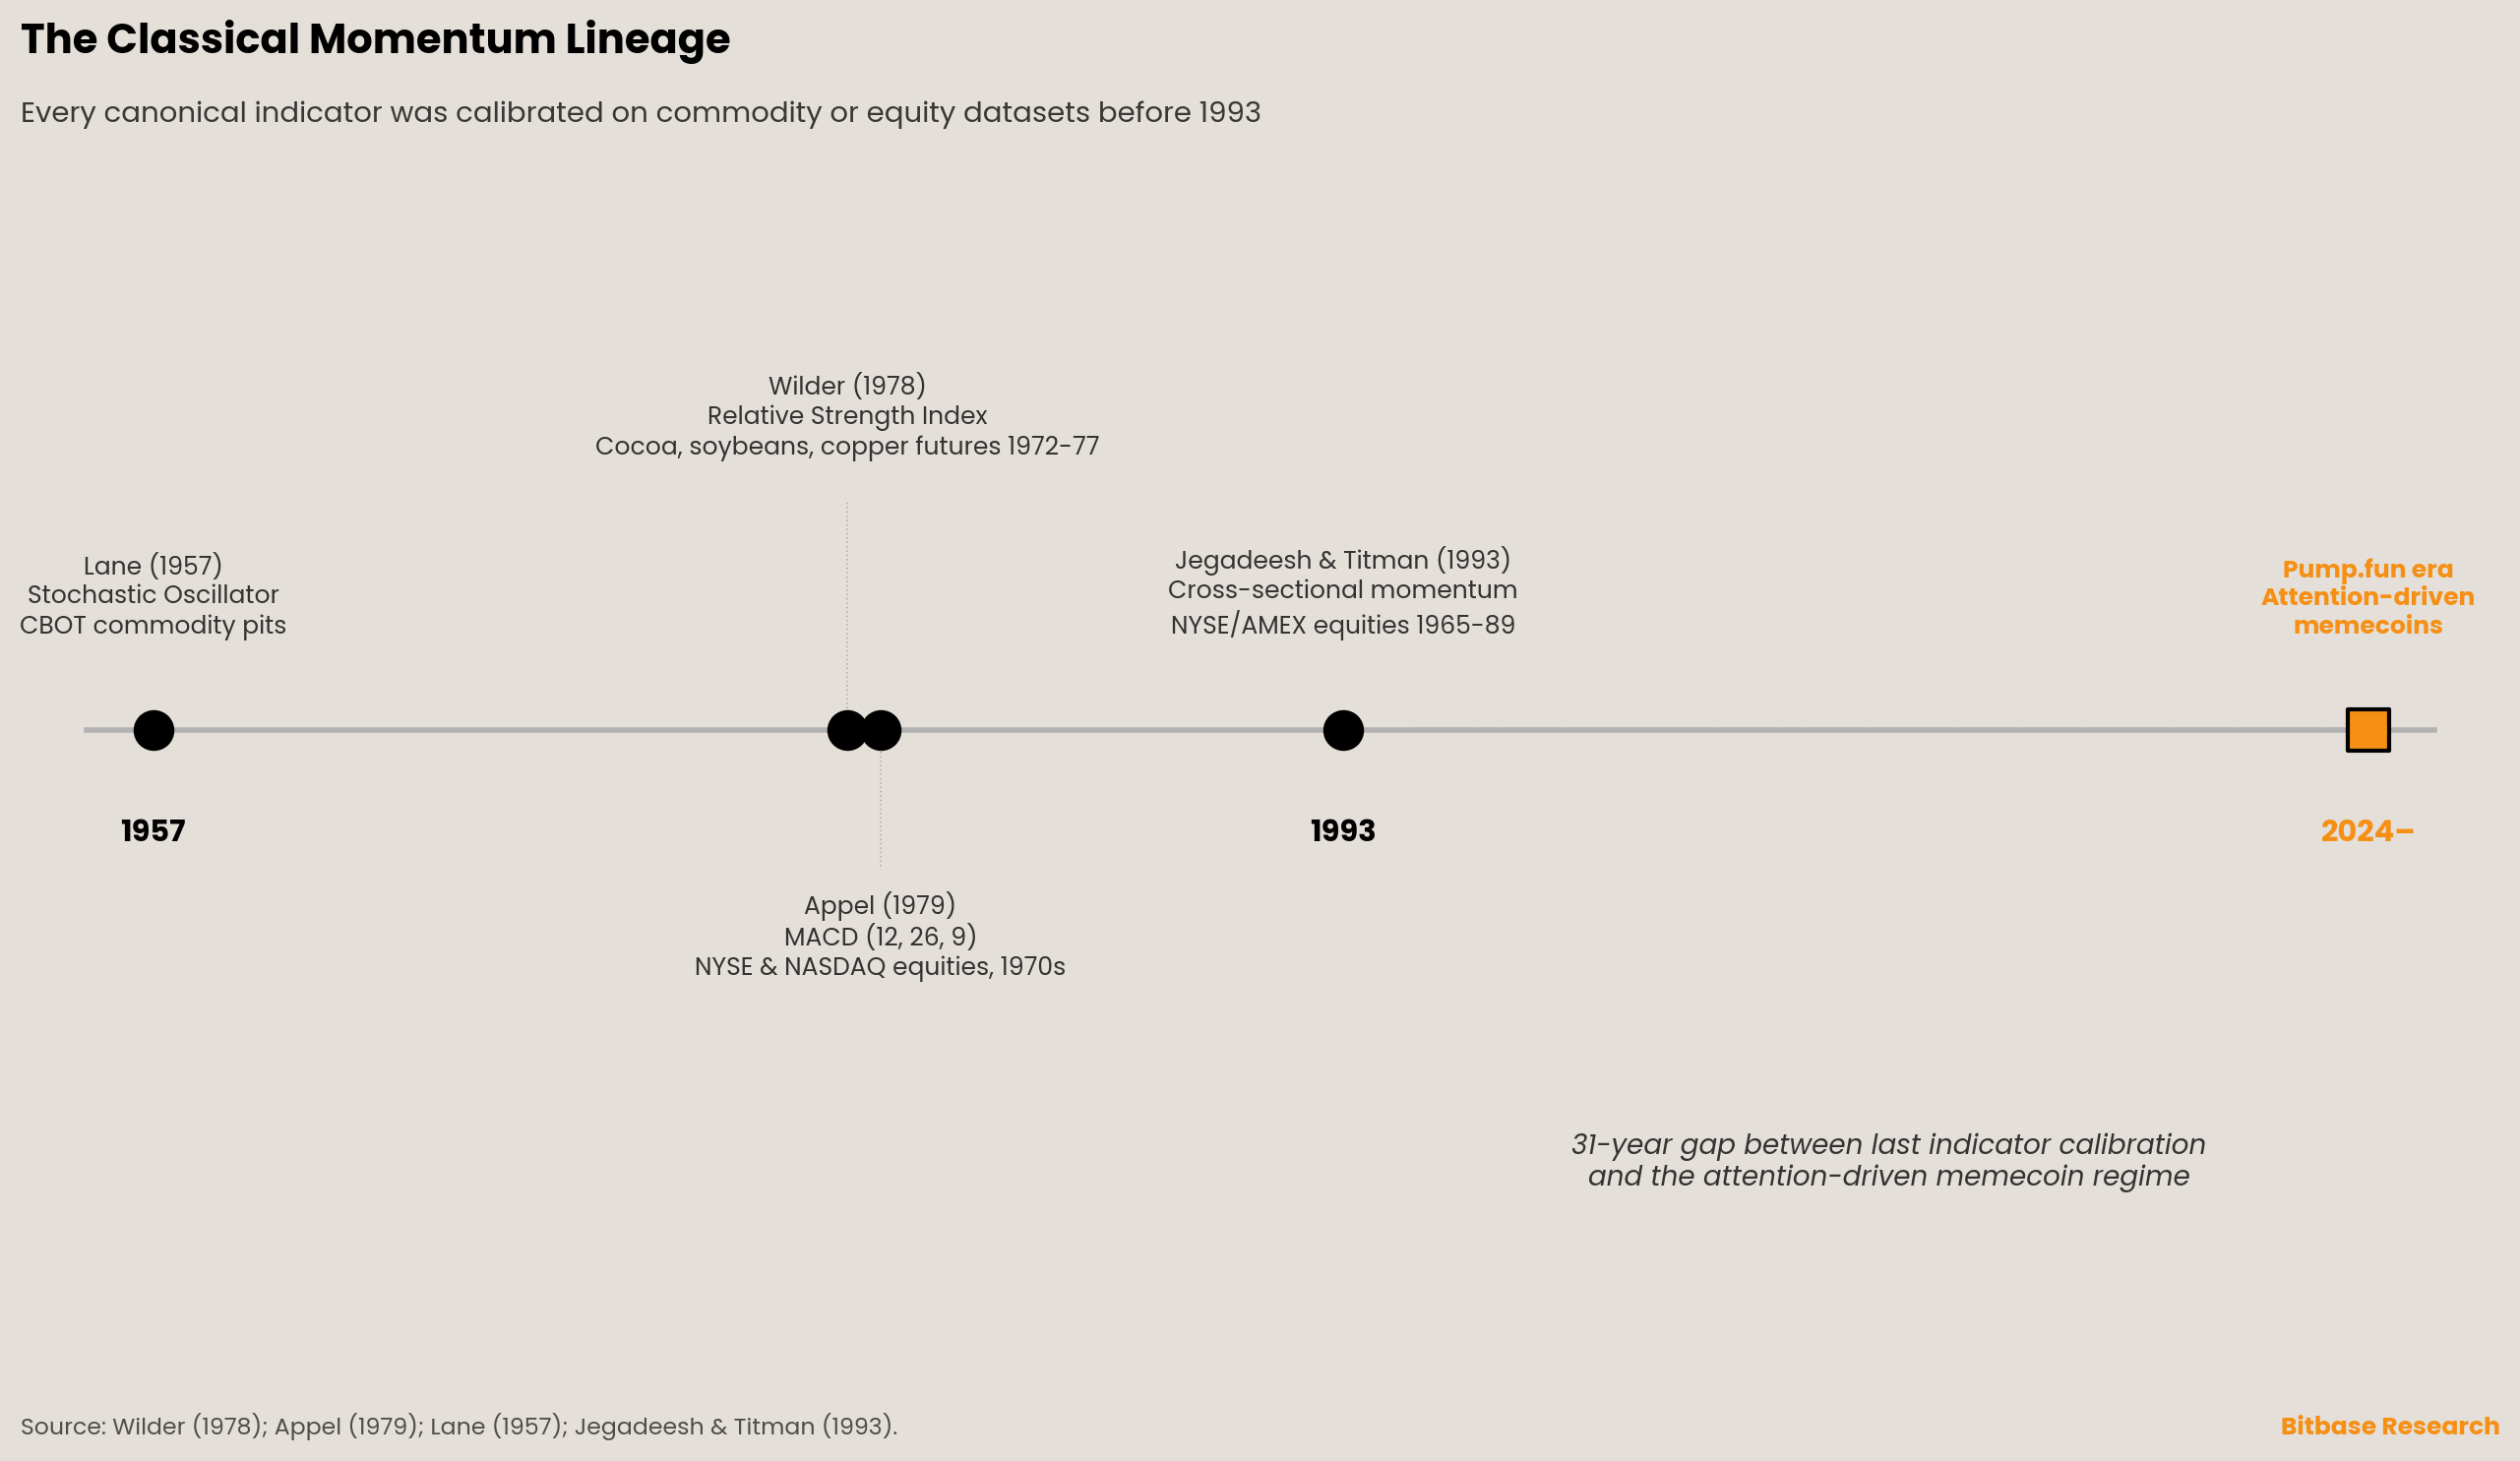
Claim 1. The classical momentum oscillators — Wilder's relative strength index [8], Appel's moving-average convergence-divergence [9][10], and Lane's stochastic oscillator [11][12] — were calibrated on US commodity and equity datasets between 1957 and 1979. Cross-sectional momentum entered the peer-reviewed literature with Jegadeesh and Titman's 1993 Journal of Finance paper on US equities 1965–1989 [13]. None of these calibrations was tested on assets lacking fundamental valuation. Park and Irwin's 2007 meta-review of ninety-five technical-analysis studies documented that technical trading strategies generate economic profits in foreign-exchange and futures markets but not in stock markets [14] — an asymmetry inconsistent with universal applicability even within asset classes for which the indicators were originally designed.
Claim 2. Memecoin price formation is structurally different from the markets the classical indicators were designed for. Liu and Tsyvinski's 2021 Review of Financial Studies paper establishes that the major cryptocurrencies have no exposure to common stock-market or macroeconomic factors and no exposure to currency or commodity returns [15]. The memecoin tail of the distribution lacks such exposure a fortiori. Price generation is driven by attention reflexivity, mechanized through bonding-curve launchpads such as Pump.fun and propagated through automated-market-maker microstructure on Raydium, PumpSwap, and Uniswap. BIS Bulletin No. 69 characterizes the resulting market structure as self-referential [16].
Claim 3. No choice of indicator window or threshold can convert a mathematics designed to read information-driven price action into a mathematics that reads attention-driven price action equivalently. The input space has changed; the indicator does not observe its input space. This is the formal statement of why parameter tuning is structurally insufficient.
The report proposes three departures for an honest memecoin observation framework: cross-sectional ranking in place of fixed thresholds [17]; integration of attention proxies [18][19] and holder-concentration variables on equal footing with price-derived signals; output framed as observation rather than prediction. The empirical protocol — sample universe, regime windows, statistical tests, control assets — is specified in Chapter 3; numerical findings will be released as updates to this paper once the data pipeline produces statistically conclusive results across the parameter grid.
Four conditions that would invalidate the structural-failure thesis are enumerated in Chapter 7.
Chapter 1 · The Classical Indicators and Their Historical Domain
The momentum-oscillator family used in retail charting software at the May 22, 2026 snapshot date descends from four canonical works published between 1957 and 1993, each grounded in a specific dataset of US commodity or equity prices. The historical record is consistent and well-documented: none of the calibrations was tested on assets lacking fundamental valuation.
1.1 Lane (1957) and the stochastic oscillator
George C. Lane, a Chicago-based commodity trader affiliated with Investment Educators Inc., authored The Stochastic Process as internal course material copyrighted in 1957 [12]. The methodology was developed from observation of price action on Chicago Board of Trade commodity futures — corn, soybeans, wheat — where Lane and his colleagues had documented that prices tend to crowd the upper or lower end of their recent range as a move loses energy before reversing. The oscillator formula, %K = 100 × (close − low_n) / (high_n − low_n), normalizes the current close against the recent range and assumes that intraday range distribution carries information about institutional accumulation or distribution. This assumption was rooted in floor-traded commodity pits where pit observers could plausibly read distribution patterns from tape activity [11][20].
1.2 Wilder (1978) and the relative strength index
J. Welles Wilder published New Concepts in Technical Trading Systems in 1978 after several years of trading commodity futures using hand-computed oscillators [8]. The book's dataset, as documented in its worked examples, consisted of daily closes on cocoa, soybeans, copper, pork bellies, and silver futures from 1972 through 1977. The default fourteen-day smoothing parameter for the relative strength index was an empirical compromise between responsiveness and signal stability in commodity futures with weekly contract rollover. Wilder explicitly framed his work as commodities-focused; the book contains no equity calibration.
The relative strength index assumes three things. First, prices mean-revert around their recent volatility, and an extreme reading is therefore diagnostic of behavioral overreaction. Second, the overbought and oversold thresholds — seventy and thirty by Wilder's original calibration — are stable across time and assets. Third, trend and range regimes are identifiable and persist long enough for the indicator window to capture turning points. None of these three assumptions was tested against assets lacking fundamental valuation.
1.3 Appel (1979) and moving-average convergence-divergence
Gerald Appel circulated the moving-average convergence-divergence method through Signalert Corp newsletters from the mid-1970s, formalizing it in a 1979 self-published manual and elaborating it in Technical Analysis: Power Tools for Active Investors [9][10]. The canonical (12, 26, 9) parameter triple reflects six-day trading-week conventions in use at the time: roughly two weeks, one month, and one-and-a-half weeks of trading sessions [21]. Appel originally proposed asymmetric parameter sets — (8, 17, 9) for buy signals and (12, 25, 9) for sell signals — but the asymmetric formulation did not survive transmission into popular charting software, which standardized on the symmetric (12, 26, 9).
The dataset Appel used was the NYSE composite and selected NASDAQ equities of the 1970s — an era of inflation-driven volatility but recognizable corporate fundamentals. Maitah and co-authors document in their 2021 parameter-optimization study that canonical (12, 26, 9) generates negative returns on Nikkei 225 futures over 2011–2019 [21], indicating that the parameters themselves carry market-specific calibration that does not transfer even between two developed-equity venues.
1.4 Jegadeesh and Titman (1993) and the academic momentum anchor
Cross-sectional momentum entered the peer-reviewed literature with Jegadeesh and Titman's 1993 Journal of Finance paper documenting that US equities with three-to-twelve-month positive past returns continued outperforming over a similar forward horizon [13]. The finding, drawn from the Center for Research in Security Prices database covering New York Stock Exchange and American Stock Exchange equities 1965–1989, became the foundation for the modern momentum factor in academic asset pricing. The effect was documented on assets with cash-flow fundamentals; subsequent literature extended it across asset classes, but each extension required separate empirical validation.
1.5 Park and Irwin (2007): the meta-review verdict
Park and Irwin's 2007 Journal of Economic Surveys paper remains the load-bearing assessment of classical technical analysis [14]. Across ninety-five modern studies — fifty-six reporting positive performance, twenty negative, nineteen mixed — the consistent finding was that technical trading strategies generate economic profits in foreign-exchange and futures markets but not in stock markets. This pattern, already inconsistent with the 1957–1979 literature's implicit promise of universal applicability, suggests that even within asset classes for which the indicators were developed, performance is conditional on market structure rather than guaranteed by the mathematics of the indicator.
The implicit assumptions inherited from this canonical literature are three: prices discount or partially discount fundamental information; mean reversion is the default tendency; trend regimes have characteristic lengths comparable to the indicator's parameter window. Each assumption depends on the existence of an underlying value referent against which prices oscillate. Whether such a referent exists in memecoin markets is the question Chapter 2 develops.
Chapter 2 · The Memecoin Price Generator
The TRUMP launch sequence on January 17, 2025 is the most extensively documented memecoin event in the public regulatory record [1][2][3]. The launch concentrated 80% of total supply in two related entities and produced a 36-hour climb to $74.27 followed by sustained drawdown — a trajectory that the canonical RSI and MACD readings tracked mechanically without informational reference to any underlying. The TRUMP case is not anomalous in structural type. It is the cleanest available illustration of a price-generation regime that differs from the markets the classical indicators were calibrated for, along three measurable dimensions: absence of a fundamental anchor, attention reflexivity as the dominant price-generating variable, and extreme concentration of supply and holding.
2.1 The absence of a fundamental anchor
The SEC Division of Corporation Finance Staff Statement on Meme Coins, dated February 27, 2025, characterizes memecoins as having limited or no use or functionality, with value driven by speculation rather than by economic rights or cash flows [3]. The conclusion drawn — that transactions in such tokens do not involve the offer and sale of securities under federal law — is downstream of a more fundamental observation: there is no cash flow, no claim on enterprise value, no economic right that could be valued under any of the canonical asset-pricing frameworks. Commissioner Crenshaw's contemporaneous dissent does not contest the empirical observation; it contests the legal conclusion drawn from it [4].
The absence of fundamentals applies more broadly than to the memecoin sub-category. Liu and Tsyvinski's 2021 Review of Financial Studies paper establishes that the major cryptocurrencies — Bitcoin, Ethereum, Ripple — have no exposure to most common stock-market and macroeconomic factors or to the returns of currencies and commodities [15]. If the largest cryptocurrencies lack factor exposure to traditional asset classes, the memecoin tail of the distribution lacks such exposure a fortiori. The classical momentum indicators were designed for markets where price oscillates around a slowly-moving fundamental value; memecoin markets have no such value to oscillate around.
2.2 Attention as the dominant variable
What replaces fundamentals as the price-generating variable is attention — measurable through search-volume indices, social-media mention counts, and the size of the addressable user base of memecoin-creation platforms. Da, Engelberg, and Gao introduced the Google Search Volume Index in their 2011 Journal of Finance paper as a direct retail-attention proxy, showing that abnormal search volume on Russell 3000 stocks 2004–2008 predicted price increases over the next two weeks followed by reversal within the same year [18]. The attention-driven overshoot-and-reversion pattern Da and co-authors documented in equities has been replicated in cryptocurrency markets by Liu and Tsyvinski (2021), who report that proxies for investor attention forecast cryptocurrency returns over their 2011–2018 sample [15].
Barber and Odean's 2008 Review of Financial Studies paper provides the behavioral foundation: individual investors are net buyers of attention-grabbing assets because their search problem is asymmetric [22]. They cannot search the universe of available investments; they can only react to the assets that reach them. In memecoin markets, this asymmetry is amplified by the size of the choice set. Pump.fun, the dominant Solana memecoin-creation platform between its January 19, 2024 launch and the snapshot date, generated more than 11.9 million tokens between launch and the third quarter of 2025 [23][24]. The decision to buy any individual memecoin is therefore a decision to buy whatever has captured the most attention, since systematic search of the universe is computationally impossible.
2.3 Reflexivity without anchor
Soros (1987) formalized reflexivity as the two-way causation between participant perception and underlying fundamentals, with each side feeding back into the other [25]. In conventional markets, the reflexive loop is bounded by the fundamental anchor: perception can drive price away from value temporarily, but mean reversion eventually reasserts. In memecoin markets, the reflexive loop has no anchor. Price moves driven by attention attract more attention, which produces more price moves, until the loop exhausts — not through reversion to value, but through the collapse of attention itself.
The Pump.fun bonding-curve mechanism makes this reflexivity mechanical rather than psychological. New tokens begin trading on a constant-product bonding curve where rising prices automatically trigger higher prices for subsequent buyers; the curve sells approximately eight hundred million tokens in sequence before the token graduates to a standard automated market maker at a market capitalization near sixty-nine thousand US dollars [7][26]. The mechanism converts attention directly into price, with no information-discovery process intervening. BIS Bulletin No. 69, authored by Cornelli, Doerr, Frost, and Gambacorta, characterizes the resulting market structure as "underlining the largely self-referential nature" of crypto as an asset class [16].
2.4 Holder concentration
The classical momentum indicators presuppose a diffuse holder base whose collective behavior creates the price series through small individual decisions aggregated through a continuous auction. Memecoin holder structure systematically violates this assumption.
The clearest documented case remains the TRUMP token launch on January 17, 2025. Eight hundred million of the one billion tokens — 80% of total supply — were held at launch by CIC Digital LLC and Fight Fight Fight LLC [1]. At-launch concentration of this magnitude breaks the diffuse-holder-base assumption underlying every classical technical-analysis tool. Whatever the relative strength index reads on a TRUMP price series in the days following launch, the underlying price series is not produced by an aggregate of independent buyers and sellers; it is produced by the disposition decisions of two related entities.
The TRUMP case is the most extreme documented launch concentration but is not anomalous in structural type. Tokens deployed through bonding-curve launchpads typically retain large fractions of supply with deployer or affiliated wallets through the curve phase. Across the major Solana bonding-curve launchpads — Pump.fun, Letsbonk, and Launchlab — approximately 89% of deployed tokens reach final market capitalizations below $50,000 per Step Data analysis at 2025-Q3 [27]. The median holder distribution at any point in the curve phase remains heavily concentrated. The empirical companion to this report will compute universe-level holder-concentration distributions directly from Solscan and Etherscan; the structural argument requires only the observation that the diffuse-holder-base assumption is violated in the modal memecoin, not merely in outlier cases such as TRUMP.
2.5 Automated-market-maker microstructure
The classical indicators were validated on order-book markets with continuous two-sided quoting by market makers responding to information. Memecoins predominantly trade on automated market makers — Raydium and PumpSwap on Solana, Uniswap on Ethereum — where bid and ask are replaced by a constant-product curve. Price is no longer the marginal valuation of the latest order; it is the algorithmic output of the curve given the current pool inventory. Slippage scales with order size relative to pool depth, meaning the same buy order can produce different prices on different days depending on the pool's liquidity state.
The automated-market-maker price series carries no theoretical claim to information aggregation. It is the mechanical consequence of constant-product mathematics. Solidus Labs documented in May 2025 that across the more than seven million tokens deployed on Pump.fun between January 2024 and March 2025, only approximately ninety-seven thousand maintained pool liquidity above $1,000, leaving 98.6% of the deployed universe with pool depths too thin for meaningful price discovery [5]. SolanaFloor reported separately that 74.6% of liquidity pools migrated from Pump.fun to Raydium upon graduation were subsequently inactive [28]. Wilder's relative strength index applied to such a series computes range distribution on a price generated by inventory mechanics on a near-empty pool, rather than by aggregated belief on a deep order book.
Chapter 3 · The Empirical Protocol
The structural arguments in Chapter 2 establish that memecoin price generation differs from the markets the classical indicators were designed for. Whether and how this difference manifests in indicator readings is an empirical question. This chapter specifies the methodology Bitbase Research applies to that question; the chapter's empirical findings will be released as updates to this paper once the data pipeline produces statistically conclusive results.
3.1 Sample universe construction
The proposed universe is drawn from the top two hundred tokens by market capitalization classified under the "meme" taxonomy tag on CoinGecko, restricted to Ethereum and Solana as the two dominant memecoin venues at the snapshot date. The filters applied at each rebalance date are: trailing seven-day average combined decentralized and centralized exchange volume above $1 million, minimum 30 days of price history before the observation date, and minimum primary-venue pool depth of $100,000.
These thresholds exclude the overwhelming mass of the Pump.fun token universe. Solidus Labs documented that across the more than seven million Pump.fun tokens deployed between January 2024 and March 2025 with at least five trades each, only approximately 97,000 maintained the $1,000 liquidity floor [5]. The graduation rate from Pump.fun's bonding curve to a standard automated market maker averaged 0.78% in 2025-Q2 [6] and remained in the 0.7%–0.8% range during July and August 2025 [7]. The proposed universe captures the surviving tradable subset above the liquidity floor; the discarded mass enters the analysis only through the survival-bias correction discussed below.
3.2 Survival bias correction
Any backtest drawn at the May 22, 2026 snapshot date contains only tokens that survived to that date. These survivors are by construction the right tail of a heavy-tailed return distribution. The Solidus Labs figure — 98.6% Pump.fun failure rate — is the headline reason naive backtests systematically overstate indicator efficacy [5].
The mitigation methodology is point-in-time universe reconstruction. At each weekly rebalance date, the universe is reconstructed as it would have appeared on that date, including tokens that subsequently failed. CoinGecko's and CoinMarketCap's historical snapshot APIs permit this reconstruction at weekly frequency; Kaiko provides point-in-time order-book and pool-state data at higher frequency. Without point-in-time reconstruction, any reported indicator hit rate is upward-biased by the magnitude of the period failure rate.
3.3 Backtest windows
Three regimes are tested separately, reflecting the structural changes in memecoin market microstructure documented in Chapter 2.
The pre-Pump.fun memecoin season covers January 2023 through January 2024, spanning the BONK launch on December 25, 2022, the PEPE launch in April 2023, and the WIF launch on November 20, 2023. Market structure in this period featured launches via direct decentralized exchange listing without bonding-curve intermediation; holder concentration data is sparser but accessible through Etherscan and Solscan archives.
The Pump.fun era covers January 2024 through January 2025, beginning at the Pump.fun launch date of January 19, 2024 [24]. This period saw the industrialization of memecoin creation through bonding-curve launchpads, the GOAT-led AI memecoin sub-cycle in October and November 2024, and a transition in median time-to-peak from weeks to days.
The political-memecoin era covers January 2025 through May 2026, beginning with the TRUMP launch on January 17, 2025 [1] and the MELANIA launch on January 19, 2025. This period features extreme launch-stage concentration, formal SEC guidance via the February 27, 2025 staff statement [3], and a sustained increase in average per-token leverage available through Perpetual Futures venues.
3.4 Indicator parameters
The default canonical parameters are used without optimization: relative strength index at fourteen periods, moving-average convergence-divergence at twelve, twenty-six, and nine, stochastic oscillator at fourteen, three, and three, and the momentum indicator at ten periods. The question this study tests is whether the canonical-parameter indicators behave consistently on memecoins relative to the assets they were calibrated for. Optimization invites data-snooping bias per Park and Irwin [14], and a memecoin-specific recalibration is not the question — the question is whether the same tools that read information-driven price action read attention-driven price action equivalently.
3.5 Statistical tests
For each indicator signal triggered on each asset over each backtest window, the following statistics are computed: directional accuracy of the next-N-day return for N in one, three, seven, and fourteen days, against the unconditional next-N-day directional probability for the same asset and window; cumulative excess return after transaction costs of thirty basis points per decentralized exchange swap, ten basis points per centralized exchange trade, and a fifty-basis-point slippage haircut for memecoin trades reflecting automated-market-maker curvature; Granger causality between the Google Trends abnormal-search-volume index computed per Da, Engelberg, and Gao [18] and price changes at one-day and one-hour aggregation; the White (2000) reality check to control for data-snooping bias across the full parameter grid [29].
3.6 Control assets
The same indicator family is applied to Bitcoin, Ether, and Solana over identical windows. Park and Irwin's documented asymmetry between equities, where technical analysis underperforms, and foreign exchange and futures, where it overperforms [14], suggests that crypto majors should occupy an intermediate position on this spectrum. The empirical hypothesis is that memecoins occupy a distinct fourth point on the spectrum: not noise-dominated like a random walk, but information-poor in a structured way that the canonical indicators were never designed to read.
3.7 The published baseline
Detzel, Liu, Strauss, Zhou, and Zhu (2021) is the closest published analog to the proposed study [30]. The paper documents that ratios of price to moving averages forecast Bitcoin returns both in-sample and out-of-sample, with similar predictive effects observed in NASDAQ dot-com stocks and low-analyst-coverage equities. The theoretical foundation is an equilibrium-learning model in which agents learn slowly about hard-to-value fundamentals, and technical analysis aggregates the slow-learning dynamic. Whether the same theoretical structure applies to assets with no fundamentals at all is the gap Bitbase's empirical work aims to address.
Liu, Tsyvinski, and Wu (forthcoming, Journal of Financial and Quantitative Analysis) establish a trend factor for the cross-section of cryptocurrency returns, demonstrating that time-series momentum persists in the broader cryptocurrency universe [31]. The paper explicitly excludes thinly traded tokens, leaving the memecoin tail unstudied. The methodological gap — the right cross-section to test memecoin technical indicators — is what this paper's empirical work aims to fill.
3.8 Empirical updates
The empirical results across the three regime windows, computed under the methodology specified above and corrected for multiple-comparison bias, will be released as updates to this paper once results have been validated against the published baseline from Detzel and co-authors [30] and Liu, Tsyvinski, and Wu [31]. Publishing the paper as a methodological framework in advance of the empirical numerical findings reflects an analytical priority: the structural argument is interpretable without the numbers, while the numbers without the structural argument would be ambiguous and easily misread.
Chapter 4 · Why Parameter Tuning Cannot Repair the Mismatch
The natural response to documented indicator underperformance in any market is to optimize parameters. The history of momentum-indicator extensions — from equity to commodity to foreign exchange to Bitcoin — is largely a history of parameter recalibration. Four mechanisms explain why this approach is insufficient for memecoins.
4.1 Price as information container versus attention container
A relative strength index reading of seventy on a US equity in 1978 was a statement about price displacement from a fundamental anchor: prices had moved far enough above their recent range that mean reversion was the central-tendency expectation. The same reading on a memecoin in 2026 is a statement about attention displacement: prices have moved far enough above their recent range that attention is at a local peak. The two readings carry the same number but describe different latent phenomena.
Parameter optimization — choosing a different smoothing window, a different threshold — cannot bridge this difference because the underlying signal is generated by a different process. A relative strength index window of fourteen days computed on a series generated by attention reflexivity returns a number that is a function of the attention process, not of the price-as-information process. Changing the window to seven or twenty-one days changes how much of the attention process is smoothed; it does not change the process being smoothed.
4.2 The reflexive loop has no external anchor
The conventional reflexive loop in capital markets, as Soros formalized it, is bounded by the fundamental [25]. Belief and price can diverge, but the divergence is constrained by the eventual return of price to value. The mean-reversion premise of every overbought-oversold indicator is downstream of this boundedness.
In memecoin markets, the reflexive loop has no external bound. Attention drives price, price drives attention, attention drives price. The loop terminates not through reversion but through depletion: the supply of attention is finite, and when it exhausts, the price collapses. This is not the mean reversion the indicators were designed to detect. It is a regime change, and oscillators that assume continuity of statistical regime cannot diagnose regime changes from within.
4.3 The mathematics of the indicator cannot see its input space
A relative strength index does not know whether it is being applied to corn futures, a NASDAQ equity, or a Solana memecoin. The mathematics is identical: compare recent up-closes to recent down-closes, normalize to a zero-to-one-hundred range, smooth. What the mathematics does not see is the data-generating process producing the input series. Parameter tuning operates on the smoothing window and the threshold; it does not operate on the input space.
If the input space has changed — if the price series is generated by a process the indicator's calibration was never trained on — no choice of parameters can recover the original calibration's relevance. This is the formal statement of why parameter tuning is insufficient. It is also the reason Chapter 5 proposes a different kind of departure: not retuning the indicators, but changing what is asked of them.
4.4 Automated-market-maker distortions
A final mechanism amplifies the structural mismatch. On automated-market-maker venues, the price series is generated by the constant-product equation given pool inventory state. A large buy order produces a price impact that scales nonlinearly with order size relative to pool depth. The classical indicators were validated on price series produced by order-book matching, where price moves reflect aggregated belief about value.
The price impact of a single $20,000 buy on a memecoin with a $1 million liquidity pool can move the price by roughly 2% purely through the curve mechanics, before any informational effect on subsequent traders. The relative strength index applied to such a series computes momentum statistics on a price trajectory that contains substantial liquidity-mechanics noise relative to belief-aggregation signal. This is an independent reason classical indicators read differently on memecoins; it interacts with the attention-reflexivity issue rather than displacing it.
Chapter 5 · A Three-Principle Observation Framework
The structural diagnosis in Chapters 2 and 4 implies that no recalibration of the classical indicators can produce a tool fit for memecoin markets. The path forward is not to apply the same tools with different parameters, but to apply different tools that are aware of their input space. Bitbase Research proposes three principles.
5.1 Cross-sectional ranking replaces fixed thresholds
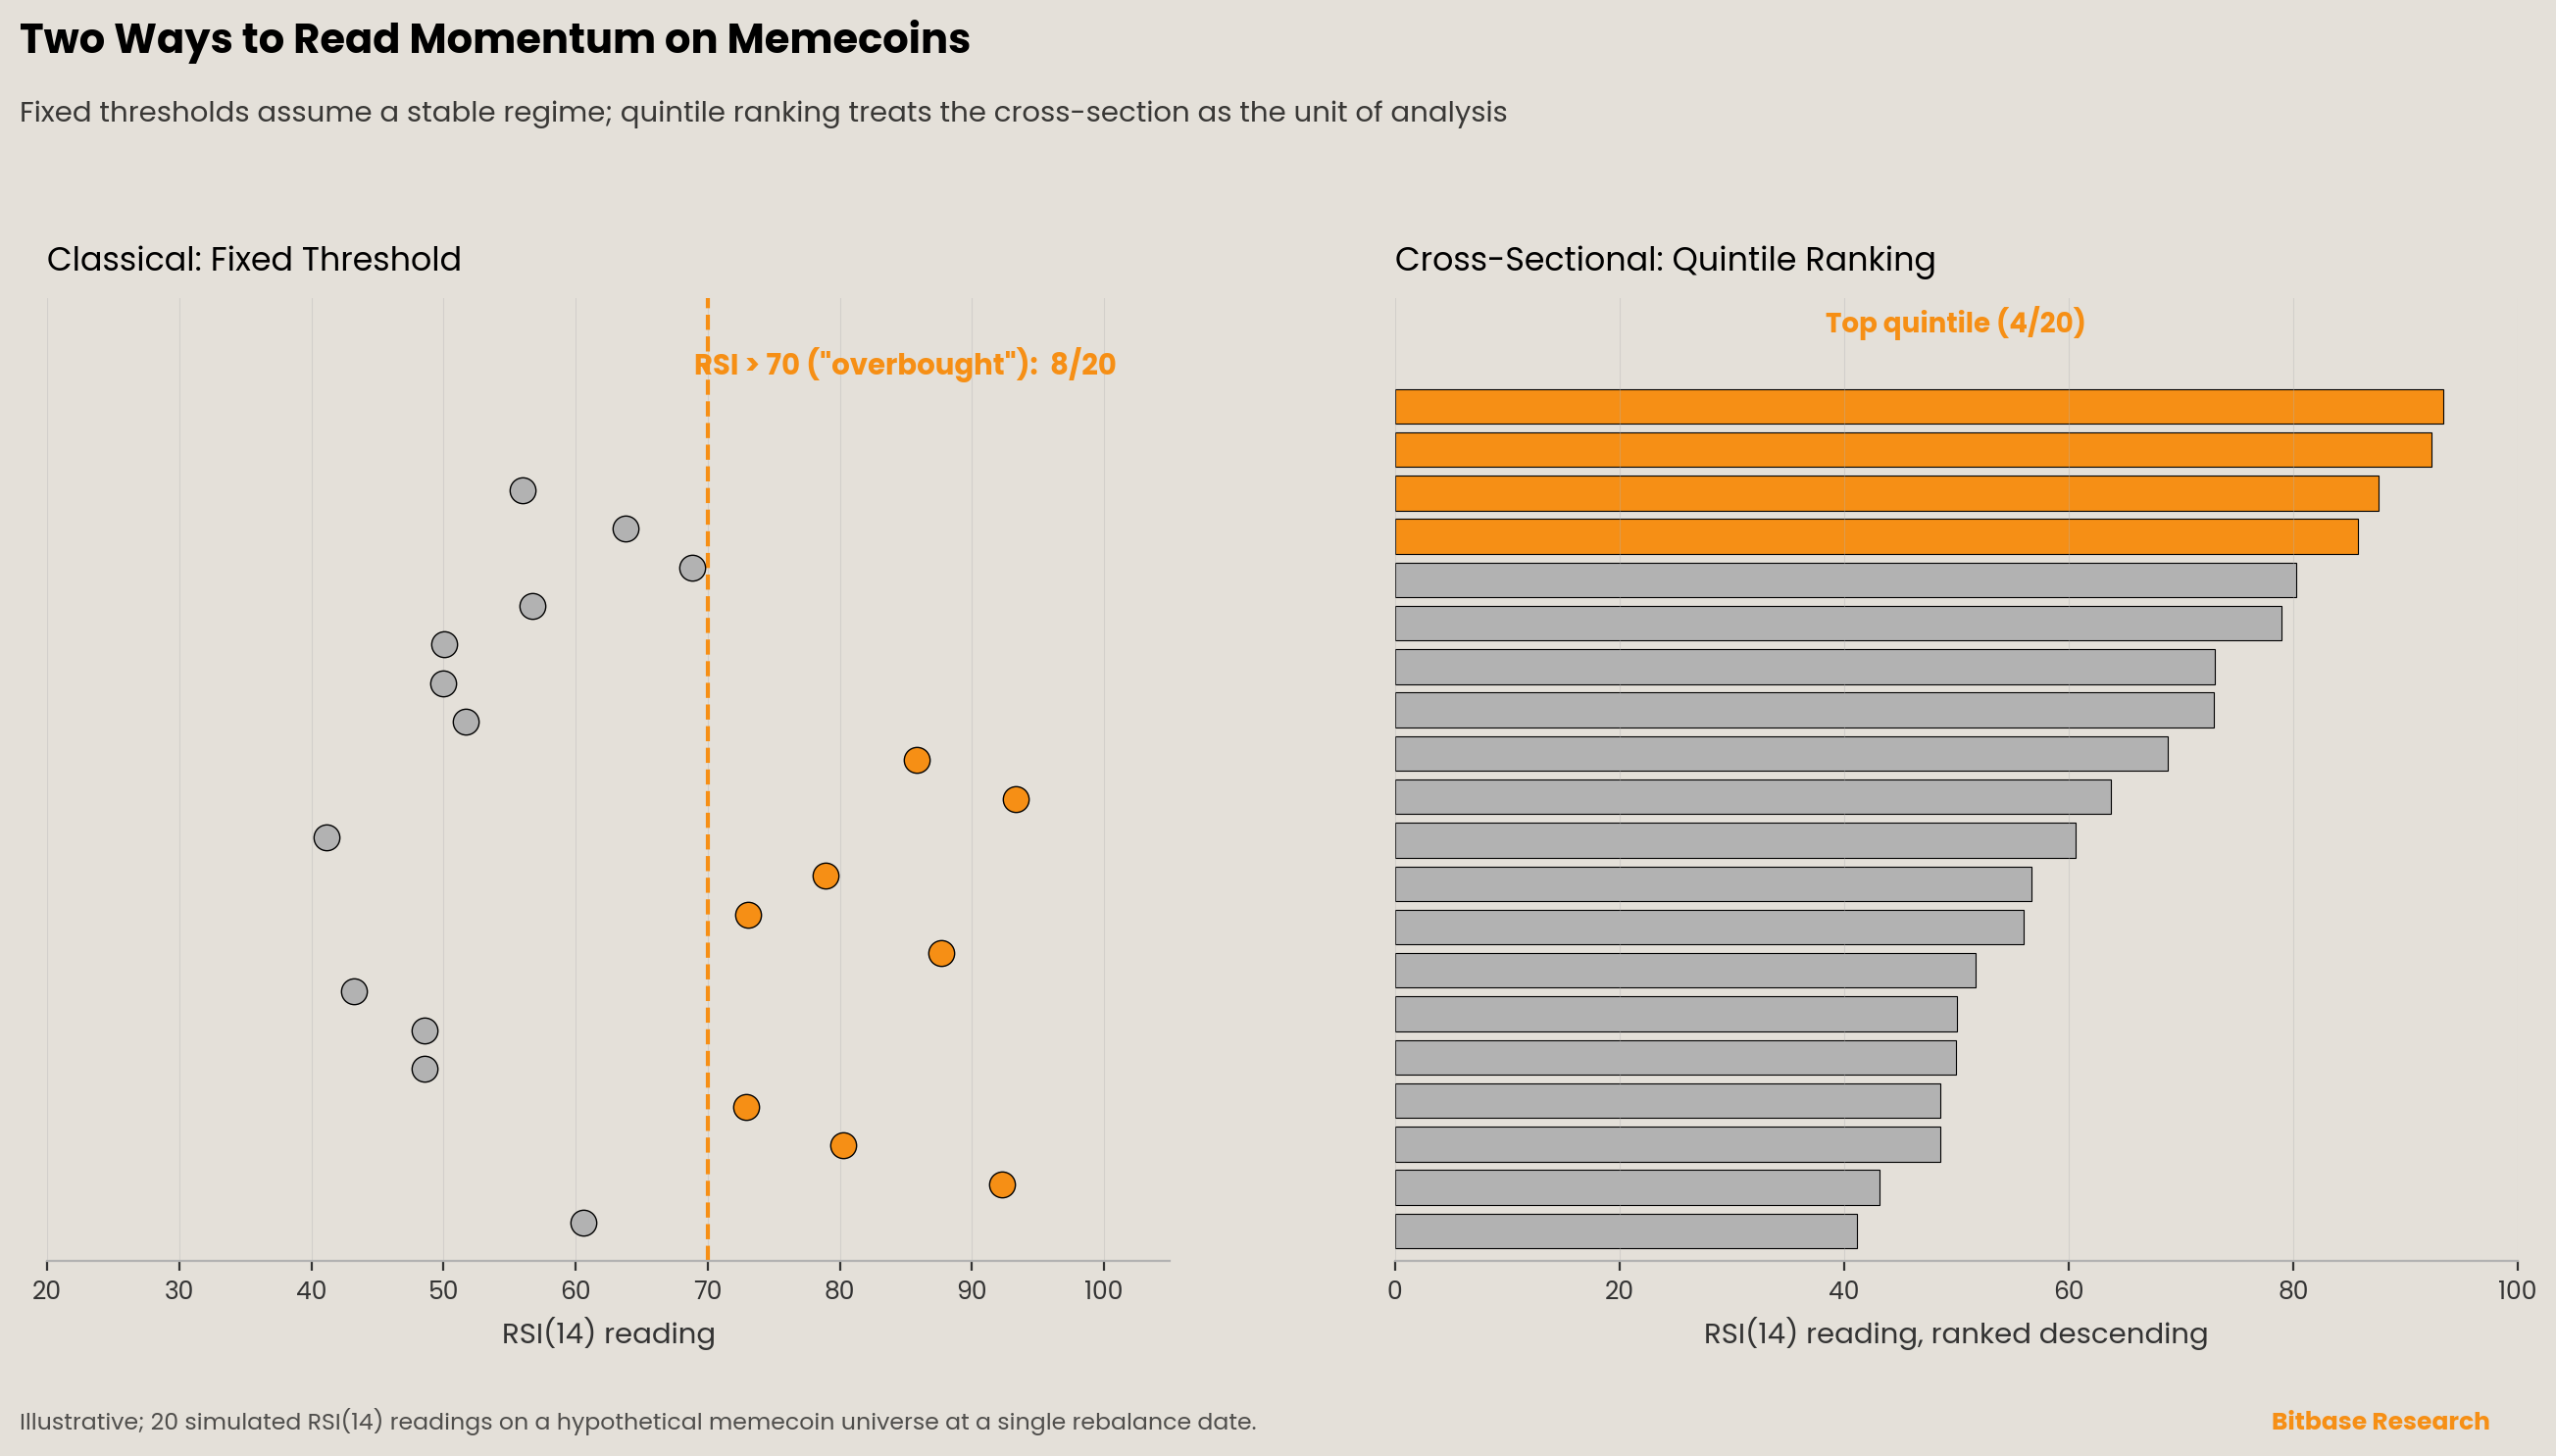
The first departure is to abandon fixed indicator thresholds — the relative strength index seventy and thirty, the moving-average convergence-divergence zero line — as primitives. These thresholds were calibrated on assets with stable statistical regimes; they have no analog in memecoin markets where the cross-section of returns is itself the unit of analysis.
The methodological precedent is the cross-sectional momentum literature established by Asness, Moskowitz, and Pedersen's 2013 Journal of Finance paper "Value and Momentum Everywhere," which documents cross-sectional momentum effects across eight asset classes by ranking assets within the cross-section rather than against absolute thresholds [17]. Liu, Tsyvinski, and Wu (2022) confirm the cross-sectional approach works for cryptocurrencies, with a momentum factor that operates on cross-sectional ranks rather than fixed levels [32].
For a memecoin observation framework, this means computing each indicator at each rebalance date, ranking the eligible universe by indicator value, and reporting quintile membership rather than overbought or oversold labels. An asset in the top quintile of fourteen-day relative-strength readings within the memecoin universe is not "overbought" in the Wilder sense; it is "ranked one through forty of two hundred" in attention-momentum space. The phrasing matters because it accurately describes what is being measured.
5.2 Attention and concentration variables on equal footing
The second departure is to stop treating the classical price-based indicators as the complete state space of momentum. Instead, momentum is measured across three variable families on equal footing: price-derived (the classical indicators), attention-derived (search-volume abnormality, social-mention abnormality), and holding-derived (top-ten holder share, the change in that share over the rebalance window).
The empirical justification combines three findings. Da, Engelberg, and Gao establish that abnormal search volume predicts equity-return overshoot-and-reversion [18]. Liu and Tsyvinski confirm attention proxies forecast cryptocurrency returns [15]. Shen, Urquhart, and Wang document that tweet volume Granger-causes Bitcoin volume and volatility, though not directly Bitcoin returns [19]. Kraaijeveld and De Smedt extend the analysis to nine cryptocurrencies and find Twitter sentiment Granger-causes returns for Bitcoin, Bitcoin Cash, and Litecoin, but not for Cardano, Stellar, Ripple, or Ether [33]. The pattern is consistent: attention measures lead activity universally and lead returns selectively. A framework that fails to incorporate attention measures misses a leading indicator of the activity surge that often precedes the return spike.
Holder concentration enters the framework because memecoin holding structure violates the diffuse-holder-base assumption of the classical indicators, as Section 2.4 documented. The change in top-ten holder share over a rebalance window captures whether controlling holders are accumulating — possibly preceding an attention push — or distributing — possibly preceding a collapse. Combining the three variable families into a composite cross-sectional rank produces an observation score that reflects the actual price-formation process of memecoin markets rather than the price-formation process of 1970s commodity futures.
5.3 Output is observation, not prediction
The third departure is the framing of the output. The cross-sectional rank of an asset within the memecoin universe at a given rebalance date is a statement about where that asset sits on the attention-momentum-concentration distribution at that moment. It is not a forecast of next-period return.
The distinction is not pedantic. Park and Irwin, in their meta-review of ninety-five technical-analysis studies, repeatedly identify data-snooping bias and survivor selection as the dominant sources of false positives in published technical-analysis research [14]. The honest framing of any cross-sectional rank in memecoin markets, given the 98.6% Pump.fun failure rate documented by Solidus Labs [5], is that the rank describes the surviving cross-section at the snapshot date. It tells nothing about which assets in the rank will survive the next week, or about the future returns of those that do.
The framework's output, in operational terms, is a five-quintile classification of the eligible memecoin universe at each rebalance date, with each asset's quintile assignment justified by the composite rank computation, and with explicit attached documentation of survival rates over the prior rebalance window. The user of this output forms their own view of what the rank implies; the framework does not impose an interpretation.
5.4 Boundary statement
This framework describes which assets in the memecoin universe rank highly across attention-momentum, price-momentum, and concentration-momentum dimensions at the rebalance date specified in each output, computed under the methodology specified above. It does not describe which assets should be bought, sold, held, or avoided. The cross-sectional rank carries no claim about future price direction or magnitude. Memecoin markets exhibit survival rates documented at under 2% on the largest creation platform [5]; rank position within the surviving cross-section at any point in time does not modify this base rate. Any application of this framework that elides the survival base rate is misuse of the framework.
Chapter 6 · Reverse Self-Examination
This analysis rests on a particular structural claim — that memecoin price formation is attention-reflexive rather than information-discounting — and on the empirical literature supporting that claim. The strongest objections deserve direct statement.
The first objection is that the structural claim overstates the difference between memecoins and other no-fundamentals assets such as collectibles, distressed-equity warrants, or speculative initial public offerings that traded on extreme retail attention before recovering or failing. If memecoins are simply the latest entry in a long history of no-fundamentals speculation, classical indicators may underperform on memecoins in the same way they underperformed on dot-com-era equities — a documented effect, but one that did not produce the categorical break this analysis proposes. The response: the automated-market-maker microstructure and the industrialized attention-launchpad mechanism, both novel since 2024, produce a quantitatively different regime. The supply of tradable memecoins is not constrained by underwriting or by issuer balance sheets in the way collectibles or initial public offerings are; the volume of new memecoin supply observed at the May 22, 2026 snapshot date has no historical analog.
The second objection is that this paper presents a methodological framework without supporting empirical results from Bitbase's own backtest pipeline. A skeptical reader might reasonably object that a methodological foundation without empirical confirmation is incomplete. The response: the structural argument stands independent of empirical confirmation, and publishing empirical results in advance of the methodological foundation would reverse the appropriate evidentiary order. The empirical update to this paper is the next step in the analytical sequence, not its rebuttal.
The third objection is that the three-principle framework, especially the cross-sectional ranking approach, has the same structural risk as the classical indicators: it tells the user something about position within a distribution but not about future returns. This is correct, and is the framework's explicit boundary statement rather than a hidden flaw. The framework is an observation tool, not a prediction tool. A user who applies it as a prediction tool will misuse it; the framework's documentation should make this difficult to do unknowingly.
The fourth objection is that "honest observation framework" reads as a stalking horse for "signal we are willing to defend in court but not in trading." The direct answer: the framework is designed to be defensible by being descriptive rather than predictive. The descriptive framing is not a legal evasion but a substantive recognition of what is and is not knowable about memecoin markets at the May 22, 2026 snapshot date. If future empirical literature establishes predictive structure in this domain, the framework can be revised. The current state of the published literature, including Bitbase's own anticipated empirical work, does not support such structure.
Chapter 7 · Reverse Signals
The core claims in this paper are falsifiable. Bitbase Research will revisit the framework if any of the following findings emerge from the empirical literature or from Bitbase's own backtests.
If a peer-reviewed study, or Bitbase's own backtest across at least fifty memecoins, demonstrates that the canonical-parameter relative strength index at fourteen periods and moving-average convergence-divergence at twelve, twenty-six, and nine produce directional accuracy on memecoin price series within five percentage points of their accuracy on Bitcoin, Ether, and Solana over the same window, at statistical significance of 1%, the structural-failure thesis is invalidated.
If a memecoin-specific parameter recalibration is published that produces stable risk-adjusted excess returns over a transaction-cost-corrected out-of-sample test, with survivor-bias correction and the White (2000) reality check applied [29], the claim that parameter tuning cannot repair the mismatch is invalidated.
If empirical work demonstrates that memecoin returns are explainable by an extension of the Fama–French factor structure with explanatory power above 30% R-squared, the absence-of-fundamentals thesis is invalidated.
If Granger causality tests on the proposed memecoin universe demonstrate that abnormal search volume and social-mention abnormality do not lead memecoin price changes at statistical significance of 10%, the second principle of the proposed observation framework loses its empirical justification.
These conditions are stated to facilitate falsification rather than to insulate the analysis from critique.
Chapter 8 · Methodology and Disclosure
8.1 Research scope and limitations
This paper provides a methodological framework for observing memecoin markets, grounded in the published literature on classical momentum indicators, behavioral finance, and cryptocurrency markets. The empirical chapter specifies the proposed backtest protocol; numerical findings will be released as updates to this paper. The asset universe analyzed is memecoins traded on Ethereum and Solana at the May 22, 2026 snapshot date; conclusions do not extend to non-fungible tokens, stablecoins, governance tokens, or memecoin contracts on Binance Smart Chain, Base, Tron, or other venues not covered.
8.2 Data recency
All market data, price quotations, holder-concentration figures, and citation timestamps are anchored to the May 22, 2026 snapshot date. Where a data point pre-dates this snapshot, the data point's own timestamp is stated explicitly. Where a citation refers to a working paper or forthcoming publication, the cited document's status as of the snapshot date is stated. Subsequent revisions to cited literature will not be reflected in this version.
8.3 Research independence
This research was produced by Bitbase Research without external commercial sponsorship. The choice of asset classes, indicator families, and methodological priorities reflects the research team's editorial independence.
8.4 Conflict-of-interest disclosure
Bitbase operates a centralized cryptocurrency exchange. The platform supports spot trading and Perpetual Futures trading in a range of digital assets. Some assets discussed in this paper — including but not limited to DOGE, SHIB, PEPE, BONK, WIF, and TRUMP — are listed on Bitbase or may be listed on Bitbase in the future. This disclosure does not modify any conclusion in the paper.
8.5 Tools and generation assistance
This paper was drafted with AI-assisted literature search and outlining. Every citation in the references list has been manually verified against primary sources. Every numerical claim has been traced to its primary source. The argument structure, the reverse-self-examination chapter, the reverse-signals chapter, and the three-principle observation framework reflect the editorial judgment of Bitbase Research staff.
8.6 Non-investment-advice statement
This paper is research for educational and analytical purposes. Nothing in it constitutes investment advice, a recommendation to buy or sell any digital asset, a solicitation, or an offer. Bitbase Research does not predict future price action. Cryptocurrency assets, and memecoins in particular, exhibit volatility and survival rates documented in this paper. Readers should consult qualified financial and legal advisors before making investment decisions.
8.7 Forward-looking statements
The paper contains forward-looking references to empirical updates to the methodology specified in Chapter 3. The publication of these updates is planned; their timing, scope, and final form are subject to data-pipeline progress and quality-assurance review. No commitment is made regarding the conclusions of the empirical updates beyond the methodological framework specified in this paper.
References
[1] Wikipedia, "$Trump (cryptocurrency)," accessed May 22, 2026, citing Axios reporting January 18, 2025 on CIC Digital LLC and Fight Fight Fight LLC concentration. https://en.wikipedia.org/wiki/%24Trump
[2] Coinbase, "OFFICIAL TRUMP price page" (live snapshot accessed May 22, 2026; all-time high $74.27 on January 19, 2025). https://www.coinbase.com/price/official-trump
[3] SEC Division of Corporation Finance, "Staff Statement on Meme Coins," February 27, 2025. https://www.sec.gov/newsroom/speeches-statements/staff-statement-meme-coins
[4] Crenshaw, Caroline A., "Response to Staff Statement on Meme Coins: What Does it Meme?," U.S. Securities and Exchange Commission, February 27, 2025. https://www.sec.gov/newsroom/speeches-statements/crenshaw-response-staff-statement-meme-coins-022725
[5] Solidus Labs, The 2025 Rug Pull Report: Rug Pulls and Pump-and-Dumps on Solana, May 2025 (7,050,000 Pump.fun tokens with ≥5 trades January 2024 – March 2025; ~97,000 maintained ≥$1,000 liquidity; 98.6% failure rate; 388,000 Raydium pools examined, 93% soft-rug pattern). https://www.soliduslabs.com/reports/solana-rug-pulls-pump-dumps-crypto-compliance
[6] Step Data, "Letsbonk Claims 82% of Bonding Curve Volume: How It Won the Solana Launchpad War," 2025 (Pump.fun average graduation rate 0.78% 2025-Q2; ~89% of bonding-curve tokens reach final market cap below $50,000). https://stepdata.substack.com/p/letsbonk-claims-82-of-bonding-curve
[7] Cointelegraph, "How Pump.fun captured 80% of Solana memecoins, and can it last?," 2025 (graduation rate 0.7%–0.8% July–August 2025; ~$69K market-cap graduation threshold; ~800M token bonding-curve sequence). Republished via TradingView. https://tr.tradingview.com/news/cointelegraph:9c3a24b10094b:0-how-pump-fun-captured-80-of-solana-memecoins-and-can-it-last
[8] Wilder, J. W., New Concepts in Technical Trading Systems, Greensboro, NC: Trend Research, 1978.
[9] Appel, G., The Moving Average Convergence Divergence Trading Method, Great Neck, NY: Signalert Corp, 1979.
[10] Appel, G., Technical Analysis: Power Tools for Active Investors, Upper Saddle River, NJ: Financial Times Prentice Hall, 2005.
[11] Lane, G. C., The Stochastic Process, Chicago: Investment Educators Inc., 1957 (internal course material).
[12] Lane, G. C., "Lane's Stochastics," Technical Analysis of Stocks & Commodities, 2(3), May/June 1984, 87–90.
[13] Jegadeesh, N., and Titman, S., "Returns to Buying Winners and Selling Losers: Implications for Stock Market Efficiency," Journal of Finance, 48(1), 65–91, 1993. https://doi.org/10.1111/j.1540-6261.1993.tb04702.x
[14] Park, C.-H., and Irwin, S. H., "What Do We Know About the Profitability of Technical Analysis?," Journal of Economic Surveys, 21(4), 786–826, 2007. https://doi.org/10.1111/j.1467-6419.2007.00519.x
[15] Liu, Y., and Tsyvinski, A., "Risks and Returns of Cryptocurrency," Review of Financial Studies, 34(6), 2689–2727, 2021. https://doi.org/10.1093/rfs/hhaa113
[16] Cornelli, G., Doerr, S., Frost, J., and Gambacorta, L., "Crypto shocks and retail losses," BIS Bulletin No. 69, Bank for International Settlements, February 20, 2023. https://www.bis.org/publ/bisbull69.htm
[17] Asness, C. S., Moskowitz, T. J., and Pedersen, L. H., "Value and Momentum Everywhere," Journal of Finance, 68(3), 929–985, 2013. https://doi.org/10.1111/jofi.12021
[18] Da, Z., Engelberg, J., and Gao, P., "In Search of Attention," Journal of Finance, 66(5), 1461–1499, 2011. https://doi.org/10.1111/j.1540-6261.2011.01679.x
[19] Shen, D., Urquhart, A., and Wang, P., "Does Twitter predict Bitcoin?," Economics Letters, 174, 118–122, 2019. https://doi.org/10.1016/j.econlet.2018.11.007
[20] Schade, G. A. Jr., CMT, "The Origins of the Stochastic Oscillator," CMT Association Technically Speaking, May 2011.
[21] Maitah, M., Procházka, P., Cermak, M., and Šrédl, K., "Improving MACD Technical Analysis by Optimizing Parameters and Modifying Trading Rules: Evidence from the Japanese Nikkei 225 Futures Market," Journal of Risk and Financial Management, 14(1), 37, MDPI, 2021. https://doi.org/10.3390/jrfm14010037
[22] Barber, B. M., and Odean, T., "All That Glitters: The Effect of Attention and News on the Buying Behavior of Individual and Institutional Investors," Review of Financial Studies, 21(2), 785–818, 2008. https://doi.org/10.1093/rfs/hhm079
[23] Decrypt (Phillips, D.), "Pump.fun Token Tops $2 Billion in Market Cap Following Massive ICO," July 2025 (citing Dune Analytics on cumulative token deployment count). https://decrypt.co
[24] Wikipedia, "pump.fun," accessed May 22, 2026 (platform launch January 19, 2024). https://en.wikipedia.org/wiki/Pump.fun
[25] Soros, G., The Alchemy of Finance, New York: Simon & Schuster, 1987.
[26] Block Magnates (Patel, P.), "Bonding Curves in Solana," November 2025 (Pump.fun bonding-curve graduation threshold ~$69K market cap; 800M tokens in curve sequence; mathematics of constant-product mechanics). https://blog.blockmagnates.com/bonding-curves-in-solana-58082354b17d
[27] Step Data, 2025-Q3 platform-comparison analysis: across Pump.fun, Letsbonk, and Launchlab, approximately 89% of deployed tokens reach final market capitalization below $50,000. https://stepdata.substack.com/p/letsbonk-claims-82-of-bonding-curve
[28] SolanaFloor, "Over $287M in SOL Removed from Circulation via Pump.fun's Graduated Token Mechanism," February 11, 2025 (74.6% of liquidity pools migrated from Pump.fun to Raydium upon graduation subsequently inactive; ~93,500 tokens graduated by date of report). https://solanafloor.com/news/over-287-m-in-sol-removed-from-circulation-via-pump-fun-s-graduated-token-mechanism
[29] White, H., "A Reality Check for Data Snooping," Econometrica, 68(5), 1097–1126, 2000. https://doi.org/10.1111/1468-0262.00152
[30] Detzel, A., Liu, H., Strauss, J., Zhou, G., and Zhu, Y., "Learning and predictability via technical analysis: Evidence from bitcoin and stocks with hard-to-value fundamentals," Financial Management, 50(1), 107–137, 2021. https://doi.org/10.1111/fima.12310
[31] Liu, Y., Tsyvinski, A., and Wu, X., "A Trend Factor for the Cross Section of Cryptocurrency Returns," forthcoming, Journal of Financial and Quantitative Analysis.
[32] Liu, Y., Tsyvinski, A., and Wu, X., "Common Risk Factors in Cryptocurrency," Journal of Finance, 77(2), 1133–1177, 2022. https://doi.org/10.1111/jofi.13119
[33] Kraaijeveld, O., and De Smedt, J., "The predictive power of public Twitter sentiment for forecasting cryptocurrency prices," Journal of International Financial Markets, Institutions and Money, 65, 101188, 2020. https://doi.org/10.1016/j.intfin.2020.101188
[34] CoinDesk, "Most Influential 2025: Pump.fun" (profile feature documenting Pump.fun's role in 2025 memecoin cycle), December 10, 2025. https://www.coindesk.com/most-influential/2025/pump-fun
[35] Cointelegraph (republished via MEXC News), "Pump.fun's 80% Grip on Solana Memecoins" (peak Pump.fun share 75%–80%; LP-token-burn graduation mechanics; 0.015 SOL graduation fee). https://www.mexc.com/news/121383
[36] FSB (Financial Stability Board), "Global Regulatory Framework for Crypto-asset Activities" and "Revised Recommendations for Global Stablecoin Arrangements," July 17, 2023. https://www.fsb.org/2023/07/fsb-global-regulatory-framework-for-crypto-asset-activities/
[37] IOSCO (International Organization of Securities Commissions), Policy Recommendations for Crypto and Digital Asset Markets — Final Report, FR/11/2023, IOSCOPD747, November 16, 2023. https://www.iosco.org/library/pubdocs/pdf/IOSCOPD747.pdf
[38] IOSCO, Thematic Review: Assessing the Implementation of IOSCO Recommendations for Crypto and Digital Asset Markets, FR/13/2025, IOSCOPD801, October 16, 2025. https://www.iosco.org/library/pubdocs/pdf/IOSCOPD801.pdf
[39] Regulation (EU) 2023/1114 of the European Parliament and of the Council of 31 May 2023 on markets in crypto-assets (MiCA), Official Journal of the European Union, June 9, 2023. https://eur-lex.europa.eu/legal-content/EN/TXT/?uri=CELEX:32023R1114
[40] European Securities and Markets Authority, "Q&A 2552 on Regulation (EU) 2023/1114 (MiCA)," ESMA Interactive Single Rulebook, February 18, 2026.