Publication date: April 17, 2026
Preface
Over the nine years from 2016 to 2025, the crypto market experienced at least three complete boom-bust cycles. Each cycle was accompanied by the evaporation of billions to tens of billions of dollars in value: the 2017–2018 ICO bubble’s $17.8 billion funding market collapsed to near zero within twelve months; in 2022, Terra/Luna erased approximately $50 billion in three days, FTX misappropriated $8 billion in customer funds, and Celsius left a $4.7 billion customer claims gap; in 2024–2025, 98% of tokens on the pump.fun platform collapsed within 24 hours, and non-insider $TRUMP traders collectively lost approximately $2 billion.
These events are typically categorized under separate narrative frameworks — “scam,” “bubble,” “technical failure,” or “regulatory gap.” This report proposes a different analytical lens: the above phenomena share a common set of structural preconditions that can be unified under a single three-layer nested theoretical framework.
-
The base layer is information asymmetry — the private information held by project teams, exchanges, market makers, and stablecoin issuers about their own actions and asset positions far exceeds what their users and investors can observe.
-
The middle layer is principal-agent conflict — under conditions of information asymmetry, the incentive structures of agents with decision-making authority (exchange operators, fund managers, token designers, protocol builders) systematically deviate from the interests of principals (users, investors, token holders).
-
The top layer is information cascades — once information asymmetry eliminates ex ante identification mechanisms and agency structures have embedded value-transfer pathways, the transparency of on-chain data and the speed of social media allow capital to be directionally channeled toward specific targets within extremely short time windows.
This report selects ten landmark case studies to test this framework: the ICO bubble, the Memecoin Casino, and airdrop farming (information cascade dimension); BitConnect, Three Arrows Capital, Celsius, and FTX (principal-agent collapse dimension); Terra/Luna algorithmic stablecoins, tokenomics failures, and MEV (mechanism design failure dimension). Each case study is based on public regulatory filings, court judgments, academic empirical evidence, and on-chain data, without reliance on anonymous sources or unverified industry rumors.
It must be stated clearly: this report analyzes failure cases and failure mechanisms. Well-functioning agency structures also exist in the crypto market — registered broker-dealer compliant exchanges, stablecoin issuers that maintain audit transparency, and protocols that demonstrate incentive-compatible design. This report’s analytical framework aims to identify the preconditions that produce systemic value transfer and should not be interpreted as a blanket negative judgment on the crypto market as a whole.
This report shares part of its theoretical foundation with Bitbase Research Deep Dive Issue I, The Bifurcation of Crypto DerivativesInfrastructure, but is independent in its analytical subject and core thesis. Chapter 1 establishes the three theoretical pillars and their nested structure; Chapters 2 through 4 test the framework’s explanatory power through case studies; Chapter 5 proposes diagnostic and corrective pathways based on the framework, and honestly discusses their limitations.
Chapter 1 · Theoretical Framework: An Academic Map of Three Failure Mechanisms
1.1 Opening · A Forty-Minute Market Cap Curve
On the evening of February 14, 2025, Argentine time, the smart contract for token $LIBRA was deployed on Solana’s Meteora trading pool. Three minutes later, then-Argentine President Javier Milei posted on his X account, describing the token as a private project for Argentine small businesses. Within approximately forty minutes of the post, buy orders pushed $LIBRA’s circulating market cap from near zero to approximately $4.5 billion; its price surged from millionths of a dollar to approximately $5.20.[¹][²] Over 40,000 wallets participated in the buying [15].
Over the following eleven hours, the market cap collapsed in reverse. Eight insider wallets linked to project deployer Kelsier Ventures extracted a combined approximately $107 million [15] (comprising 57.6 million USDC plus approximately 249,700 SOL) by removing liquidity and collecting fees. By the morning of February 15, $LIBRA’s circulating market cap had fallen to approximately $257 million, a drawdown of approximately 94% from its peak. Milei subsequently deleted his post. On-chain analytics firm Nansen [16] reported that in a sample of participating wallets, approximately 114,000 wallets showed combined unrealized losses of approximately $251 million, with roughly 86% of traders at a loss upon liquidation. Argentina’s federal judiciary subsequently accepted criminal complaints regarding the token, and the investigation into Milei remained ongoing at the time of this report’s writing.
This event was not an anomaly. The $TRUMP token launched on January 17, 2025, and $MELANIA on January 19 exhibited isomorphic trajectories: both reached multi-billion-dollar circulating market caps within one to two days, then retraced over 90% within weeks to months. Chainalysis’s on-chain analysis commissioned by the New York Times [17] showed that non-insider $TRUMP traders collectively lost approximately $2 billion. From $TRUMP to $LIBRA — within twenty-six days, three market cap curves triggered by celebrities or a sitting head of state, completing their entire boom-bust cycle within extremely short time windows — placed the same question before researchers: under the specific structural conditions of the crypto market, why can large-scale capital be systematically allocated to targets with negative expected returns?
This chapter’s purpose is to extract from the economics literature the three theoretical pillars needed to answer this question, and to demonstrate how they nest into a complete analytical framework.
[¹]: Different sources report the peak timing with variations of several minutes. This section uses “within approximately forty minutes” as a conservative interval; second-level timestamps depend on further verification from on-chain DEX data.
[²]: Some price aggregation platforms (e.g., CoinGecko) record $LIBRA’s all-time high significantly below the above figure. This discrepancy should be attributed to aggregation platforms beginning data collection later than the actual on-chain peak. This section uses on-chain DEX data and mainstream media statistics based on on-chain data as primary sources.
1.2 Information Cascades · Why Private Signals Are Abandoned
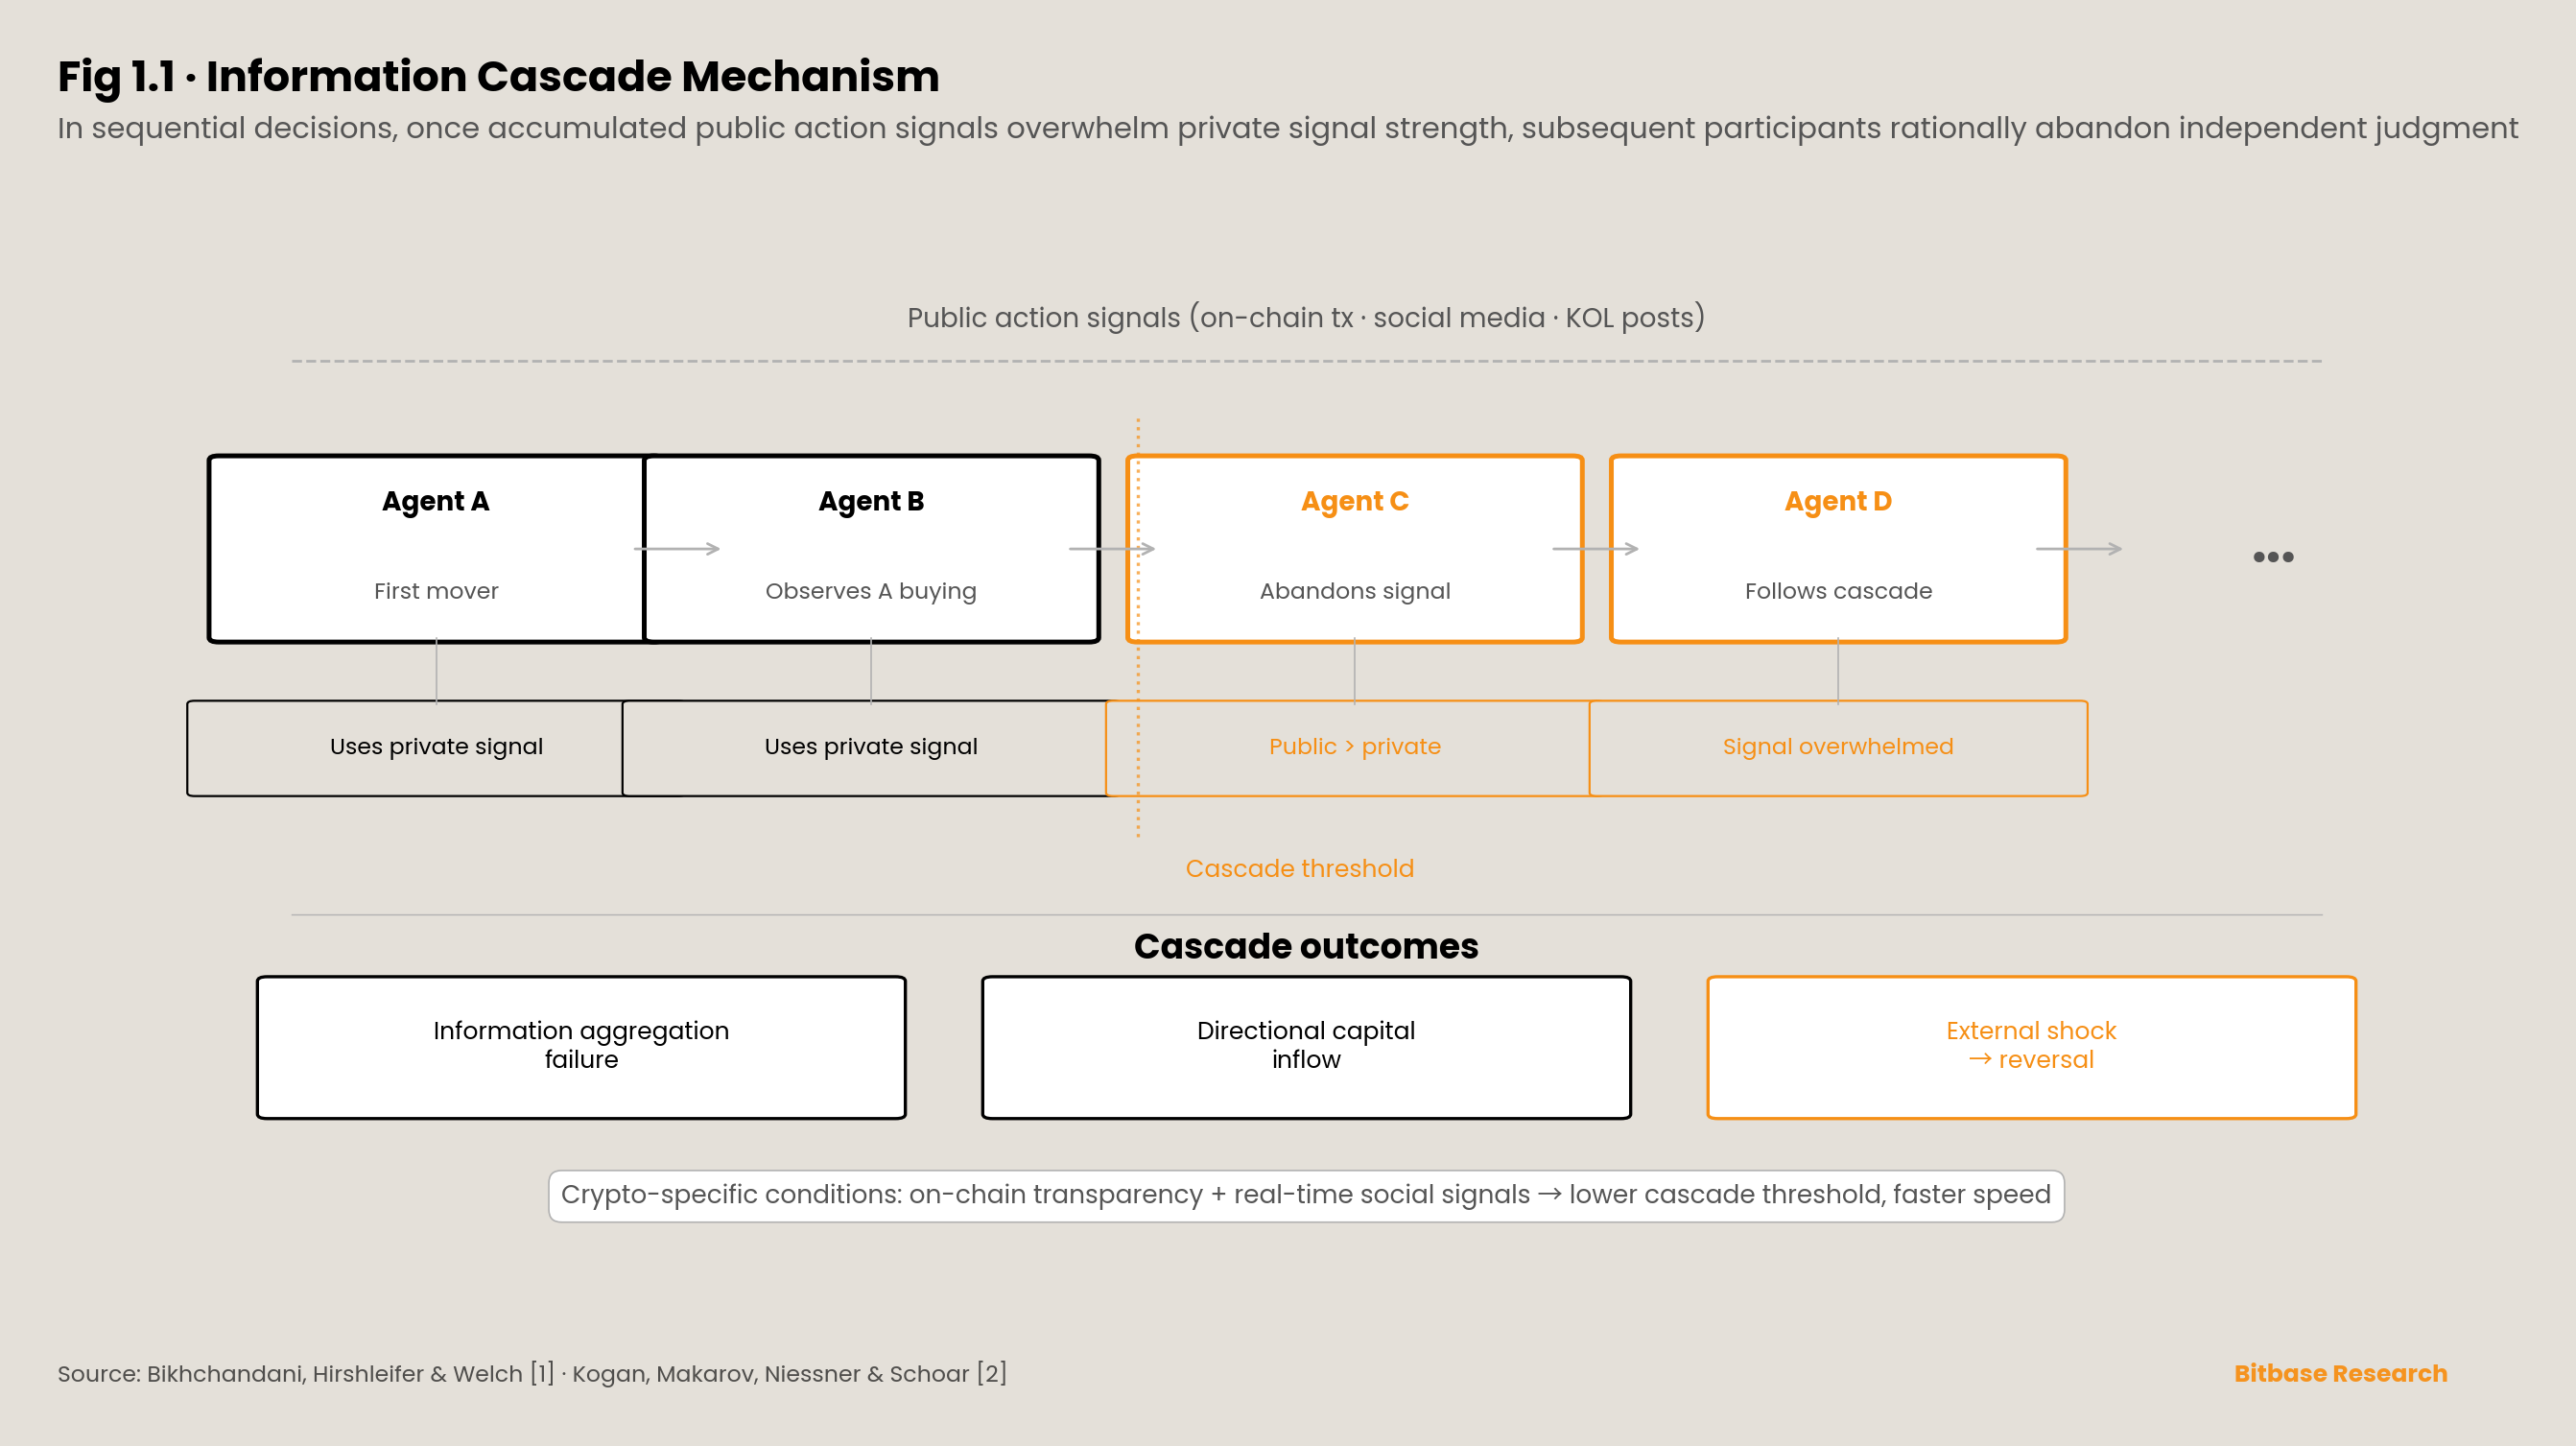
The first pillar comes from Bikhchandani, Hirshleifer, and Welch’s [1] foundational work on information cascades. Their core argument can be summarized as a Bayesian inference result: when individuals must act in sequential decisions, each holding noisy private signals about the state while observing predecessors’ public actions, a threshold exists — once predecessors’ accumulated public actions are sufficient to overwhelm the strength of a typical private signal, subsequent individuals’ optimal strategy is to abandon their own private signal and copy predecessors’ actions. “Herding” in this context is not a cognitive deficiency but the result of rational Bayesian updating. A critical corollary of this mechanism: once an information cascade forms, the information aggregation mechanism immediately fails — subsequent individuals rationally abandon their private signals, and their public actions no longer convey new information to observers. The group’s public action sequence then merely repeats early signals. This structure means that even if aggregate information may be sufficient to identify the correct decision, the cascade can stably converge on the wrong conclusion, and this erroneous conclusion will not self-correct until an external shock arrives.
Bikhchandani et al.’s [1] original model was built on discrete choices and finite signal spaces and has since been extended to financial markets, social contagion, organizational decision-making, and other domains. However, applying this theory to the post-2020 crypto market requires a critical mechanistic modification: the crypto market’s “public actions” are no longer merely buying or selling, but on-chain visible wallet addresses, holding distributions, transaction timing, and social media likes, retweets, and engagement metrics. This means predecessors’ actions are made explicit, quantifiable, and machine-parsable — the cascade formation threshold is therefore significantly lowered, and propagation speed significantly increased.
Kogan, Makarov, Niessner, and Schoar [2] provided empirical validation of this modification in the crypto market context. Using token listing events as samples and constructing co-exposure measures from on-chain transaction data and social media data, they found that attention surges retained significant predictive power for price and volume in short windows after controlling for fundamental proxy variables; and this price response systematically reversed within one to two weeks. The authors interpreted this pattern as “attention-driven overreaction,” whose empirical trajectory — rapid accumulation, peak, reversal — is consistent with the theoretical predictions of Bikhchandani et al.’s [1] cascade model. More critically, the paper found that the magnitude of information cascades in crypto tokens is significantly larger than in traditional equities: the reversal scale of mean-reversion on average exceeded comparable event studies in traditional assets. The implication is that theoretical pillar one is not merely applicable to the crypto market but applies in an amplified form.
Placed in this theoretical perspective, the forty-minute trajectory of $LIBRA in Section 1.1 is no longer an isolated anomaly but an extreme-parameter instance of the cascade model: the strength of public action signals (presidential tweet + initial buy orders) was sufficient to overwhelm virtually all participants’ private signals within tens of minutes, and the cascade completed before any information fundamental had been generated.
1.3 Principal-Agent · How Agency Costs Are Structurally Amplified
The second pillar is the agency cost framework proposed by Jensen and Meckling [3]. Its original formulation in the corporate finance context states: when a principal delegates decision-making authority to an agent, and the agent’s actions are not fully observable, the agent will deviate from the principal’s optimum at the margin where the agent’s interests conflict with the principal’s. Agency costs comprise three components — the principal’s monitoring costs, the agent’s bonding costs, and the residual loss remaining under the optimal contract for both parties. This framework’s generality allows it to be transplanted to shareholder-manager, creditor-shareholder, insured-insurer, and numerous other relationship structures.
Agency problems are typically further decomposed into two information-level sources. Adverse selection refers to the agent’s possession of private information about their own type (ability, quality, intent) before the agency relationship is established, causing the principal to face a “type indistinguishability” problem in contract design; Akerlof’s [4] used car market model is the standard formulation of this mechanism (Section 1.4 of this chapter will discuss it in detail). Moral hazard refers to the unobservability of the agent’s actions or effort after the agency relationship is established, giving the agent incentives to deviate from the principal’s optimum in contract execution; Holmström [5] provided rigorous mathematical formalization in The Bell Journal of Economics. Holmström’s core contribution is the Sufficient Statistic Theorem — observable signals that still provide additional information about the agent’s effort given the output should be incorporated into the optimal contract; conversely, once the output is a sufficient statistic for effort, additional signals have no marginal contractual value. This theorem provides both a rigorous criterion for “when to introduce auditing or disclosure” and establishes the formal measure of “signal value” in information economics.
The crypto market provides a set of empirical materials for these two mechanisms that is independent of the corporate finance context. Cong, Li, and Wang [6] treated tokenomics as a dynamic incentive contract design problem and noted that tokens’ dual role as both “compensation instrument” and “financing instrument” gives project teams control over token issuance, allocation, and unlock schedules that structurally corresponds to an agent’s decision space with near-unlimited degrees of freedom in the seigniorage dimension, while token holders as residual claimants possess virtually no monitoring tools commensurate with that decision space. This analysis identifies token design itself as the core vehicle of agency conflict.
Mapping the above framework to the crypto market, at least five recurring agency structures can be identified, each with a verifiable empirical anchor.
First, the custodial relationship between users and centralized exchanges. The FTX case provides an order-of-magnitude reference: in the DOJ Southern District of New York’s March 2024 sentencing press release [18], U.S. Attorney Damian Williams explicitly stated that Bankman-Fried misappropriated customer funds “exceeding $8 billion,” and the court issued a forfeiture order “exceeding $11 billion”; the CFTC’s August 2024 final order [19] directed FTX to pay $12.7 billion in monetary relief to customers and victims, including $8.7 billion in restitution. A custodian simultaneously serving as a proprietary trader, with client assets not genuinely segregated, is the baseline case for agency conflict under centralized custodial architecture.
Second, ex ante allocation between token holders and project teams. Worldcoin (World Foundation)’s token distribution structure at its July 24, 2023 launch [20] showed: of a total supply of 10 billion WLD, 25% allocated to insiders (Tools for Humanity investors 13.5%, core development team 9.8%, reserves 1.7%), with 75% designated for the “community”; however, the maximum circulating supply at launch was only approximately 143 million WLD (1.43% of total supply), of which approximately 70% was lent to non-US market makers. The combination of low float and high FDV (fully diluted valuation) means the price that retail investors face on the secondary market has a systematic spread against insiders’ post-unlock supply curve — the ex ante allocation structurally embeds a value-transfer pathway.
Third, the information relationship between retail investors and undisclosed paid KOLs. The SEC’s October 3, 2022 press release [21] disclosed its settlement with Kim Kardashian for promoting EthereumMax (EMAX) tokens on Instagram without disclosing $250,000 in compensation received, with total penalties of $1.26 million ($1 million fine plus approximately $260,000 in disgorgement and interest), and a three-year prohibition on promoting crypto asset securities. When promoters do not disclose their paid status, their de facto principal has flipped from the audience to the project team, and the audience bears a hidden agent problem.
Fourth, alignment of interests between LPs and market makers. The CFTC’s December 13, 2022 complaint against FTX and Alameda [22] recorded a specific technical detail: FTX’s code contained an “allow negative flag” backdoor, plus a “virtually unlimited line of credit” granted to Alameda, enabling Alameda to withdraw approximately $8 billion from FTX customer deposits for proprietary trading; the SEC’s December 21, 2022 complaint against Caroline Ellison and Gary Wang [23] restated the same mechanism in independent language. The same controller simultaneously operating a market maker and a user-fund custodial platform represents an extreme sample of agency conflict between a market maker and the market it serves.
Fifth, risk allocation between depositors and centralized lending platforms. Celsius Network filed for Chapter 11 reorganization [38] (Case №22–10964) in the U.S. Bankruptcy Court for the Southern District of New York on July 13, 2022, with day-one filings disclosing total liabilities of approximately $5.5 billion, of which approximately $4.7 billion represented unsecured customer claims, total assets of approximately $4.3 billion, and an asset-liability gap of approximately $1.2 billion; the FTC’s July 13, 2023 settlement announcement [24] separately imposed a $4.7 billion civil penalty on the Celsius corporate entity (an independent action, with the amount coincidentally matching customer claims), suspended due to bankruptcy to allow remaining assets to be returned to consumers. Marketing with a bank-like narrative externally while operating with an unsegregated structure internally constituted the core of agency conflict between lending platforms and depositors.
These five cases superficially belong to different business types, but at the agency structure level share a single template: one party holds private information about its own actions, asset destinations, or incentive structure, while the other party, having granted decision-making or asset custody authority, lacks enforceable monitoring and recourse mechanisms.
1.4 Information Asymmetry · The Endogenous Collapse of Market Quality
The third pillar — information asymmetry — is not an independent mechanism parallel to the first two but their underlying precondition. Akerlof’s [4] used car market model published in the Quarterly Journal of Economics is the foundational formulation: when sellers hold private information about product quality while buyers can only observe the overall distribution, buyers’ maximum offer is anchored to the valuation corresponding to average quality; this price is insufficient to cover high-quality sellers’ reservation utility, and high-quality supply exits the market; average quality in the remaining market further declines, buyers again lower their offers, forming a unidirectional spiral until market transaction volume compresses to zero or near-zero. Akerlof extended this mechanism from used cars to insurance, credit, labor, and developing economy financial markets, identifying it as the unified mechanism explaining a large number of “missing market” phenomena — quality uncertainty + information asymmetry = endogenous market collapse.
This analysis’s applicability to the crypto market operates on two levels. The first is the asset side: unaudited tokens, undisclosed code, and undisclosed allocation schedules are difficult for buyers to distinguish from fully audited, open-source, transparently allocated assets; the pricing mechanism tends to compress both into the same expected-value range; absent credible certification mechanisms, high-quality issuers’ incentive is not to continue issuing but to exit or shift to other venues. The second is the intermediary side: the internal risk posture of centralized exchanges, market makers, custodians, and lending platforms is nearly unobservable to users, who can only estimate their average quality based on branding, marketing, and indirect signals — this is the common structure of the FTX, Celsius, and Voyager cases in information economics terms.
Akerlof’s model establishes the theoretical possibility of market collapse but does not directly answer another question closely related to the crypto market: in a market where transaction costs are not infinite and arbitrage capital is not absent, why can information asymmetry persistently drive prices away from fundamentals? Makarov and Schoar’s [7] empirical study in the Journal of Financial Economics of 2017–2018 cross-exchange, cross-regional Bitcoin price differences provided evidence for the independent importance of limits of arbitrage in the crypto market. The authors found that Bitcoin could sustain price spreads of several percentage points across different exchanges for days to weeks, and these spreads were significantly correlated with fiat on/off-ramp channels, exchange registration and compliance frictions, and capital account controls. Arbitrage was not absent but was constrained by non-market frictions to a level far below the intensity needed to eliminate spreads. Furthermore, the authors documented that these spreads were geographically systematic — spreads between Korea, Japan, and U.S. markets were not symmetric noise but directional structural signals. This empirical conclusion is consistent with Shleifer and Vishny’s [8] theoretical tradition regarding limits of arbitrage but exhibits a characteristic not found in classical markets: technically instantaneous cross-border fund transfers are still severely friction-ized at the compliance and channel level.
Combining Akerlof’s market collapse mechanism with Makarov and Schoar’s limits-of-arbitrage evidence, information asymmetry’s impact pathway on the crypto market can be characterized in two phases: ex ante, information asymmetry suppresses high-quality supply’s entry incentives, causing market average quality to sink downward; ex post, limits of arbitrage allow mispricing to persist over sufficiently long windows, thereby giving the ex ante quality collapse temporal persistence at the price level.
1.5 The Nested Structure of Three Layers
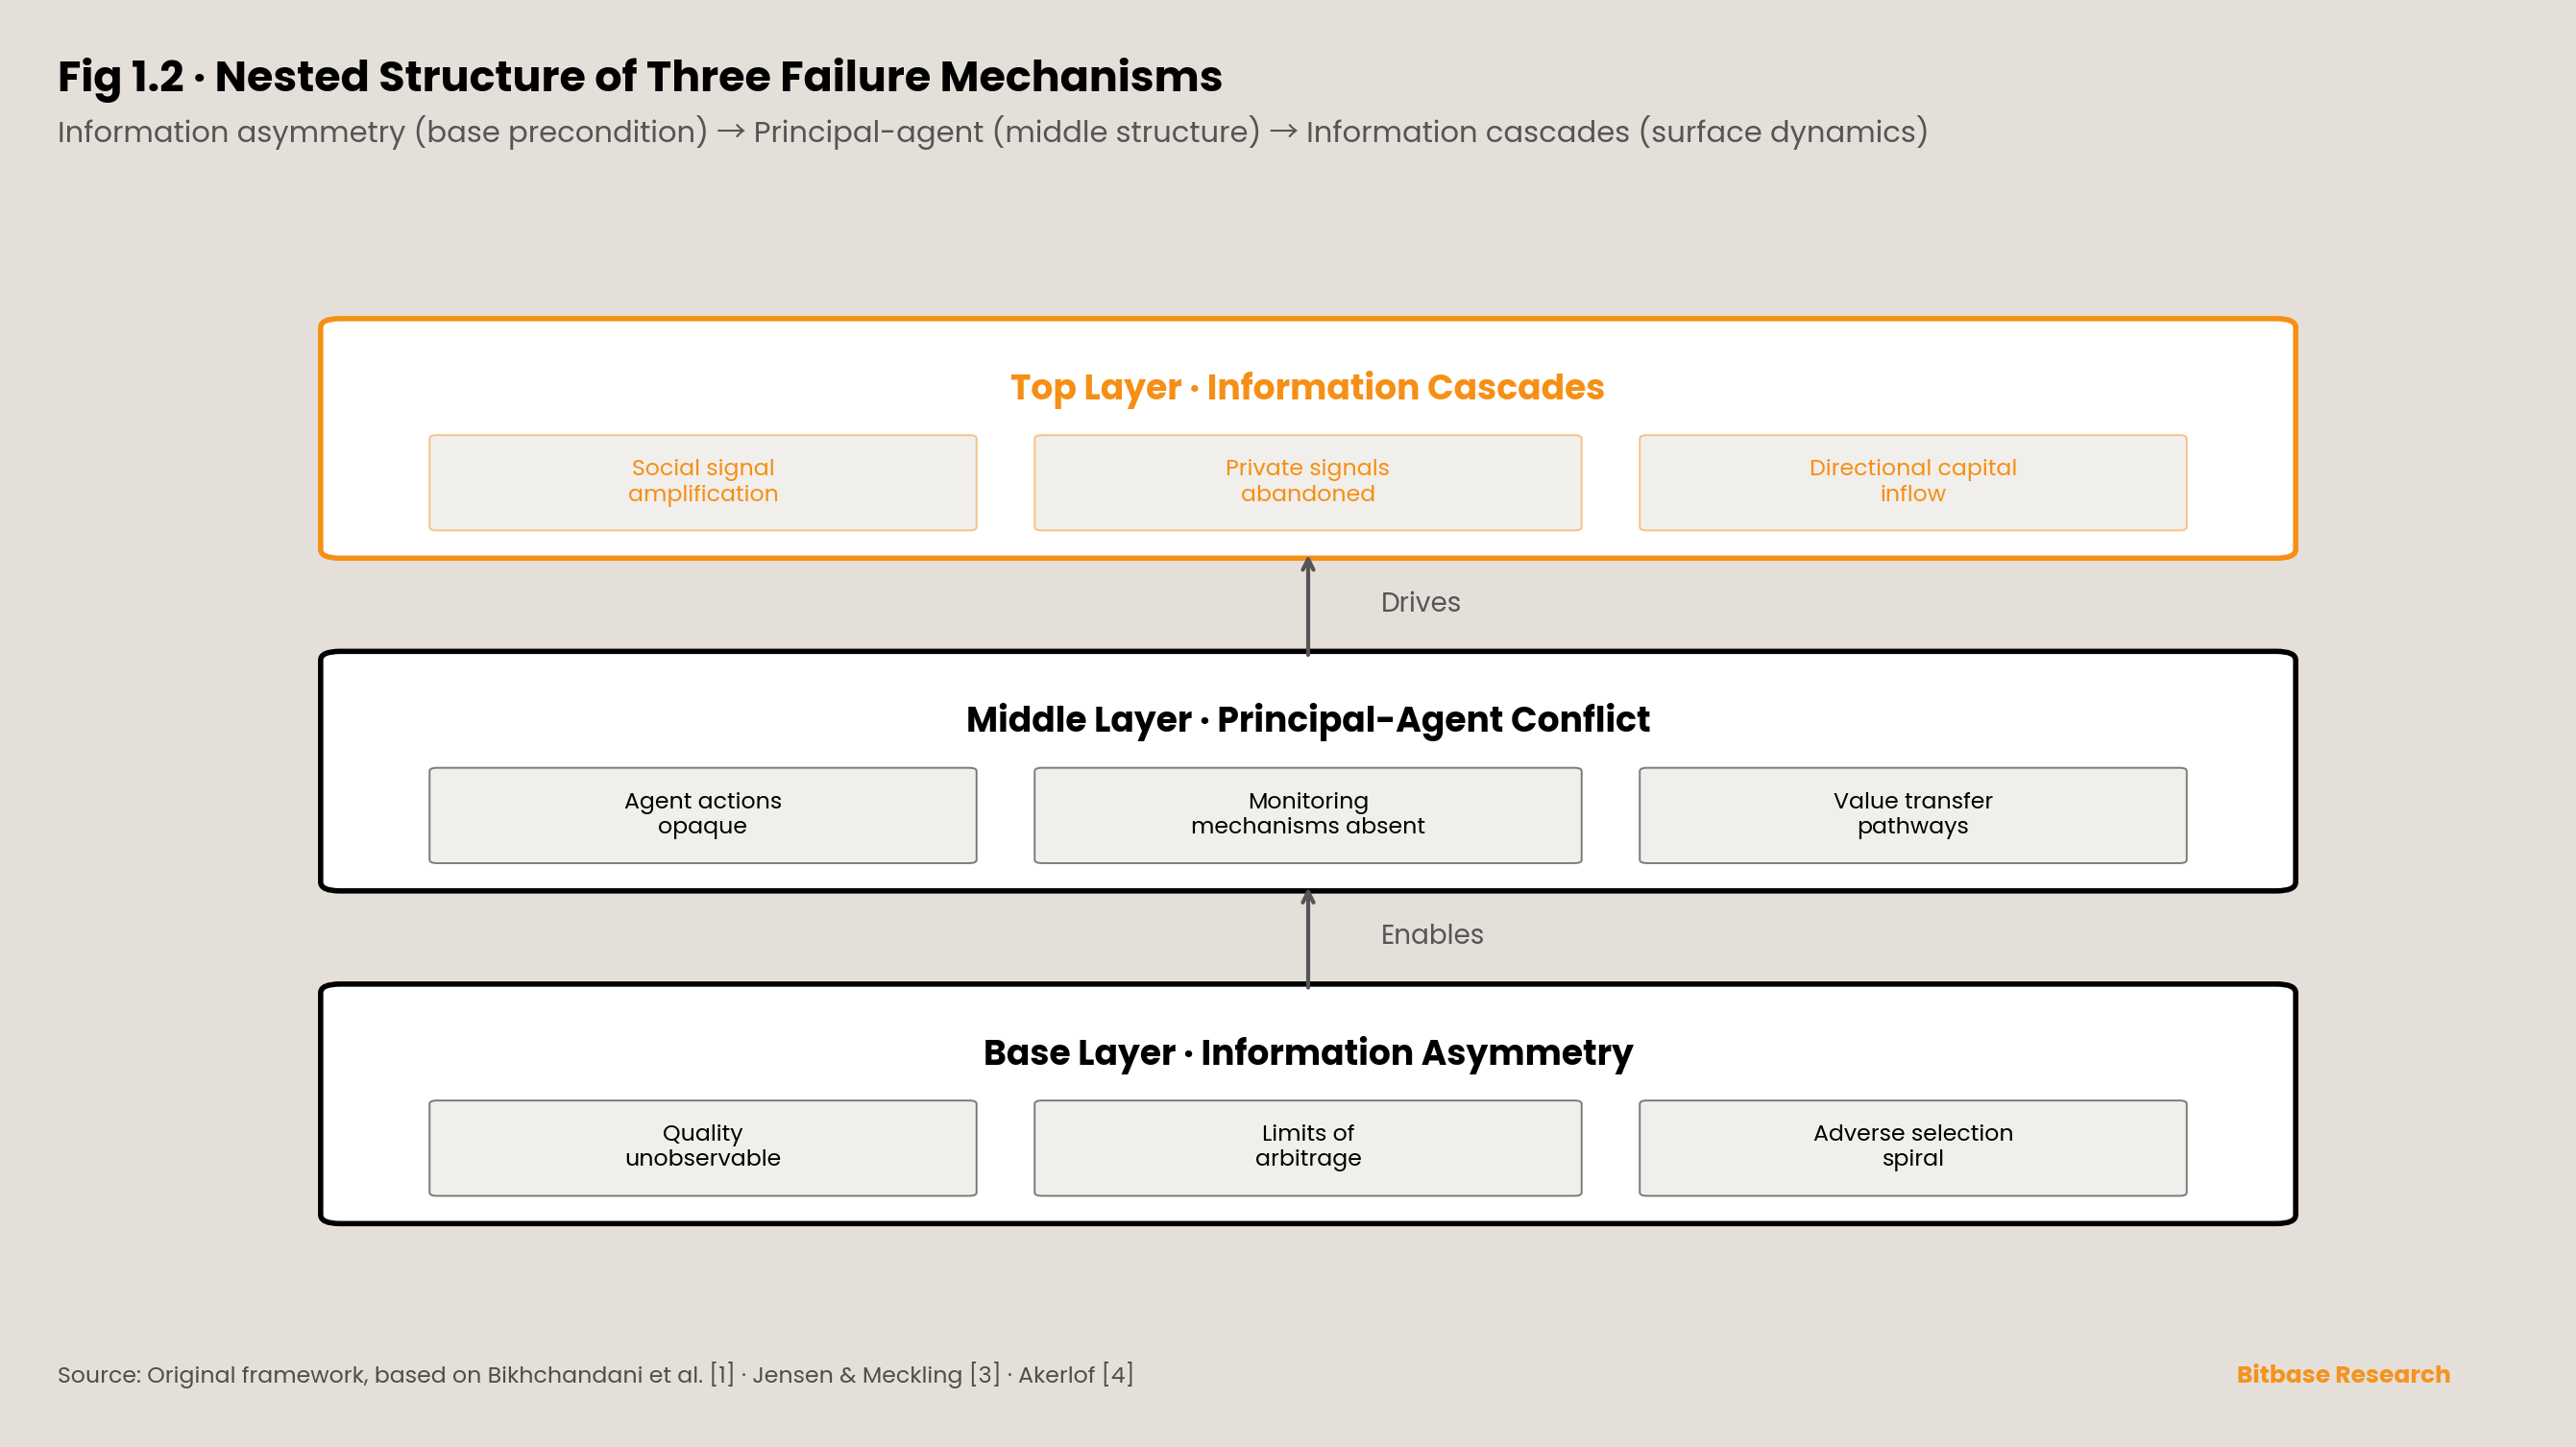
Placing the three theoretical pillars side by side is insufficient to characterize the crypto market’s current systemic failure. The three are not logically parallel but nested. Information asymmetry is the base-layer precondition: it defines what private information buyers, sellers, principals, and agents each hold, and specifies the boundary conditions for monitoring and identification. The principal-agent problem is the middle-layer structure: it describes how, given information asymmetry, the delegation of decision-making and asset custody authority translates into economic value extractable by agents — the scale of agency costs is determined by the base-layer information structure, but their actual realization is jointly determined by contract design, regulatory intensity, and the distribution of residual claims. Information cascades are the top-layer dynamics: they describe how, after agency structures have embedded value-transfer pathways and information asymmetry has eliminated ex ante identification mechanisms, capital can be directionally channeled toward specific targets within short time windows — the cascade’s speed and magnitude depend on the visibility of public action signals, the strength of private signals, and participants’ decision sequence.
A direct corollary of this nested relationship: strengthening governance tools at any single layer alone is insufficient. Merely disclosing token allocation tables (targeting information asymmetry), merely requiring KOLs to label paid promotions (targeting agency problems), or merely pursuing ex post prosecution of price manipulation after cascade formation (targeting information cascades) — each only covers part of the complete mechanism at its respective level; and when base-layer information asymmetry has not been weakened, middle-layer agency structures will reorganize in new forms, and top-layer cascades will be triggered through new media. The reason the $LIBRA and $TRUMP series of events could still occur fully against the backdrop of existing regulatory discourse is not that any single layer was completely ignored, but that the three layers’ interaction was not treated as a whole.
This chapter established the three theoretical pillars and their nested structure. Beginning with the next chapter, this report enters the case analysis phase. Chapter 2 focuses on the top-layer mechanism of the three-layer framework — information cascades — and through the ICO bubble, Memecoin Casino, and airdrop farming case studies, demonstrates how information cascades are accelerated, amplified, and ultimately channel large-scale capital toward targets with negative expected returns under the crypto market’s special conditions.
Chapter 2 · Herding Effects: A Case Collection of Information Cascades and Social Proof
2.1 Opening · Three Waves, One Mechanism
Since the crypto market developed the capacity for large-scale capital mobilization, at least three mass participant surges driven by information cascade dynamics have occurred, each triggered through a different medium yet concluding with similar statistical outcomes.
The first was the ICO wave of 2016–2018. Project teams used whitepapers as their core signaling tool, supplemented by VC endorsements and exchange listings, mobilizing approximately $17.8 billion in global funding within eighteen months. The second was the Memecoin Casino wave of 2024–2025. Decentralized token issuance platforms compressed the token creation threshold from “whitepaper + three months of preparation” to “$2 fee + 30 seconds,” with social media replacing whitepapers as the primary medium for public action signals; a single platform created over 11 million tokens within two years. The third was the airdrop farming wave from 2022 to the present. Project teams, through points programs and interaction requirements, directly defined participant behavior; cascades no longer relied on naturally occurring social imitation but were actively engineered through incentive mechanisms, distributing approximately $26.6 billion in token incentives over three years.
Each wave attracted millions of independent participants. All three shared a statistical characteristic: participants’ aggregate expected returns were negative. This is not a matter of “some people losing money” but a systemic outcome where the majority of participants were at a loss upon exit. This chapter treats these three waves as three independent experiments of information cascade theory in the crypto market, extracting common parameters for trigger mechanisms, mobilization speed, and collapse morphology.
2.2 Case Set One · The ICO Bubble: The Whitepaper Signal Cascade
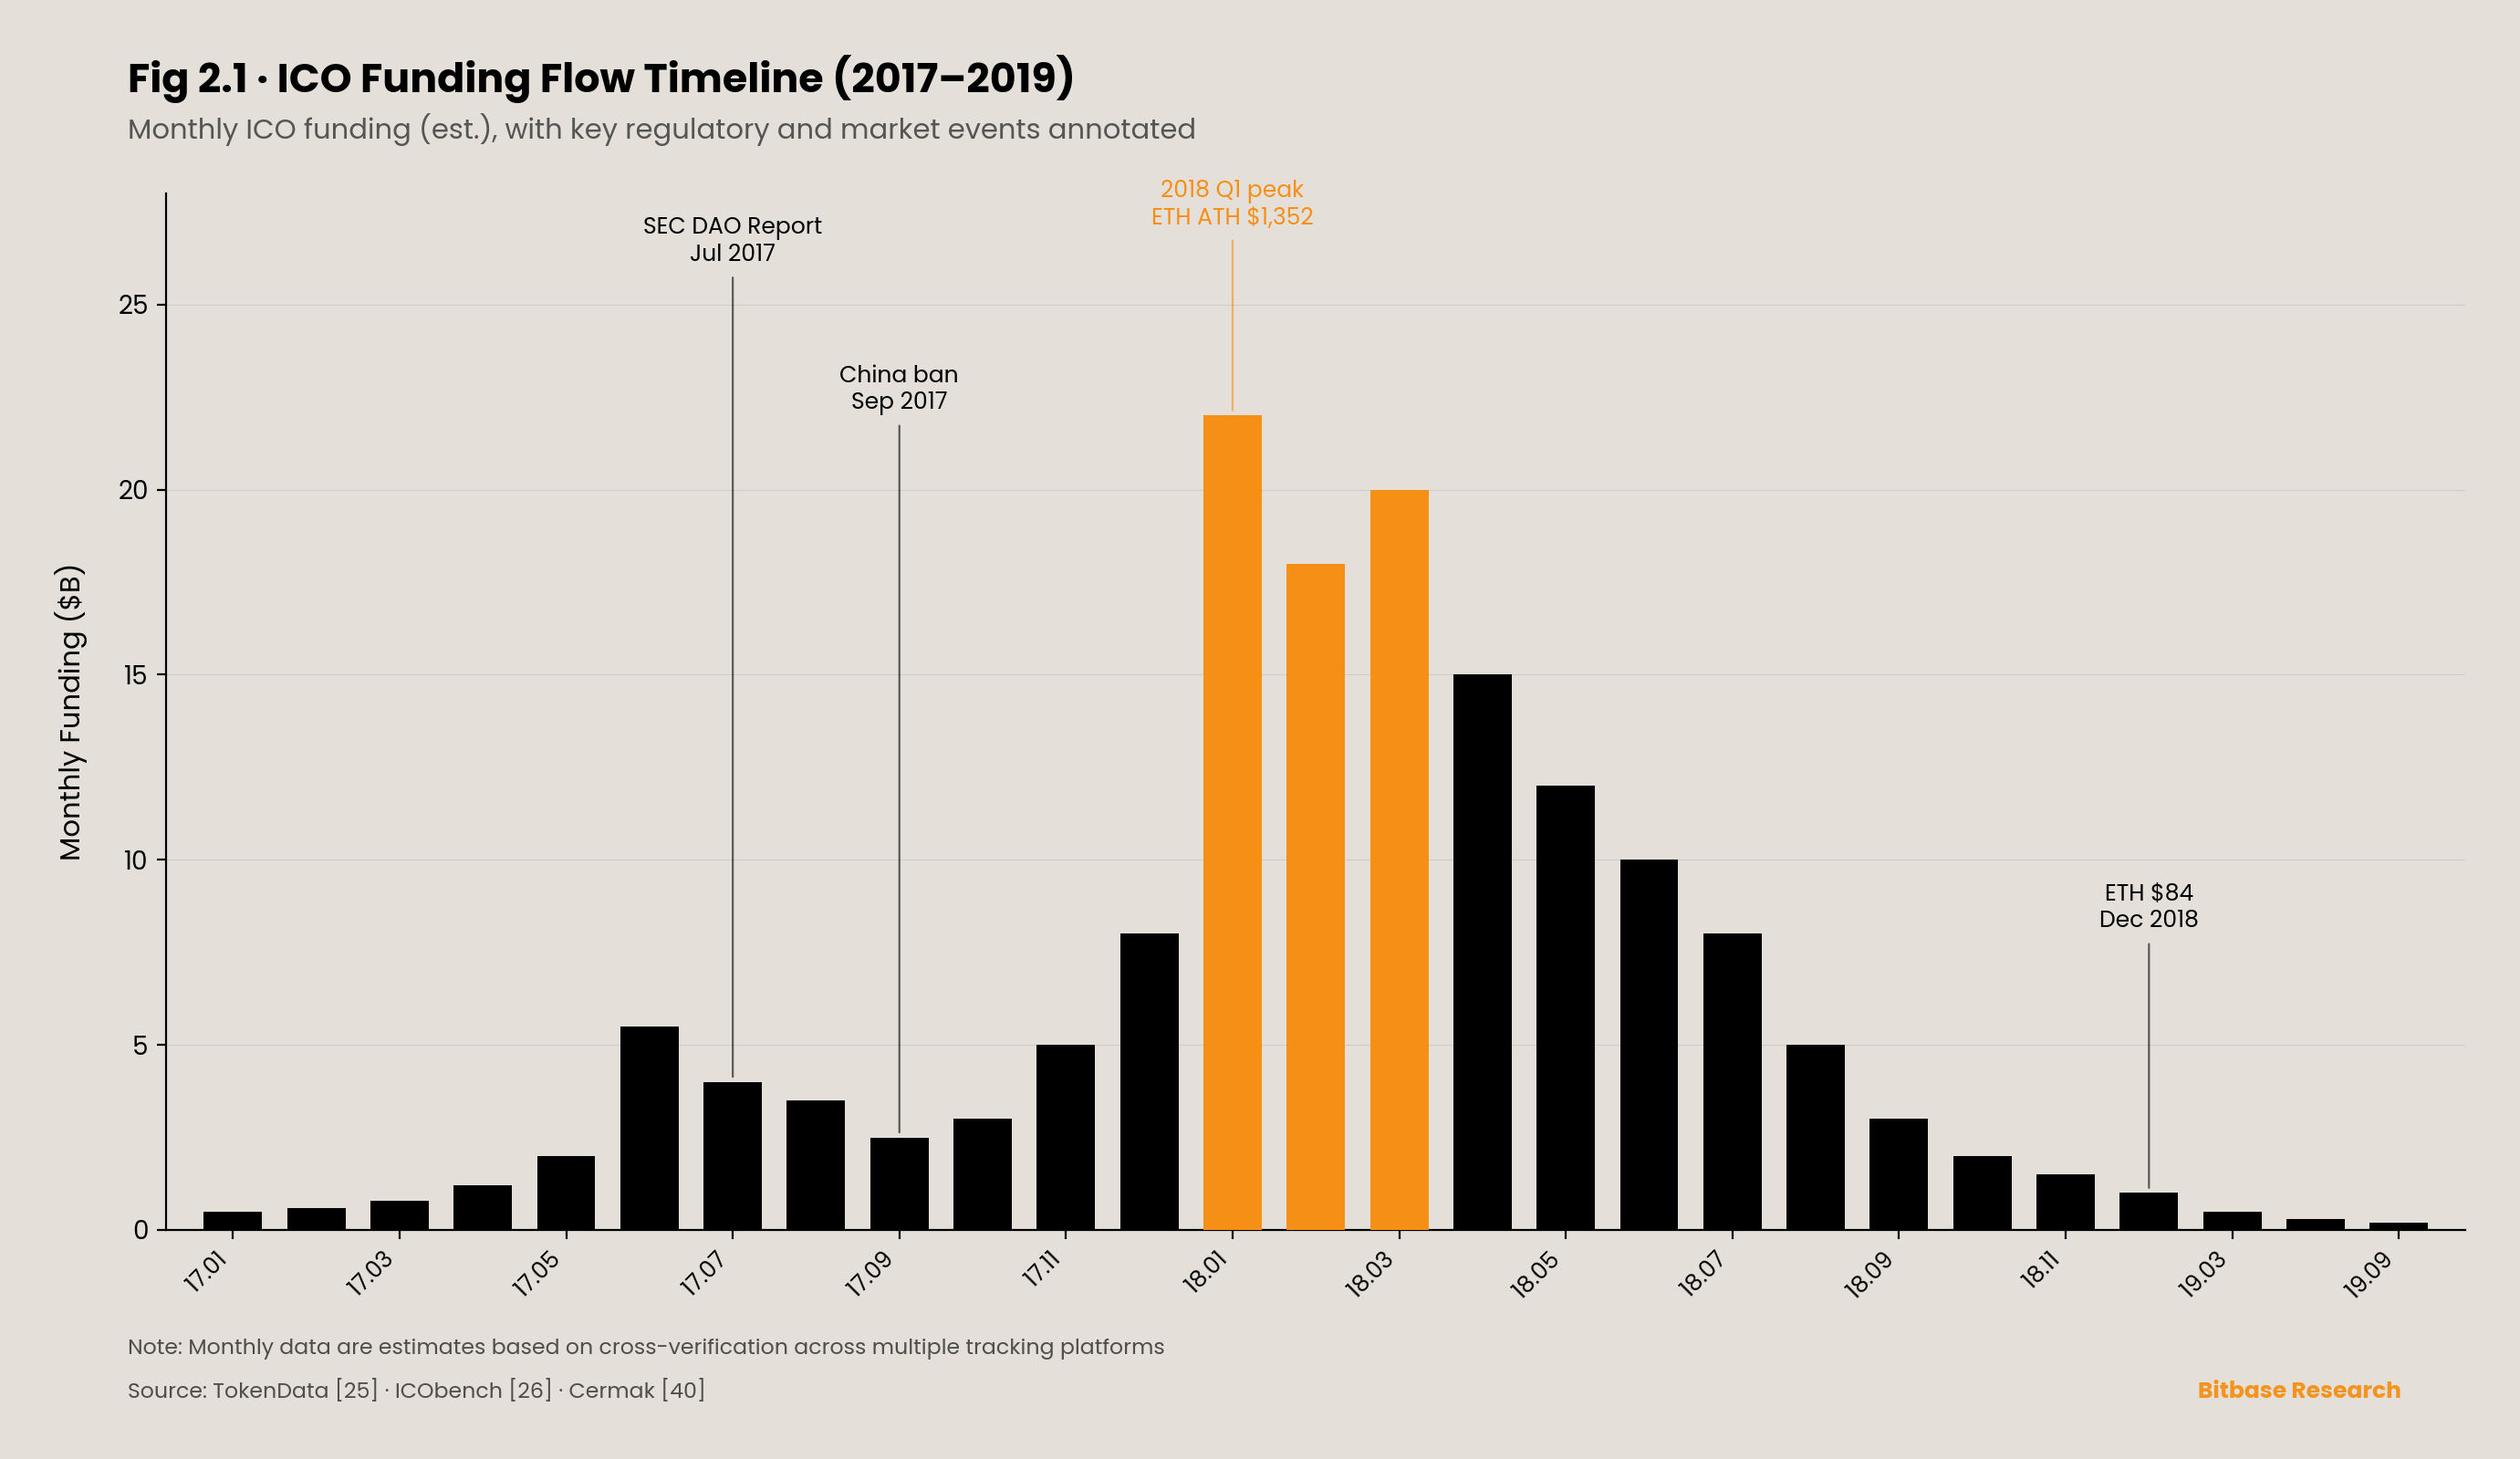
From January 2017 to July 2018, the global ICO market raised a cumulative approximately $17.8 billion [25], with approximately $5 billion in full-year 2017 (Swartz 2022) and Q1 2018 reaching its peak quarter. Approximately 966 ICO projects completed issuance in 2017; this number surged to approximately 2,284 in 2018 [26], with approximately 482 token sales running simultaneously at peak. These figures describe a funding market that expanded from near-nonexistence to the tens-of-billions level within eighteen months.
However, Haffke and Fromberger [10] reported in their ICO market report that approximately 55% of ICO tokens issued in 2017 had “substantially all value lost” by the end of 2018. Crypto market analyst Cermak’s [40] independent statistics further refined this picture: 74% of 2017 ICO tokens declined over 90% in BTC terms; median dollar return was −87%; only approximately 7.7% (approximately 30 projects) of all 2017-issued ICO tokens outperformed BTC during their holding period. In other words, the ICO market’s “aggregate investor returns were negative” is not a post-hoc narrative but a statistically testable fact.
From the information cascade theory perspective, the ICO market’s mobilization mechanism can be decomposed into a four-layer signal stacking structure. The first layer was the whitepaper — a document describing the project vision, technical architecture, and token allocation. The second layer was endorsement by VCs or prominent investors — typically presented as “Advisor” titles or “strategic investor” announcements. The third layer was coverage and promotion by crypto media and community KOLs. The fourth layer was exchange listing — the project token gaining trading support on platforms such as Poloniex, Bittrex, and Binance. Each signal layer individually contained limited information: a whitepaper did not guarantee code implementation; VC endorsement did not guarantee project team integrity; media coverage did not guarantee independent project evaluation; exchange listing guaranteed only liquidity provision, not underlying quality. However, the four layers stacked together produced public action signal strength sufficient to overwhelm the typical retail investor’s private signal — precisely satisfying the cascade formation conditions described by Bikhchandani, Hirshleifer, and Welch [1] in their foundational information cascade paper.
Swartz [9] proposed in New Media & Society a sociological framework complementary to information cascade theory: the ICO bubble was not the traditional binary structure of “fully informed fraudsters versus uninformed victims” but rather what she defined as a “network scam,” in which VCs, media, KOLs, project teams, and retail investors were to varying degrees simultaneously signal emitters and signal receivers, both drivers and bearers of the cascade.[³] This observation is consistent with Bikhchandani et al.’s [1] theoretical prediction: in an information cascade, subsequent followers’ actions themselves become signals that further reinforce the cascade — therefore, the roles of “victim” and “amplifier” are structurally inseparable.
The ICO market’s collapse pattern was likewise consistent with information cascade theory predictions. In January 2018, ETH reached an all-time high of approximately $1,352; by December of the same year, ETH had fallen to approximately $84, a decline of approximately 94% from the high. The collapse was not “individual projects sequentially exposing problems causing investors to gradually exit” but the entire market collapsing simultaneously. Triggering factors included at least three high-quality external signals: the SEC’s July 25, 2017 DAO Report of Investigation [27] (determining that DAO tokens were securities); China’s complete ban on ICOs in September 2017; and ETH’s sustained price decline beginning in Q1 2018. In Bikhchandani et al.’s [1] theory, cascade reversal requires an external signal of sufficient strength to overwhelm accumulated signals — the ETH price collapse and SEC enforcement actions precisely fulfilled this role.
The ICO bubble demonstrated the form of information cascades in an era of “high signal costs” — requiring multi-party coordination among whitepapers, VCs, and exchanges. The next section shows what cascades become when signal costs fall to “$2 and 30 seconds.”
[³]: Swartz 2022 is a sociology/media studies paper. This chapter cites her “network scam” framework as an interdisciplinary complement to information cascade theory.
2.3 Case Set Two · The Memecoin Casino: The Industrialized Cascade of $2 and 30 Seconds
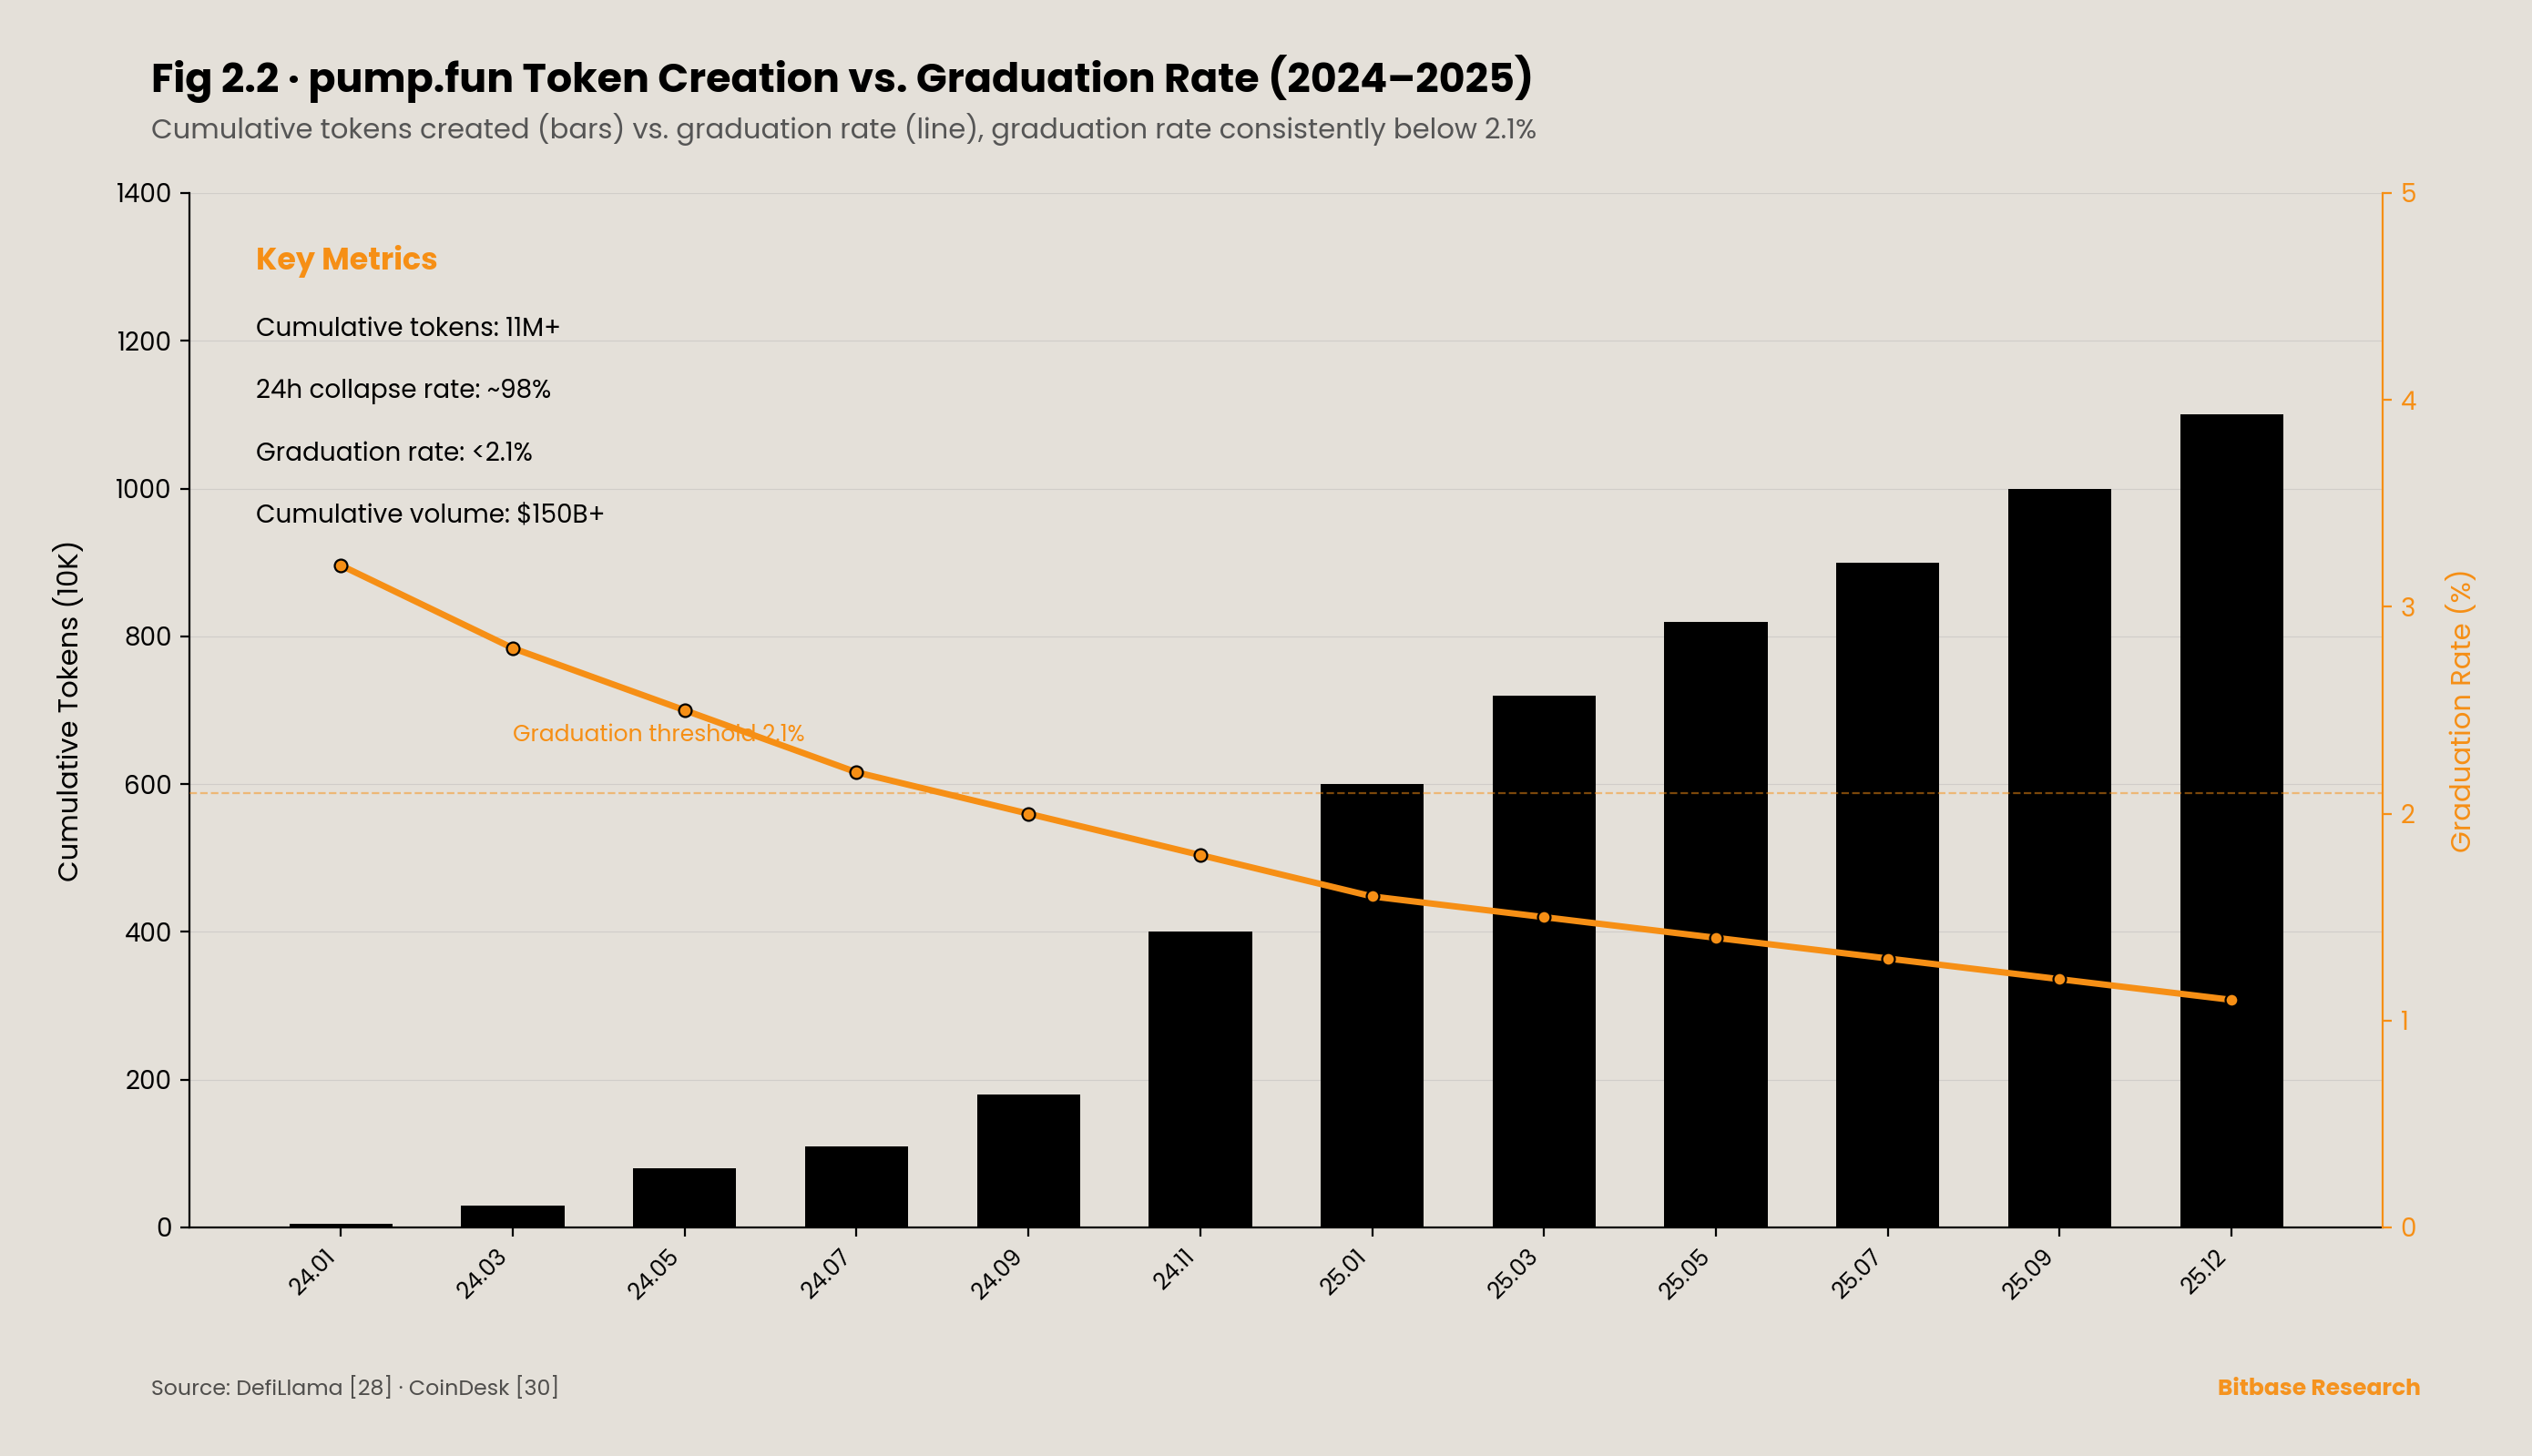
The pump.fun platform, launched on January 19, 2024, fundamentally altered the cost structure of token issuance. The process for issuing a new token on the platform: upload an image, enter a ticker name, pay approximately $2 equivalent in SOL as a fee, and the token immediately enters a bonding curve pricing model (a curve that automatically prices based on buy volume); 30 seconds later, anyone can trade it. No whitepaper, no code audit, no VC endorsement, no exchange review required. When a token’s buy volume on the bonding curve reaches approximately 85 SOL, liquidity automatically migrates to a decentralized trading platform (Raydium before March 2025, then pump.fun’s own PumpSwap AMM), entering open circulation — a process termed “graduation.”
By the end of 2025, pump.fun had cumulatively created over 11 million tokens, with peak daily creation of approximately 65,000. The platform accounted for over 80% of token creation on Solana during its operation. According to DefiLlama [28], its cumulative DEX trading volume exceeded $150 billion.[⁴] Peak monthly revenue reached $138 million, with peak daily revenue of approximately $15 million.
However, this scaled token creation process was accompanied by extreme attrition rates. Fewer than 2.1% of tokens “graduated” from the bonding curve stage. Approximately 98% of tokens collapsed to near zero within 24 hours. On the user side, public statistics showed approximately 11.5 million wallets at a loss versus fewer than 10 million profitable wallets; only approximately 0.6% of wallets had cumulative profits exceeding $10,000.
Compared to the ICO era, what occurred was an order-of-magnitude reduction in the cascade formation threshold. ICO-era signal costs — whitepaper composition, VC communication, exchange listing negotiation — were measured in months and tens-to-hundreds of thousands of dollars. Under the pump.fun model, signal costs were compressed to $2 and 30 seconds. The information economics implication: when the cost of initiating a cascade approaches zero, cascades are no longer “occasional behavioral anomalies” but an industrialized production process initiated tens of thousands of times daily, with the vast majority terminating within hours and a tiny fraction receiving brief amplification.
In this process, social media replaced whitepapers as the primary medium for public action signals. Twitter likes, retweets, KOL livestream comments, Telegram group messages — these metrics functionally equated to the ICO era’s “how many media outlets covered the whitepaper.” Kogan, Makarov, Niessner, and Schoar [2] provided quantitative support for this mechanism: based on data from 200,000 traders on the eToro platform, they found that attention surges retained significant predictive power for crypto token price and volume in short windows after controlling for fundamental proxy variables. This effect’s magnitude in crypto tokens was significantly larger than in traditional equities — i.e., the cascade amplification effect of social signals on the crypto market is empirically confirmed, not speculative.
TRUMP, launched on January 17, 2025, and MELANIA on January 19, were landmark instances of this pattern: within less than two days of launch, $TRUMP’s fully diluted valuation (based on all 1 billion tokens) briefly reached approximately $27 billion, then retraced over 90% over the following weeks to months;[⁵] $MELANIA exhibited an isomorphic trajectory. The $LIBRA case was treated in detail in Chapter 1 and is not repeated here. All three demonstrate a commonality of Memecoin-era information cascades: the triggering signal’s source is no longer whitepapers and VCs but a single social media post by an individual with enormous influence.
A meta-phenomenon worth separate observation is pump.fun’s own token issuance on July 12, 2025. According to DefiLlama’s funding records [28], the round comprised two parts: a $400 million private token sale and a $600 million public ICO, totaling $1 billion, with a fully diluted valuation of $4 billion.[⁶] This is a structurally noteworthy event: a platform specifically providing infrastructure for creating and trading high-attrition-rate tokens tokenized itself and completed capital mobilization at institutional-grade funding scale. Information cascades in this case are not merely “a phenomenon retail investors get swept into” but a business model that can be institutionalized, securitized, and priced by secondary markets — participants with views on information cascade dynamics can now express their expectations for cascade persistence by purchasing the platform token itself. This section records only this factual structure and offers no judgment on its compliance status or ethical evaluation.
The Memecoin Casino demonstrated how social media transformed the cascade medium from “static whitepapers” to “dynamic attention.” The next section shows how cascades are further institutionalized into “mechanism inducement.”
[⁴]: DefiLlama data as of April 2026 shows pump.fun’s cumulative DEX trading volume at approximately $157.5B. CoinDesk’s December 2025 report cited the end-of-2025 figure as “>$150B.” This section uses $150 billion as a conservative lower bound.
[⁵]: A metric discrepancy exists for $TRUMP’s market cap. CoinMarketCap records the circulating market cap (counting only the 200 million publicly issued tokens) peak at approximately $11.7 billion (ATH price approximately $74–$75, January 19, 2025); Wikipedia and most authoritative media cite $27 billion referring to the fully diluted valuation of all 1 billion tokens. This section adopts the latter to reflect the event’s full capital mobilization scale, with the metric discrepancy noted.
[⁶]: Regarding the PUMP token’s total funding, different sources report differing figures. DefiLlama records $400M private + $600M public ICO = $1B; some media reports cite a total of $1.3B ($600M public + $700M private). The discrepancy may stem from different accounting scopes for the private sale. This section uses DefiLlama as the primary source.
2.4 Case Set Three · Airdrop Farming: The Mechanism-Induced Cascade
In the ICO bubble, information cascades were triggered by whitepaper signals; in the Memecoin Casino, by social media attention. Both shared the commonality that participants still needed to exercise active judgment — choosing which ICO project, following which memecoin. Airdrop farming introduced a third dynamic: project teams, through publicly issued points program rules, directly defined participant behavior. Participants did not need to judge project quality; they only needed to complete specified on-chain actions according to the rules — cross-chain bridging, providing liquidity, executing a specific number of transactions — to expect future token airdrops. This is a mechanism-induced cascade: the cascade’s target is not “what participants buy” but “what participants do.”
This pattern’s scale can be measured on two dimensions. On the token distribution side, project teams cumulatively distributed approximately $26.6 billion in tokens through airdrops over three years [29]. On the participant side, airdrop farming spawned an industrialized supply chain centered on Sybil attacks — where a single entity creates numerous wallet addresses, repeating the same set of rule-defined actions on each address to obtain multiple airdrop allocations.
Sybil attacks are not isolated fraudulent acts but structural byproducts of mechanism-induced cascades. When incentive rules depend on metrics like “number of wallets,” “transaction count,” or “cross-chain message count” that can be machine-generated, machines’ marginal costs are far lower than humans’, and automated arbitrage becomes the rational participant’s optimal strategy. Sybil data from three landmark airdrop cases clearly illustrate this structure:
LayerZero’s June 2024 airdrop represented the most aggressive anti-Sybil case. The project publicly requested Sybil operators to self-report before the snapshot, promising self-reporters could retain 15% of expected allocations. It subsequently collaborated with Chaos Labs and Nansen for on-chain analysis. Ultimately, LayerZero announced 803,093 [30] Sybil addresses identified and excluded, representing approximately 59% of its initial candidate address pool; CEO Bryan Pellegrino later disclosed the final estimated Sybil address total at between 1.1 million and 1.3 million. This means that in a protocol with approximately 6 million cumulative wallet interactions, Sybil operators’ penetration rate far exceeded half of candidate addresses. After the airdrop (June 20, 2024), the ZRO token price declined from $4.79 to approximately $4.00 within 36 days — a drop of approximately 16%.
zkSync Era’s June 2024 airdrop was widely criticized for inadequate anti-Sybil measures. Polygon Labs CISO Mudit Gupta publicly commented: “This might be the most farmable airdrop ever. From what I can tell, almost no Sybil filtering was performed.” Its native ZK token declined approximately 39.29% in the 36 days from airdrop day (June 17, 2024) to July 23, 2024 — approximately 2.5 times LayerZero ZRO’s decline over the same period.
Hyperliquid’s November 2024 airdrop provided a control sample. The project distributed approximately 274 million HYPE tokens (approximately 27.4% of the 1 billion total supply; 310 million allocated, with the claimed portion) to approximately 94,000 addresses, averaging approximately 2,915 HYPE per address.[⁷] The key distinction from LayerZero and zkSync: Hyperliquid’s points system was directly tied to actual trading behavior (placing orders, executing trades, managing positions) rather than machine-replicable bridging or message-sending; and the project had no external VC investment, with 76.2% of token supply explicitly allocated to the community. After issuance, HYPE not only did not decline but rose continuously from an opening price of approximately $2, briefly reaching approximately $35. Cookie3’s cross-project survey [31] showed that up to 70% of eligible airdrop wallets were multi-wallet operators — but Hyperliquid, by anchoring incentive rules to difficult-to-automate trading behavior, effectively reduced the marginal return on Sybil operations, thereby achieving non-adversarial Sybil filtering through structural design.
Observing the three cases in parallel, a structural relationship emerges: anti-Sybil capability and token price stability are positively correlated. zkSync with virtually no anti-Sybil mechanism declined 39% in 36 days; LayerZero with aggressive but retroactive anti-Sybil declined 16% in 36 days; Hyperliquid with anti-Sybil logic embedded in incentive rule design saw post-issuance price appreciation. Makarov and Schoar [7] noted in their limits-of-arbitrage research that the crypto market’s price correction mechanisms are constrained by non-market frictions — Sybil identification capability in airdrop farming constitutes a new instance of such friction: the technical boundary of a project’s Sybil identification determines the sell-pressure structure after token issuance, which in turn determines short-term price stability.
The exit phase of mechanism-induced cascades exhibits a characteristic distinct from natural cascades. LayerZero’s data provides a precise picture: from April 30, 2024 (snapshot date) to July 7, 2024 (near the airdrop date), LayerZero cross-chain messages declined 91.5% and daily transactions declined over 92%. The activity collapse was not triggered by “collective sentiment reversal” but by “incentive redemption” triggering universal withdrawal. Once the expected return from points rules was realized as airdrop tokens, the marginal return of continued interaction dropped to zero, and participants rationally moved to the next protocol that had not yet airdropped. This exit pattern reveals a third structural characteristic of mechanism-induced cascades: participants are formally “free users” but at the incentive-alignment level are outsourced labor defined by the project team — their behavior is precisely programmed by incentive rules, and their exit timing precisely triggered by incentive redemption.
[⁷]: Hyperliquid total allocation: 310 million HYPE (31% of 1B); approximately 274 million actually claimed (some users did not claim due to not signing Genesis Event terms; ASXN Data). 94,000 addresses claimed, averaging approximately 2,915 per address. However, distribution was highly uneven: approximately 56.6% of users received no more than 100 tokens; the largest single-address claim was 970,000 tokens.
2.5 The Common Kernel of Three Patterns
The three waves’ mechanism parameters can be placed in parallel comparison. On the trigger signal dimension, ICO cascades were triggered by whitepapers and VC endorsements; memecoin cascades by social media attention; airdrop cascades by publicly issued points rules. On the mobilization medium dimension, the ICO era relied on crypto media coverage and exchange listing reviews; the memecoin era on Twitter, Telegram, livestreams, and bonding curve automated pricing; the airdrop era on project team official documentation and KOL-produced “tutorials.” On the participant role dimension, ICO participants saw themselves as “investors,” memecoin participants as “traders,” and airdrop participants structurally resembled “users” guided to execute specific actions — yet all three occupied the same position in the information cascade model: subsequent followers. On the collapse morphology dimension, the ICO market collapsed synchronously as a whole (ETH’s full-year 2018 decline of 94%); memecoins collapsed individually within 24 hours as the norm (98% went to zero within a day); airdrops manifested as collective withdrawal after incentive redemption (LayerZero message volume declined 91.5%).
The common kernel behind these differences can be summarized as a core observation proposed by this report: whenever the cost of “initiating a public action signal” in the crypto market is systematically reduced, information cascades recur in new forms. In the ICO era, whitepaper standardization reduced signal costs from “hundreds of thousands of dollars + months” to “tens of thousands of dollars + weeks”; in the memecoin era, bonding curve pricing reduced signal costs from “tens of thousands of dollars + weeks” to “$2 + 30 seconds”; in the airdrop era, public quantification of points rules reduced “incentive signal costs” from “requiring individual judgment” to “execute by rule.” Three reductions, three cascades.
The three waves also shared a second structural condition: all three operated in environments lacking both ex ante identification mechanisms and ex post tracing mechanisms. ICO-era SEC enforcement was ex post prosecution; memecoin-era pump.fun-related litigation remains ongoing; airdrop-era Sybil identification in the most aggressive case (LayerZero) could only exclude 59% of candidate Sybil addresses. No era established effective ex ante institutions for preventing cascade formation.
The most essential observation is: information cascades are not “accidents” in the crypto market but a structural feature. Every 3–4 years, as technology tools lower signal costs, social media refresh mobilization media, and regulatory enforcement lag cycles reopen windows, cascades recur in new forms.
This chapter analyzed three representative manifestations of information cascades in the crypto market and demonstrated each pattern’s trigger signals, mobilization media, and collapse morphology. But cascades are only the top-layer dynamics — what truly allows cascades to be repeatedly institutionalized as funding instruments is the middle-layer agency structure problem. Chapter 3 enters the principal-agent collapse case collection, analyzing how BitConnect, Three Arrows Capital, Celsius, and FTX demonstrate extreme forms of agent-principal interest divergence in the crypto market.
Chapter 3 · Principal-Agent Collapse: Extreme Cases of Incentive Misalignment
3.1 Opening · Four Collapses, One Template
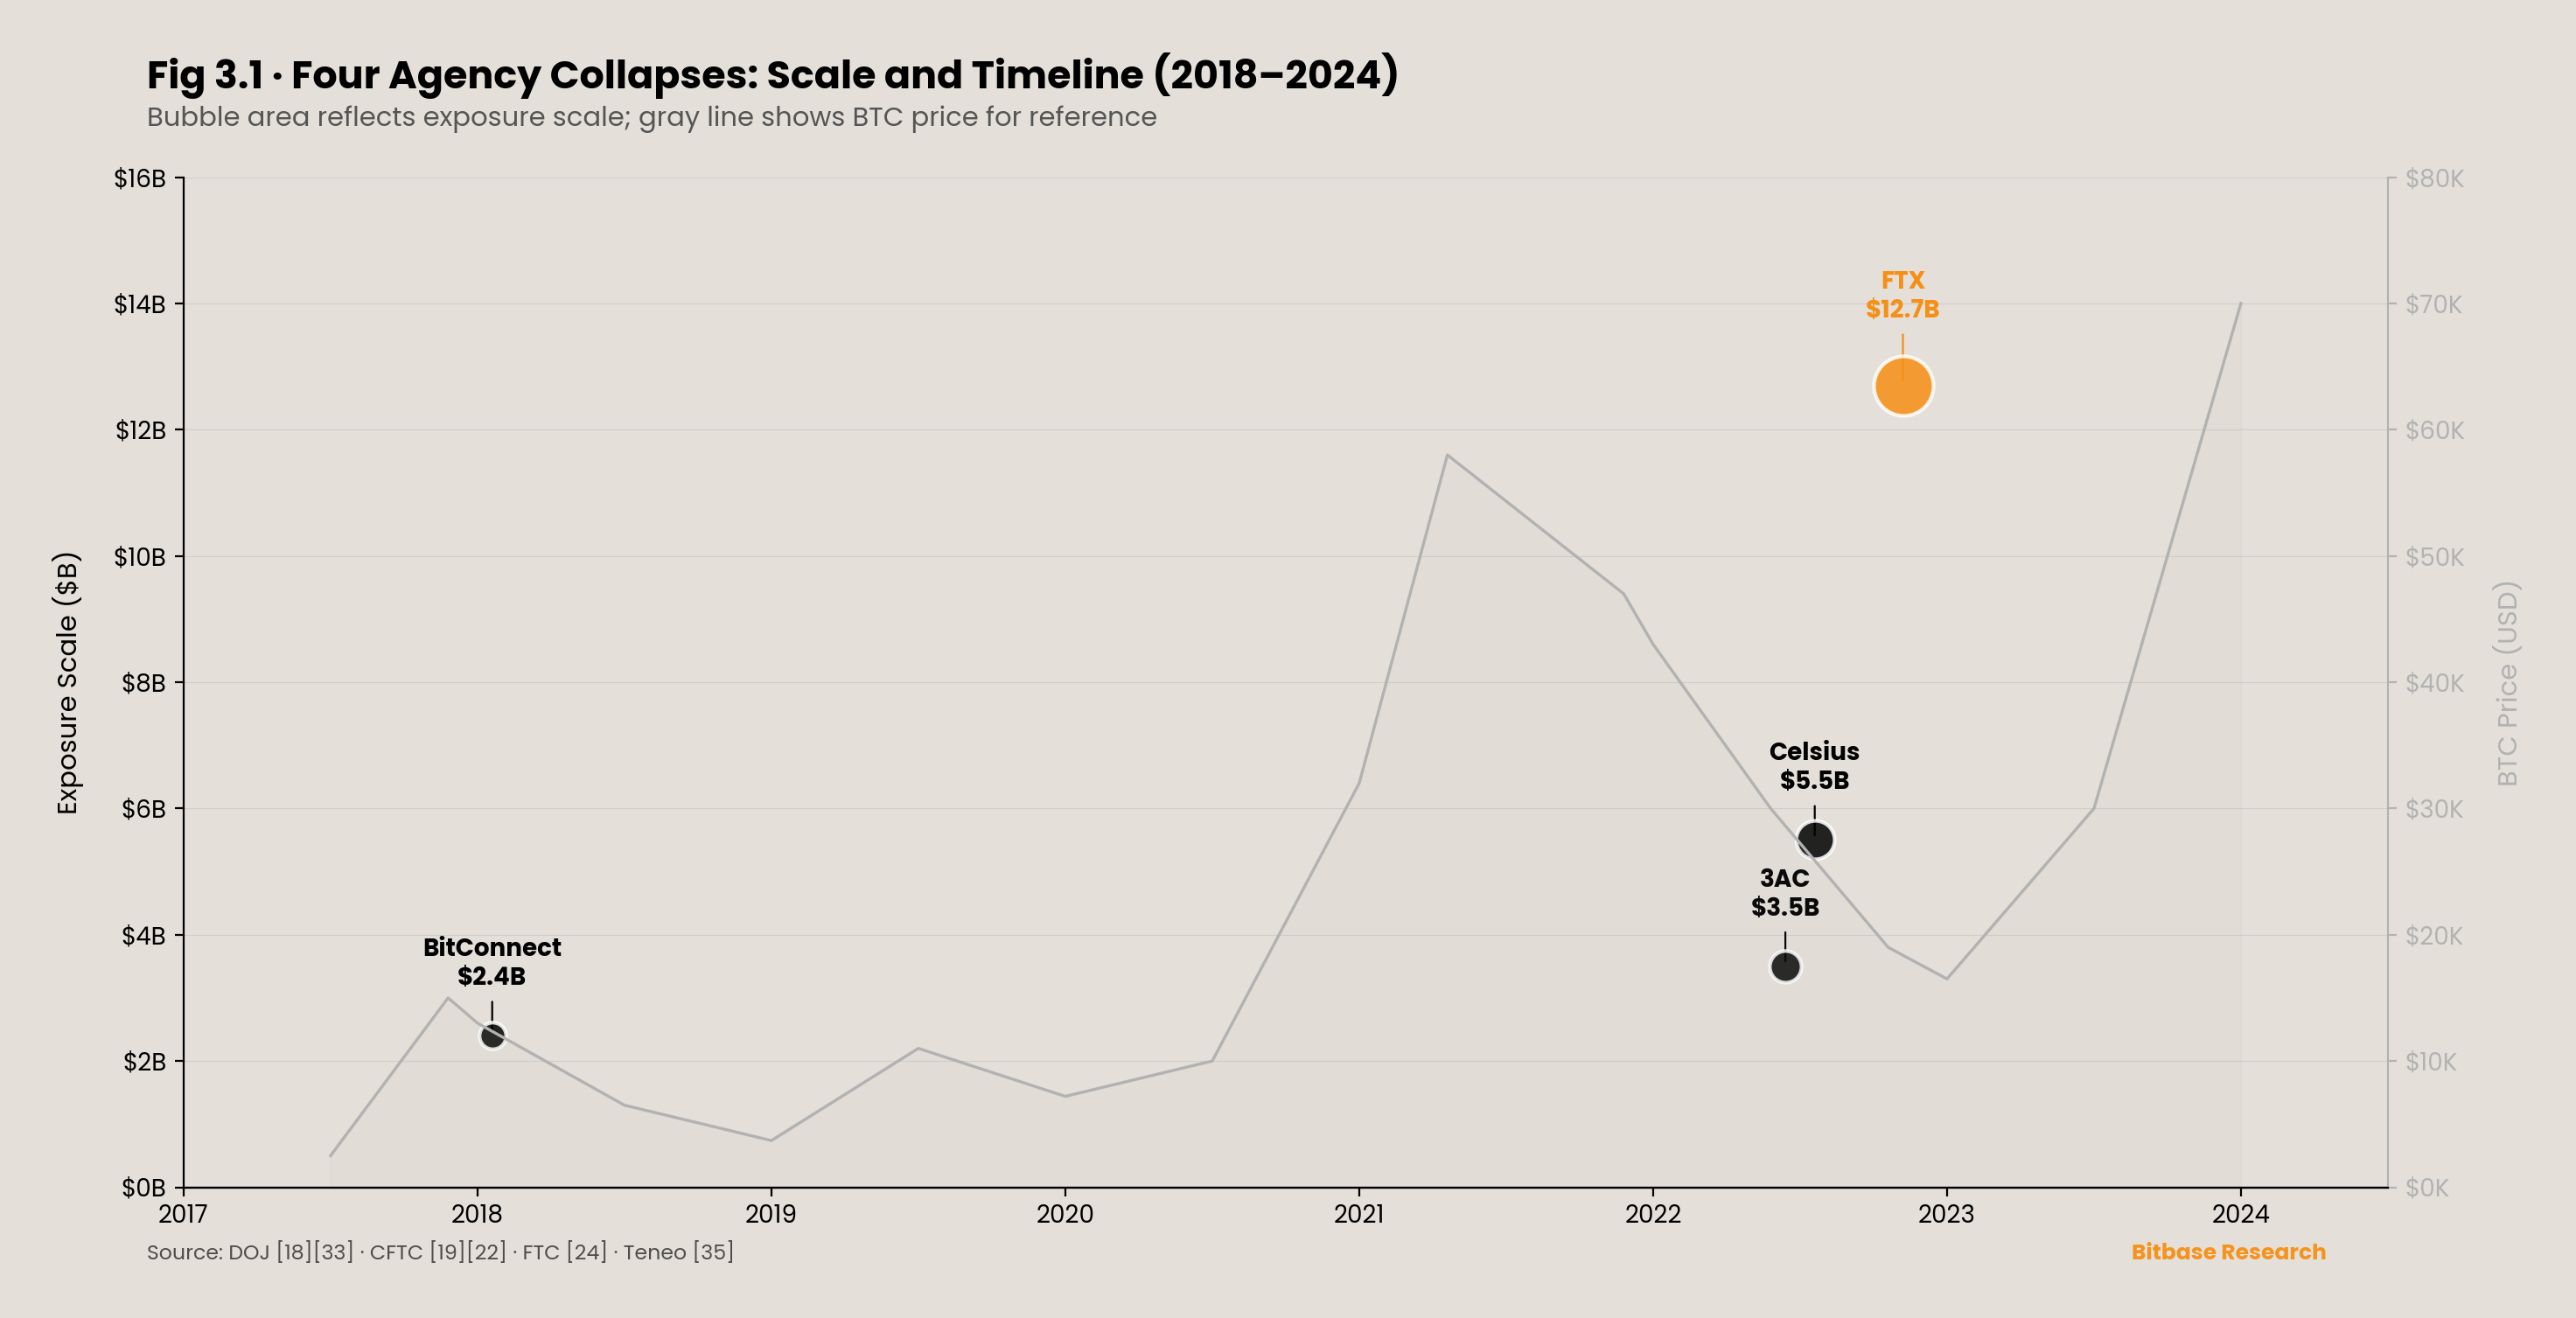
Over the six years from 2016 to 2022, four large-scale agency collapse events occurred in the crypto market, each presenting in a different business form but sharing the same set of preconditions at the agency structure level. BitConnect (2016–2018) absorbed investor assets under the guise of a “lending program”; the DOJ indictment determined fraud of approximately $2.4 billion. Three Arrows Capital (collapsed June 2022) operated as a crypto hedge fund; liquidation filings showed debts to 27 creditors totaling approximately $3.5 billion. Celsius Network (filed for bankruptcy July 2022) absorbed retail deposits under a “high-yield savings” narrative; day-one bankruptcy filings disclosed total liabilities of approximately $5.5 billion, with customer unsecured claims of approximately $4.7 billion. FTX (collapsed November 2022) held user assets in its capacity as an exchange custodian; the CFTC final judgment determined monetary relief of $12.7 billion.
The four cases spanned three complete phases of the crypto market — from ICO to DeFi Summer to the “institutionalization narrative” — yet agency collapses occurred in every phase, with exposure scale trending upward. This fact points to a structural question: what common conditions in the crypto market’s agency relationships allow large-scale value transfer to operate continuously for months or years before collapse? This chapter answers this question through deep analysis of four cases.
3.2 BitConnect · Ponzi-Type Agency Collapse
BitConnect’s “Lending Program” required users to deposit BTC into the platform, which claimed its “Volatility Software Trading Bot” would use these funds to trade, generating approximately 1% daily compound returns for users — approximately 3,700% annualized. The delegation act was complete at this point: asset control transferred from users to BitConnect operators, and users received an unverifiable “yield number” — displayed in BitConnect’s internal system, but users could not confirm whether it corresponded to real trading profits or redistribution from new incoming funds.
This structure simultaneously satisfies both adverse selection and moral hazard conditions under Jensen and Meckling’s [3] agency cost framework. At the adverse selection level: users could not evaluate before establishing the agency relationship whether the “trading bot” existed or possessed the claimed profitability — the agent’s type information was unobservable to the principal. At the moral hazard level: after the agency relationship was established, the operators’ actual fund utilization (whether funds were genuinely used for trading) was completely opaque to users — the agent’s action information was unobservable to the principal. The DOJ subsequently determined in its indictment [32]: “BitConnect operated a textbook Ponzi scheme” — i.e., the agent never actually executed the delegated task; the alleged trading bot either did not exist or never generated the claimed returns.[⁸]
[⁸]: Regarding BitConnect’s fraud scale, the SEC’s September 2021 civil complaint stated “$2 billion”; the DOJ’s February 2022 criminal indictment stated “$2.4 billion.” The discrepancy should be attributed to different calculation methods between civil and criminal proceedings. This chapter cites both figures in different contexts with sources noted.
BitConnect’s mobilization capability partly derived from its multi-tier promoter network. Operators paid commissions to promoters, who recruited new investors through YouTube videos, social media posts, and in-person events. Promoters occupied a dual identity within the agency structure: to investors, promoters were “information agents” whose publicly displayed investment experiences and yield demonstrations served as public action signals in an information cascade; to the platform, promoters were “acquisition agents” whose compensation was tied to new incoming capital. Lead U.S. promoter Glenn Arcaro pleaded guilty to federal criminal charges in September 2021; in January 2023, the court ordered him to pay restitution of $17 million to approximately 800 victims. This figure itself illustrates the leverage effect of promoters within the agency structure — one individual’s promotional activities could influence hundreds of principals’ asset allocation decisions.
The collapse was triggered along a path typical of Ponzi structure endgames. On January 3, 2018, the Texas State Securities Board issued a cease and desist order [34] against BitConnect, explicitly using “Ponzi scheme” language; the North Carolina securities department followed. On January 17, 2018, BitConnect shut down its lending program; BCC tokens plummeted 92% on the day, from a prior all-time high of approximately $463, entering irreversible value destruction. The collapse occurred not because “users collectively discovered the truth” but because regulatory action severed the new capital inflow — consistent with the theoretical prediction of Ponzi structures: when new capital flow is insufficient to cover existing commitments, the structure must collapse, with the collapse timing determined by external shock rather than internal information leakage.
BitConnect founder Satish Kumbhani was indicted [33] by a federal grand jury in February 2022, facing multiple criminal charges (wire fraud, money laundering, price manipulation, etc.) with a maximum sentence of 70 years. At the time of this report’s writing, Kumbhani’s whereabouts are unknown — the SEC confirmed he had left India, with his current country of residence unknown. India’s Enforcement Directorate seized approximately $190 million in assets linked to BitConnect in February 2025.[⁹]
[⁹]: India’s ED seizure of BitConnect assets source: CoinDesk, February 17, 2025, “India’s Directorate of Enforcement Seizes $190M in BitConnect Ponzi Scheme Case.” https://www.coindesk.com/policy/2025/02/17/india-s-directorate-of-enforcement-seizes-usd190m-in-bitconnect-fraud-case/
BitConnect represents the “purest” agency structure among the four cases — the agent never executed the delegated task, and agency costs equaled 100% of delegated assets. In the next case, the agency problem is implicit: returns genuinely existed, but risk exposure was systematically concealed.
3.3 Three Arrows Capital · Leverage-Type Agency Collapse
Three Arrows Capital (hereinafter “3AC”) was a crypto hedge fund registered in the British Virgin Islands (BVI), with peak assets under management reportedly exceeding $10 billion [35]. Its lenders — including Genesis ($2.3 billion), Voyager Digital ($685 million), Blockchain.com, and 27 creditors in total — lent to 3AC, trusting its capacity as a “professional crypto fund manager” for risk management.
3AC’s agency problem manifested in a critical information asymmetry structure: each individual lender could observe only its own loan terms and margin status with 3AC, but no single lender knew 3AC’s total borrowing scale and total position concentration across all other lenders. This was a “distributed lending + concentrated positioning” agency structure — each lender’s independently assessed risk exposure was far smaller than 3AC’s true systemic risk. Holmström’s [5] sufficient statistic theorem provides an inverse verification here: if lenders could observe a “cross-lender total position report” as an additional signal, that signal — given the output already known to any single lender (i.e., its own loan’s repayment performance) — would still provide additional information about 3AC’s true risk-taking behavior. Therefore, by Holmström’s theory, this signal should be incorporated into loan contract terms. In practice, the crypto lending market in 2022 lacked any such cross-institutional information-sharing mechanism. Genesis’s margin requirement for 3AC loans was only 80% — meaning 3AC could borrow $125 with $100 in margin, and Genesis could not confirm whether that $100 was simultaneously pledged to other lenders.
The collapse path began with the May 2022 Terra/Luna event. Court liquidation filings [35] documented that 3AC invested approximately $200 million to $600 million in LUNA tokens in February 2022; this investment was nearly entirely wiped out in May’s Terra collapse. Multiple lenders simultaneously issued margin calls; 3AC could not meet them. On June 27, 2022, the BVI court issued a liquidation order; on July 2, 3AC filed for Chapter 15 bankruptcy protection in the United States. Liquidator Teneo [35] subsequently disclosed a striking fact: 3AC had “virtually no books or records” — the liquidator initially could not even enter 3AC’s offices and required court assistance. “Virtually no books” was not merely a corporate governance failure but an extreme marker of agency collapse — the agent not only concealed the process of their actions but eliminated the possibility of ex post audit.
Court filings also disclosed founders Su Zhu and Kyle Davies’s conduct during liquidation: both were in Bali (per public reports, Zhu was surfing, Davies was painting); court documents recorded Zhu placing a deposit on a yacht valued at approximately $50 million; the liquidator sought to examine whether two Singapore Good Class Bungalows under Zhu’s wife’s name (valued at approximately $35 million and $21 million) were purchased with company assets. In September 2023, Zhu was arrested at Singapore Changi Airport while attempting to leave the country and was sentenced to 4 months’ imprisonment for refusing to cooperate with the liquidation process.
3AC’s collapse demonstrated agency risk contagion through lending chains. Genesis, devastated by 3AC’s $2.3 billion bad debt, had losses partially absorbed by parent company Digital Currency Group (DCG); Genesis ultimately went bankrupt in 2023. Voyager Digital filed for bankruptcy directly due to 3AC’s $685 million default. Blockchain.com conducted mass layoffs. Each layer of lending relationship had its own information asymmetry, but the layered systemic risk far exceeded any single layer’s observable level — this is the “contagion effect” of agency problems, where one lender’s agency collapse propagates through the creditor network into a systemwide credit crisis.
Makarov and Schoar [7] noted in their limits-of-arbitrage research that the crypto market’s price correction mechanisms are constrained by non-market frictions. 3AC’s case provides an extension of this conclusion to the credit market: lenders could theoretically track 3AC’s on-chain positions through on-chain data, but compliance, privacy, and technical frictions prevented this verification from being effectively applied in actual credit decisions. The crypto market’s “on-chain transparency” did not translate into effective monitoring within actual agency relationships.
3.4 Celsius · Deposit-Lending Agency Collapse
Celsius Network’s core narrative to users was “high-yield crypto savings”: deposit crypto assets into Celsius, earn 5%–18% annualized yields, and “withdraw anytime.” This narrative constructed an implicit principal-agent relationship — users delegated crypto asset management to Celsius, which promised safekeeping plus yield. However, Celsius’s Terms of Service permitted it to “use, pledge, lend, sell, and otherwise transact” users’ deposited crypto assets; the vast majority of users neither read nor understood the implications of this authorization.
Celsius’s asset deployment far exceeded “conservative lending”: lending customer assets to 3AC (Celsius was among 3AC’s creditors, with approximately $75 million in exposure); staking customer ETH; investing in high-risk DeFi protocols. These deployment paths were nearly invisible to users — users saw only “balance” and “yield” on the Celsius interface, unable to trace their assets’ actual destination.
As noted in Chapter 1, Cong, Li, and Wang [6] noted in their tokenized platform finance model that the positive feedback loop between platform token value and platform activity itself embeds an amplification mechanism for agency conflict. Though Celsius was not a typical token issuer, its platform token CEL’s dynamics fully conformed to this model: CEL price increase → attracts more user deposits → Celsius obtains more deployable funds → generates higher short-term yields → CEL price further increases. This positive feedback loop accelerated Celsius’s scale expansion during bull markets while concealing the true risk level on its asset side.
Celsius CEO Alex Mashinsky’s personal conduct further exacerbated moral hazard. The DOJ’s July 2023 indictment [37] charged Mashinsky with publicly stating “Celsius is safer than banks” while knowing the platform faced significant financial difficulties. In December 2024, Mashinsky pleaded guilty to two counts of commodities fraud and market manipulation.[¹⁰] This is not a “personal character” judgment but standard empirical evidence of moral hazard — the agent, during the agency relationship’s tenure, exploited information advantage to take actions detrimental to the principal’s interests, and when disclosure was required, chose misrepresentation.
[¹⁰]: Mashinsky guilty plea source: Reuters, December 3, 2024; DOJ December 2024 press release.
The collapse path was directly linked to 3AC. The May–June 2022 Terra/Luna and 3AC collapses’ cascading effects impacted Celsius’s asset side — 3AC, as one of Celsius’s borrowers, could not repay its loans, and DeFi protocol values simultaneously contracted. On June 12, 2022, Celsius announced suspension of all withdrawals — users discovered only at this moment that the “withdraw anytime” promise was unenforceable. On July 13, 2022, Celsius filed for Chapter 11 reorganization [38] in the U.S. Bankruptcy Court for the Southern District of New York (Case №22–10964); day-one filings disclosed total liabilities of approximately $5.5 billion, of which approximately $4.7 billion in customer unsecured claims, total assets of approximately $4.3 billion, and an asset-liability gap of approximately $1.2 billion. The FTC’s July 2023 settlement [24] separately imposed a $4.7 billion civil penalty on the Celsius corporate entity (an independent action, coincidentally matching customer claims in amount).
The Celsius and 3AC agency collapses connected through the same lending chain, demonstrating the second-order effects of layered agency: User → Celsius → 3AC → Terra/Luna. Each layer of agency relationship had its own information asymmetry, but the ultimate loss bearer was the retail depositor at the chain’s end — who, when depositing assets, did not know their funds were being lent to 3AC, much less that 3AC’s positions were concentrated on a directional bet on Terra/Luna. The FTC’s $4.7 billion penalty [24] legally confirmed a conclusion: Celsius’s “bank-like narrative” was factually a misrepresentation.
3.5 FTX · Custodial Agency Collapse
FTX’s agency structure was the most complex of the four cases. Users deposited assets into FTX exchange (role one: custodian); Alameda Research used these assets for directional proprietary trading (role two: proprietary trading); Alameda simultaneously provided market-making services for multiple trading pairs on FTX’s platform (role three: market making) — three roles concentrated under Samuel Bankman-Fried’s control. In traditional finance, the mandatory separation of custody and proprietary trading (Chinese Wall) is among the most basic compliance requirements; FTX not only lacked separation but embedded technical backdoors in its code enabling Alameda to bypass risk controls.
As cited in Chapter 1, the CFTC’s December 13, 2022 complaint [22] documented two specific technical details: an “allow negative flag” in FTX’s code that allowed Alameda’s account balance to go negative without triggering automatic liquidation, and a “virtually unlimited line of credit” granted to Alameda, enabling it to withdraw customer deposit funds for proprietary trading. The SEC’s December 21, 2022 independent complaint against Caroline Ellison and Gary Wang [23] restated the same mechanism in different language. Jensen and Meckling [3] decomposed agency costs into monitoring costs, bonding costs, and residual loss; in FTX’s case, monitoring costs approached infinity (users could not audit FTX’s internal fund flows), bonding costs approached zero (FTX’s terms of service did not explicitly prohibit misappropriation), and residual loss = the “exceeding $8 billion” misappropriation amount confirmed in the DOJ press release.
The collapse was triggered by a classic breaking of information asymmetry. On November 2, 2022, CoinDesk [36] reported that Alameda’s balance sheet held large quantities of FTT (FTX’s platform token) — information previously invisible to the market. Binance CEO Changpeng Zhao subsequently announced he would sell his FTT holdings, triggering market panic. Users began mass withdrawals; FTX could not meet withdrawal demands because customer funds had been misappropriated by Alameda. On November 11, 2022, FTX filed for Chapter 11 bankruptcy protection. From CoinDesk’s report to the bankruptcy filing — only 9 days — the world’s second-largest crypto exchange went from normal operations to bankruptcy in under two weeks.
Post-collapse revelations further illustrated the degree of agency monitoring absence: FTX had no independent board of directors; no independent CFO; no formal financial control systems; no customer asset segregation mechanism. On March 28, 2024, the U.S. Attorney’s Office for the Southern District of New York [18] announced Bankman-Fried was sentenced to 25 years of federal imprisonment; U.S. Attorney Damian Williams’s press release explicitly stated his misappropriation of customer funds “exceeding $8 billion.” The CFTC’s August 2024 final order [19] directed FTX to pay $12.7 billion in monetary relief to customers and victims, including $8.7 billion in restitution, with the court additionally issuing a forfeiture order “exceeding $11 billion.”
Holmström’s [5] sufficient statistic theorem provides another inverse verification: if users could observe the signal “whether customer assets are genuinely segregated from Alameda’s accounts,” that signal — given the output “platform operating normally” — would still provide additional information about the agent’s true behavior (whether misappropriation occurred). Therefore, by Holmström’s theory, this signal should be incorporated into a reasonable principal-agent contract. But FTX’s architecture never provided this observability to users. This was not an after-the-fact “omission” but a code-level presetting — the existence of the “allow negative flag” meant that asset non-segregation was an embedded premise of FTX’s operations, not an accidental outcome.
From BitConnect to FTX, the agency collapse structure evolved from “explicit Ponzi” to “implicit triple conflict,” but shared an invariant template.
3.6 The Common Template of Four Cases
The four cases’ agency structure parameters can be placed in parallel comparison. On the agency type dimension, BitConnect was pure Ponzi (agent never executed the delegated task); 3AC was fund-management type (agent executed investments but risk appetite far exceeded principals’ tolerance); Celsius was deposit-lending type (agent absorbed assets under a “savings” narrative then deployed them in high-risk activities); FTX was a triple-conflict type combining custody + proprietary trading + market making (three roles’ interests institutionally conflicted under one controller). On the critical information asymmetry dimension, BitConnect’s core unobservable was “whether the trading bot existed”; 3AC’s was “total positions across all lenders”; Celsius’s was “actual deployment path of customer assets”; FTX’s was “whether customer assets were genuinely segregated from the proprietary trading account.” On the external shock dimension, BitConnect’s trigger was a regulatory cease and desist; 3AC’s was the Terra/Luna collapse; Celsius’s was 3AC collapse contagion; FTX’s was media exposure of Alameda’s balance sheet plus CZ’s FTT sell announcement. On the exposed true scale dimension, from BitConnect’s $2.4 billion to 3AC’s $3.5 billion to Celsius’s $5.5 billion to FTX’s $12.7 billion — a full order of magnitude increase over six years.
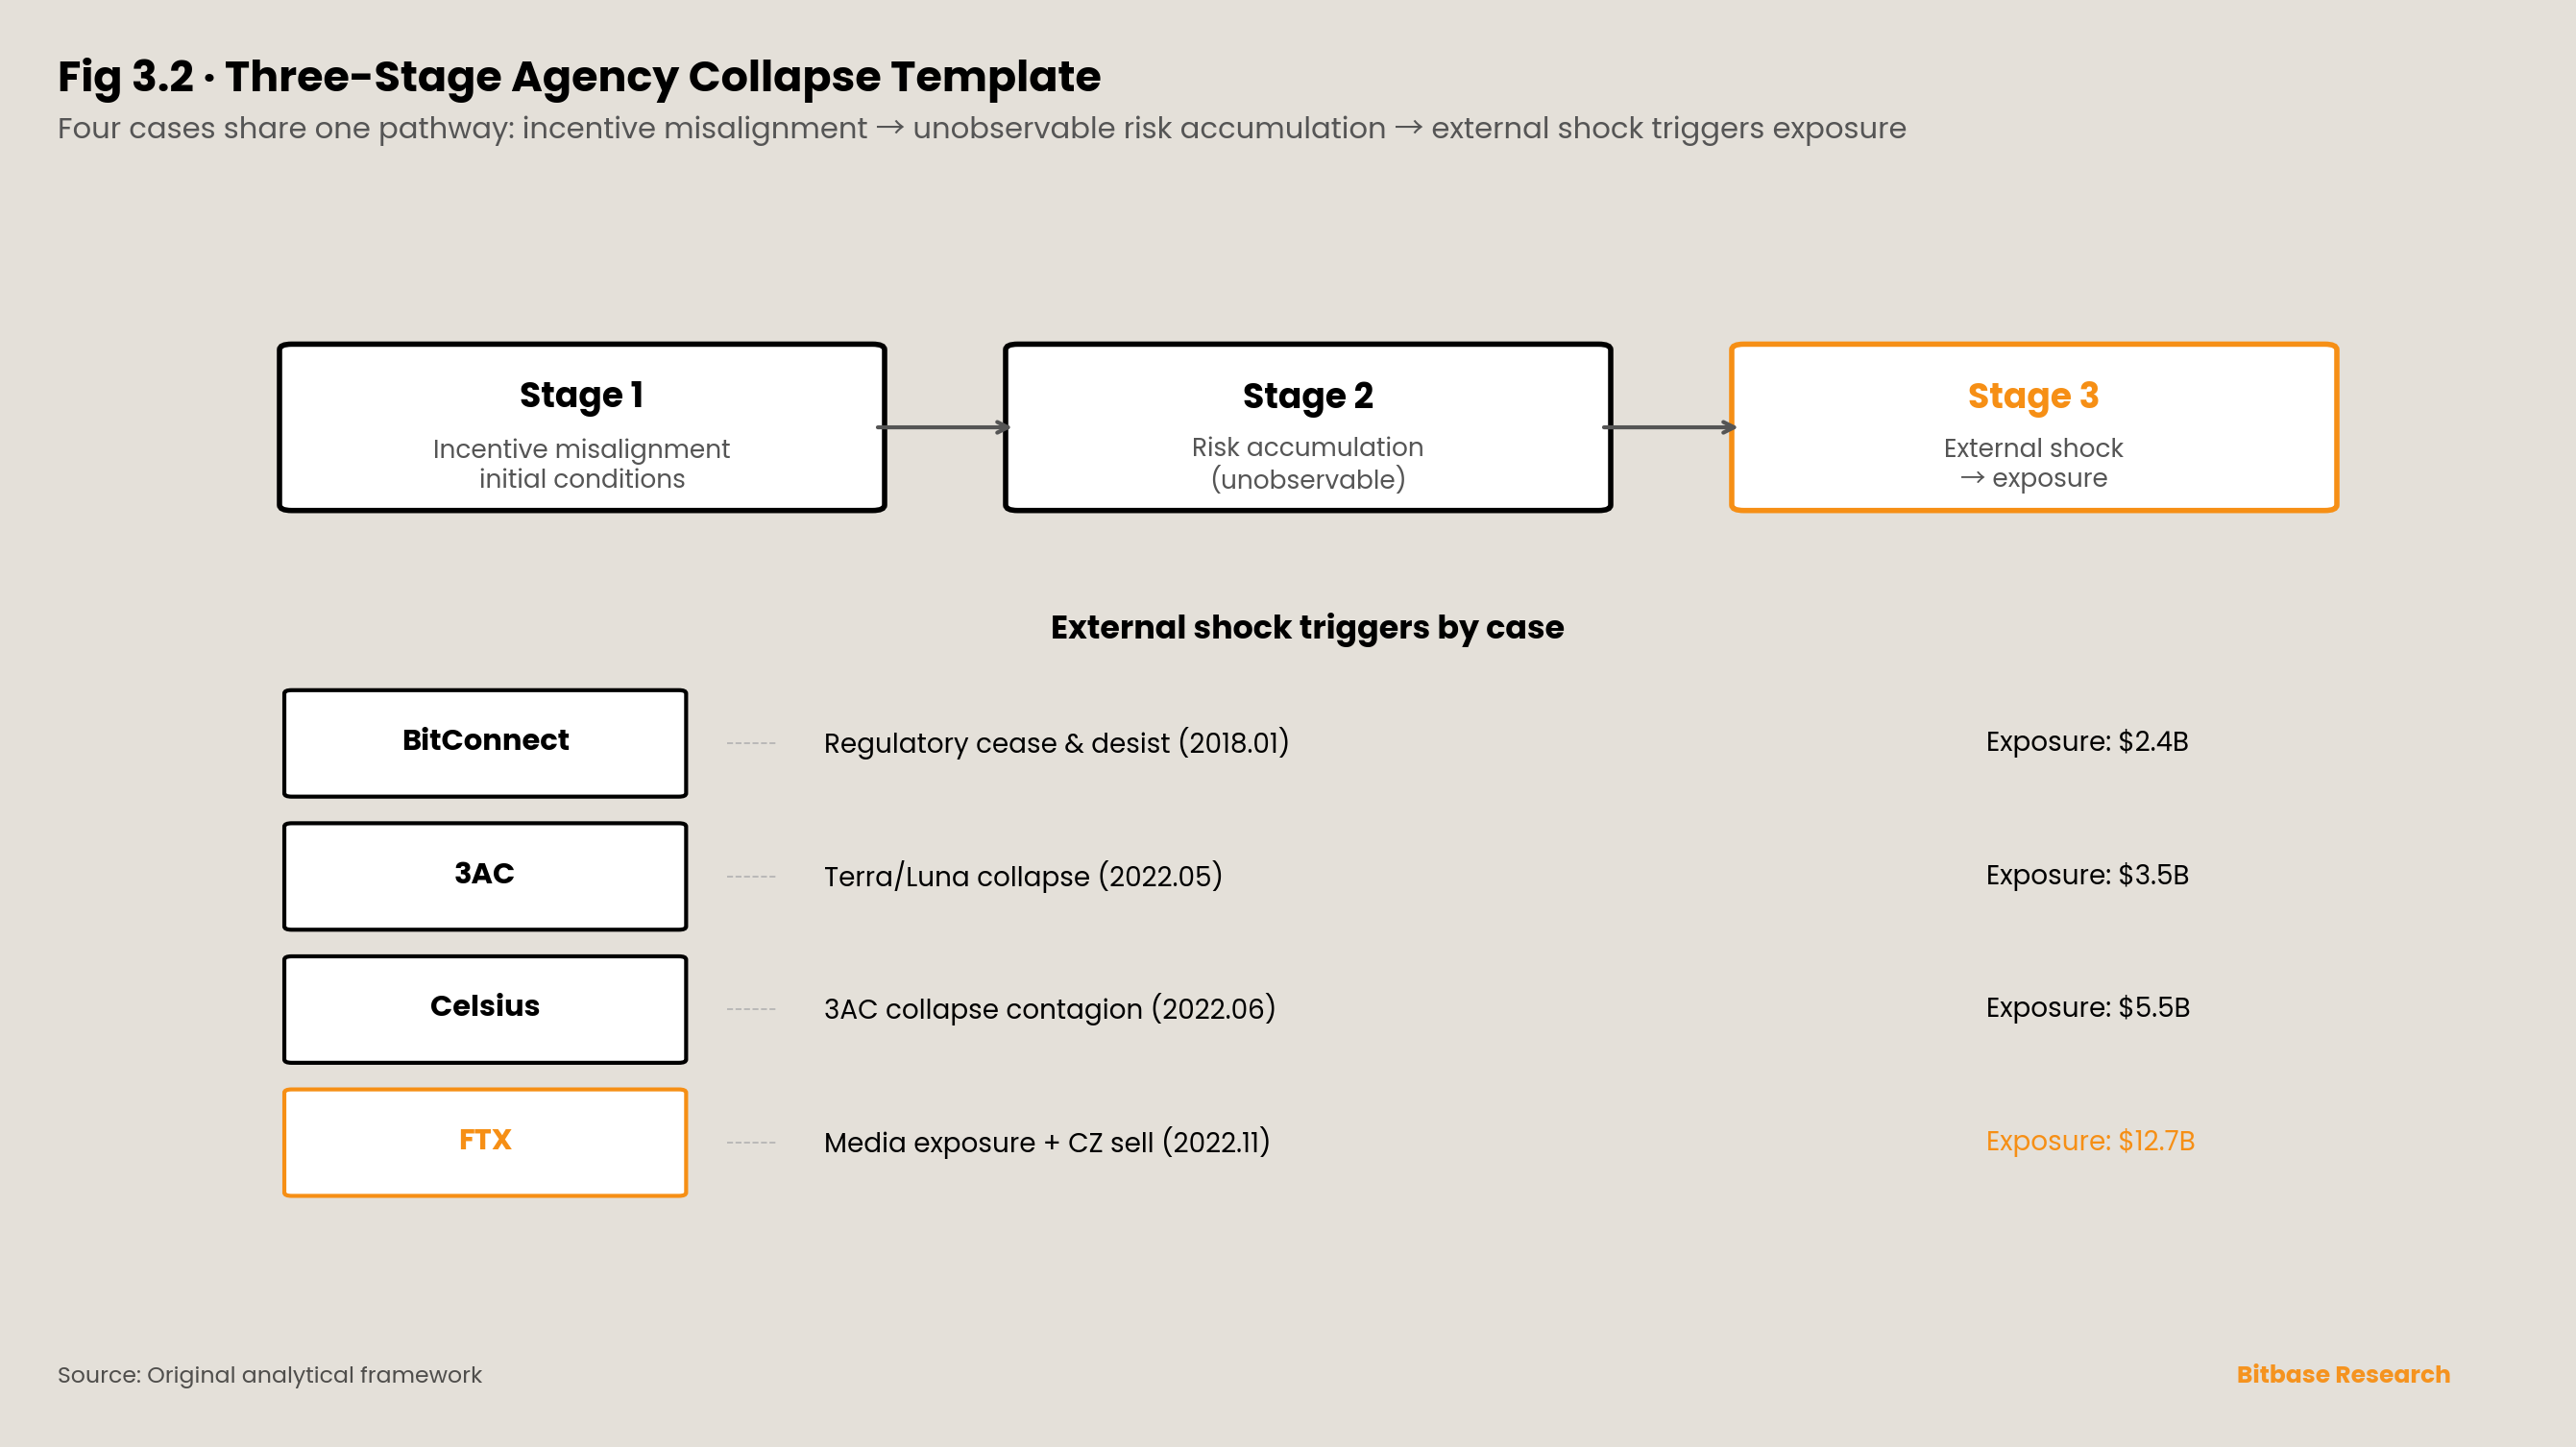
This report proposes that the four cases share a three-stage pathway:
Stage One: Initial conditions of incentive misalignment. The agent holds private information about their own actions + the principal lacks enforceable monitoring mechanisms + the agent’s incentive structure predisposes them toward excess risk-taking or direct misappropriation. This stage’s duration ranged from weeks (BitConnect’s early operations) to years (FTX operated for over three years).
Stage Two: Unobservable risk accumulation period. The agent accumulates risk exposure far exceeding commitments without the principal’s knowledge. This stage’s duration depends on two factors: market direction (a rising market masks losses) and new capital flow velocity (new incoming capital can cover existing commitments). BitConnect lasted approximately two years; 3AC’s leverage exceeded safe margins by early 2022 but was sustained for months by a rising market; Celsius’s asset-liability mismatch had formed by 2021; FTX’s misappropriation was embedded in code from Alameda’s inception.
Stage Three: External shock triggers scale exposure. Some exogenous event (regulatory action, market collapse, media exposure) breaks information asymmetry and the agent’s true behavior is exposed. Principals collectively retreat (withdrawal freezes, margin calls, law enforcement reports), and agency collapse completes within days to weeks.
The scale escalation from $2.4 billion to $12.7 billion is not coincidental. It reflects the crypto market’s “institutionalization narrative” progression — as the market attempted to go mainstream, agency structure complexity and managed asset scale grew in parallel, but the evolution speed of monitoring mechanisms lagged far behind the expansion speed of agency structures. The BitConnect era’s “whitepaper YouTube promotion” was sufficient to mobilize billions of dollars; the FTX era’s “VC endorsement + sports sponsorship + congressional lobbying” could mobilize trust at the hundred-billion level. Each era’s agency structure was more complex, harder to monitor, and larger in scale than its predecessor — while the regulatory framework was always catching up, never ahead.
Chapter 4 · Algorithm Design and Incentive Engineering: Failure at the Mechanism Layer
4.1 Opening · From People to Mechanisms
Chapter 3’s four cases — BitConnect, Three Arrows Capital, Celsius, FTX — can be attributed to specific agents’ behavioral choices: Kumbhani never operated the claimed trading bot; Zhu and Davies pushed leverage far beyond principal tolerance; Mashinsky made false statements while knowing the platform faced difficulties; Bankman-Fried preset misappropriation channels at the code level. Though structural conditions made these collapses possible, the ultimate triggers were traceable to specific individuals.
This chapter enters a deeper question: when agency conflict is not an individual’s choice but a design feature of the mechanism itself, the nature of market failure undergoes a fundamental change — it shifts from an “incidental event” correctable by punishing individual actors to a “structural feature” that requires mechanism redesign. This chapter demonstrates this transition through three case sets: Terra/Luna’s algorithmic stablecoin mechanism (algorithm design embedded a death spiral), tokenomics’ seigniorage structure (token issuance rules institutionalized agency conflict), and MEV (transaction ordering rights at the protocol layer became a structural agency problem). Their common characteristic: even if all participants are rational and well-intentioned, the mechanism itself produces asymmetric value distribution.
4.2 Terra/Luna · The Death Spiral of Algorithm Design
Before its May 2022 collapse, Terra was the third-largest crypto ecosystem after Bitcoin and Ethereum. The mint/burn mechanism between its algorithmic stablecoin UST and sister token LUNA operated as follows: when UST’s price exceeded $1, users could burn $1 worth of LUNA to mint 1 UST, earning the spread while reducing LUNA supply; when UST’s price fell below $1, users could burn 1 UST to mint $1 worth of LUNA, earning the spread while increasing LUNA supply. This bidirectional arbitrage mechanism theoretically maintained UST’s dollar peg.
Its critical flaw lay in the downward feedback loop. When UST’s circulating supply far exceeded LUNA’s market cap’s capacity to support redemptions, the LUNA sell pressure created by mass UST redemptions would drive LUNA’s price further down, and LUNA’s declining price meant that redeeming the same amount of UST required minting more LUNA, further increasing sell pressure — a self-reinforcing death spiral. Liu, Makarov, and Schoar [11], in their NBER paper Anatomy of a Run: The Terra Luna Crash, conducted an empirical analysis of this collapse based on complete on-chain data. Their core finding: the collapse was not caused by targeted manipulation by third parties but originated from market participants’ growing concerns about the sustainability of the system. This judgment moves the Terra/Luna collapse from the narrative of “individual malicious actors” into the analytical category of mechanism design failure.[¹¹]
[¹¹]: Terraform Labs founder Do Kwon subsequently faced criminal and civil prosecution in multiple jurisdictions. However, this chapter’s analytical focus is on the algorithmic mechanism’s structural flaws, not Do Kwon’s personal conduct.
Lyons and Viswanath-Natraj [12], in their research published in the Journal of International Money and Finance, provided a comparative framework for algorithmic stablecoin fragility. Their empirical findings demonstrated that fiat-collateralized stablecoins’ (such as Tether) peg stability primarily derives from demand-side arbitrage forces rather than issuer intervention — when Tether migrated from Omni to Ethereum, the lower entry barrier for arbitrage investors narrowed the arbitrage spread from 70 basis points to 30 basis points. Algorithmic stablecoins lacked this type of external anchor; their peg depended entirely on circular pricing between tokens. When the precondition for circular pricing (LUNA’s market cap being sufficient to cover UST redemptions) was broken, no external force could serve as lender of last resort.
The collapse’s amplifier was Anchor Protocol — a lending protocol promising approximately 19.5% annualized yield on UST deposits. Liu et al.’s [11] data showed that by April 2022, the daily subsidy required to maintain this yield had reached $6 million. The subsidy’s source was LUNA inflation and Terraform Labs (TFL) injections — in February 2022, Luna Foundation Guard (LFG) injected 510 million UST into Anchor’s yield reserves. Cong, Li, and Wang’s [6] “seigniorage” concept in their tokenized platform finance model found an extreme instance here: TFL, by controlling UST issuance and Anchor’s interest rate subsidies, was essentially exercising seigniorage power — attracting users in the short term while accumulating systemic risk over the long term. Anchor’s subsidy rate manifestly failed to satisfy the “time consistency” condition in Cong et al.’s [6] model: governance participants faced an interest conflict — reducing the subsidy rate would cause user outflows and token value decline, so short-term incentives consistently pointed toward maintaining unsustainable high yields.
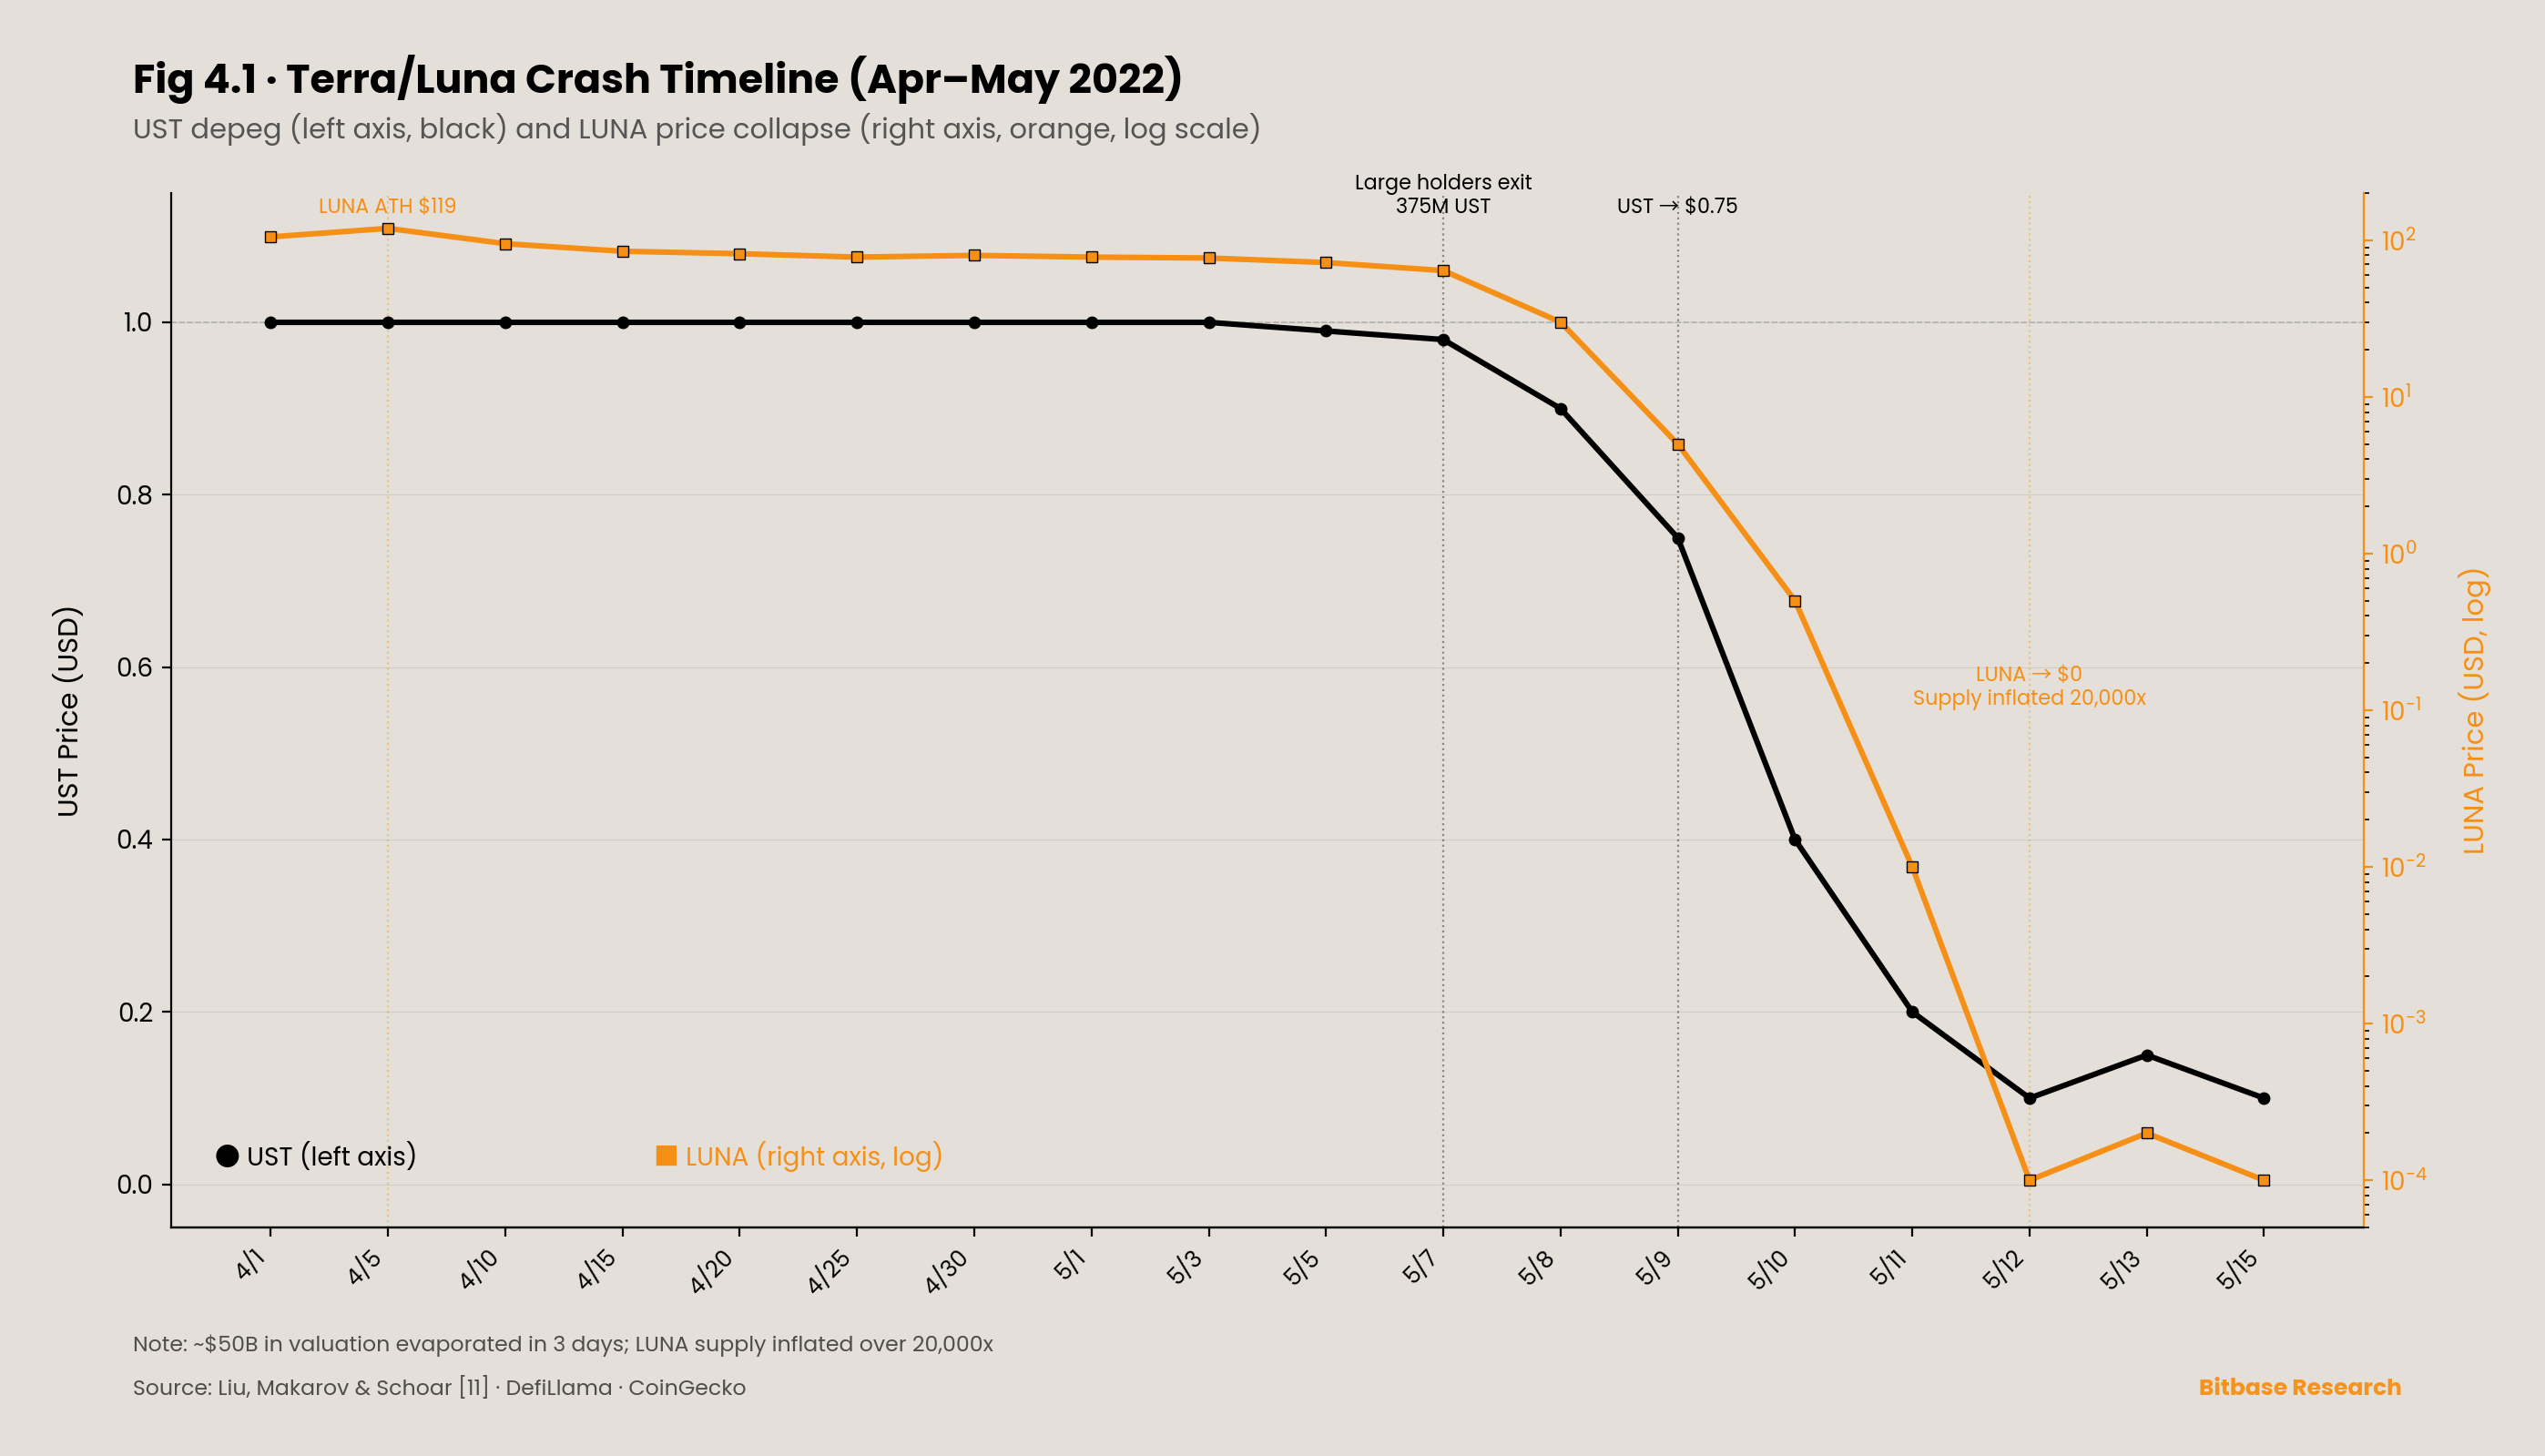
On May 7, 2022, a small number of large UST holders began repositioning — Liu et al. [11] documented two large addresses withdrawing 375 million UST from Anchor on that day. Other large traders followed. Blockchain technology enabled investors to monitor each other’s actions in real time, amplifying the speed of the run. On the evening of May 9, LUNA’s market cap crossed below UST’s circulating supply — the death spiral’s critical point — and UST’s price fell to $0.75. Over the following three days, approximately $50 billion in valuation was evaporated. LUNA’s supply inflated by over 20,000x during the collapse.
An underappreciated finding from Liu et al. [11]: wealthier, more sophisticated investors exited first and lost less; poorer, less sophisticated investors exited later and lost more. A significant portion of the latter even attempted to “buy the dip” during the collapse. This was not because the latter were “less rational” but because the former possessed better on-chain monitoring tools and lower exit friction. Information asymmetry here manifested not as “knowing vs. not knowing” but as “inequality of exit speed”. This differs critically from Chapter 3’s agency collapses: FTX’s Bankman-Fried knew what he was doing; but Terra/Luna’s problem was deeper — the mechanism’s risk characteristics exceeded the cognitive capacity of any single participant, including its designers.
4.3 Tokenomics Failure · The Institutionalization of Seigniorage
Tokenomics is not the technical question of “how project teams distribute tokens” but the design question of how agency conflict is institutionalized into token issuance rules. When project teams control token issuance cadence, unlock schedules, and market-maker lending terms, they are substantively exercising the “seigniorage” power described by Cong, Li, and Wang [6] — holders as residual claimants possess virtually no monitoring tools commensurate with that decision space.
This seigniorage power is institutionalized through at least three pathways.
Pathway One: Low float + high FDV issuance. As cited in Chapter 1, Worldcoin (World Foundation) [20] at its July 2023 launch allocated 25% of 10 billion WLD to insiders, with 75% nominally designated for the “community”; however, the maximum circulating supply at launch was only approximately 143 million tokens (1.43% of total supply), with approximately 70% lent to non-US market makers. The “price” that retail investors face on the secondary market corresponds to an equilibrium under extremely low float; when insiders gradually release tokens according to unlock schedules, the supply curve shift necessarily exerts downward pressure on secondary market prices. This spread is not “market volatility” — it is information asymmetry embedded by design in the issuance structure.
Pathway Two: Opacity of market-maker lending terms. Project teams typically lend 5%–15% of total supply to market makers as compensation for liquidity provision. Lending terms are not disclosed to token holders. In extreme scenarios, market makers can sell borrowed tokens (e.g., post-unlock or under market stress); the resulting sell pressure is borne by token holders, while the lending terms’ benefits are shared between the project team and market maker. This is a contract-level information asymmetry — holders know neither how many tokens were lent nor under what conditions they might be sold.
Pathway Three: Airdrop incentive engineering. As Chapter 2 analyzed from the information cascade perspective, the design authority over airdrop rules rests with the project team. From a mechanism design perspective, airdrops’ incentive structure contains an inherent agency conflict: the project team’s optimal strategy (maximizing short-term activity metrics to support valuation and subsequent fundraising) and token holders’ optimal strategy (long-term value growth) are in structural tension. When airdrop rules reward quantifiable metrics like “interaction count” or “bridging volume,” the project team is essentially using tokens to purchase growth metrics reportable to investors — and this purchase cost is ultimately transferred to token holders through dilution.
Akerlof’s [4] lemons model provides a tokenomics-level prediction here: when “high-quality projects” and “low-quality projects” in the token market share formally similar issuance structures (both low float high FDV + VC lockup), buyers cannot distinguish between them ex ante and can only bid at the average quality expectation. This average price is insufficient to cover high-quality projects’ actual value, weakening their issuance incentives — market average quality sinks downward. This is Akerlof’s “adverse selection leading to endogenous market quality collapse” directly mapped to the token issuance market.
The critical distinction between tokenomics’ agency conflict and Chapter 3: removing individual actors does not solve the problem. Even if the project team is completely honest, the low float + high FDV issuance structure still places retail investors at a statistical disadvantage — this is structural, not moral. Agency conflict is not concentrated in any individual but dispersed across issuance rules, unlock schedules, market-maker terms, and airdrop criteria. The design authority over these parameters rests with the project team, and token holders have virtually no avenue for participation or oversight.
4.4 MEV · The Protocol-Layer Agency Problem
Maximal Extractable Value (MEV) refers to value extractable by controlling intra-block transaction ordering — reordering, inserting, or excluding transactions. Daian et al. [13], in their Flash Boys 2.0 paper presented at IEEE S&P, made the foundational contribution of identifying MEV as a structural feature of blockchain consensus mechanisms rather than individual participants’ “abuse” — as long as transaction ordering authority exists, MEV exists.
In traditional finance, brokers owe their clients a “best execution” obligation — a core constraint on agent behavior. In the crypto market’s decentralized exchanges (DEXs), transaction ordering authority belongs to validators and block builders. Transactions submitted by users can be reordered, sandwiched between other transactions (sandwich attacks), or delayed to subsequent blocks before being confirmed. The three most common MEV strategies are: arbitrage (exploiting price differences across DEXs or pools), liquidation (triggering under-collateralized positions in lending protocols to earn rewards), and sandwich attacks (inserting a transaction before and after a user’s transaction to profit from price slippage).
MEV’s scale is no longer negligible. 2025 data [39a][39b] shows sandwich attacks accounted for 51.56% of total MEV transaction volume, approximately $290 million, representing over half of the total $562 million in MEV. This means over half of MEV extraction directly harms ordinary users’ trade execution prices — users pay higher costs than the fair price, with the difference captured by MEV searchers and block builders. On Ethereum, over 81% of validators have registered for MEV-Boost (Flashbots’ block-building relay), with MEV-Boost-produced blocks accounting for 89% over the past 14 days. On Solana, over 92% of validators run Jito’s MEV-related software, with even more extreme MEV concentration.
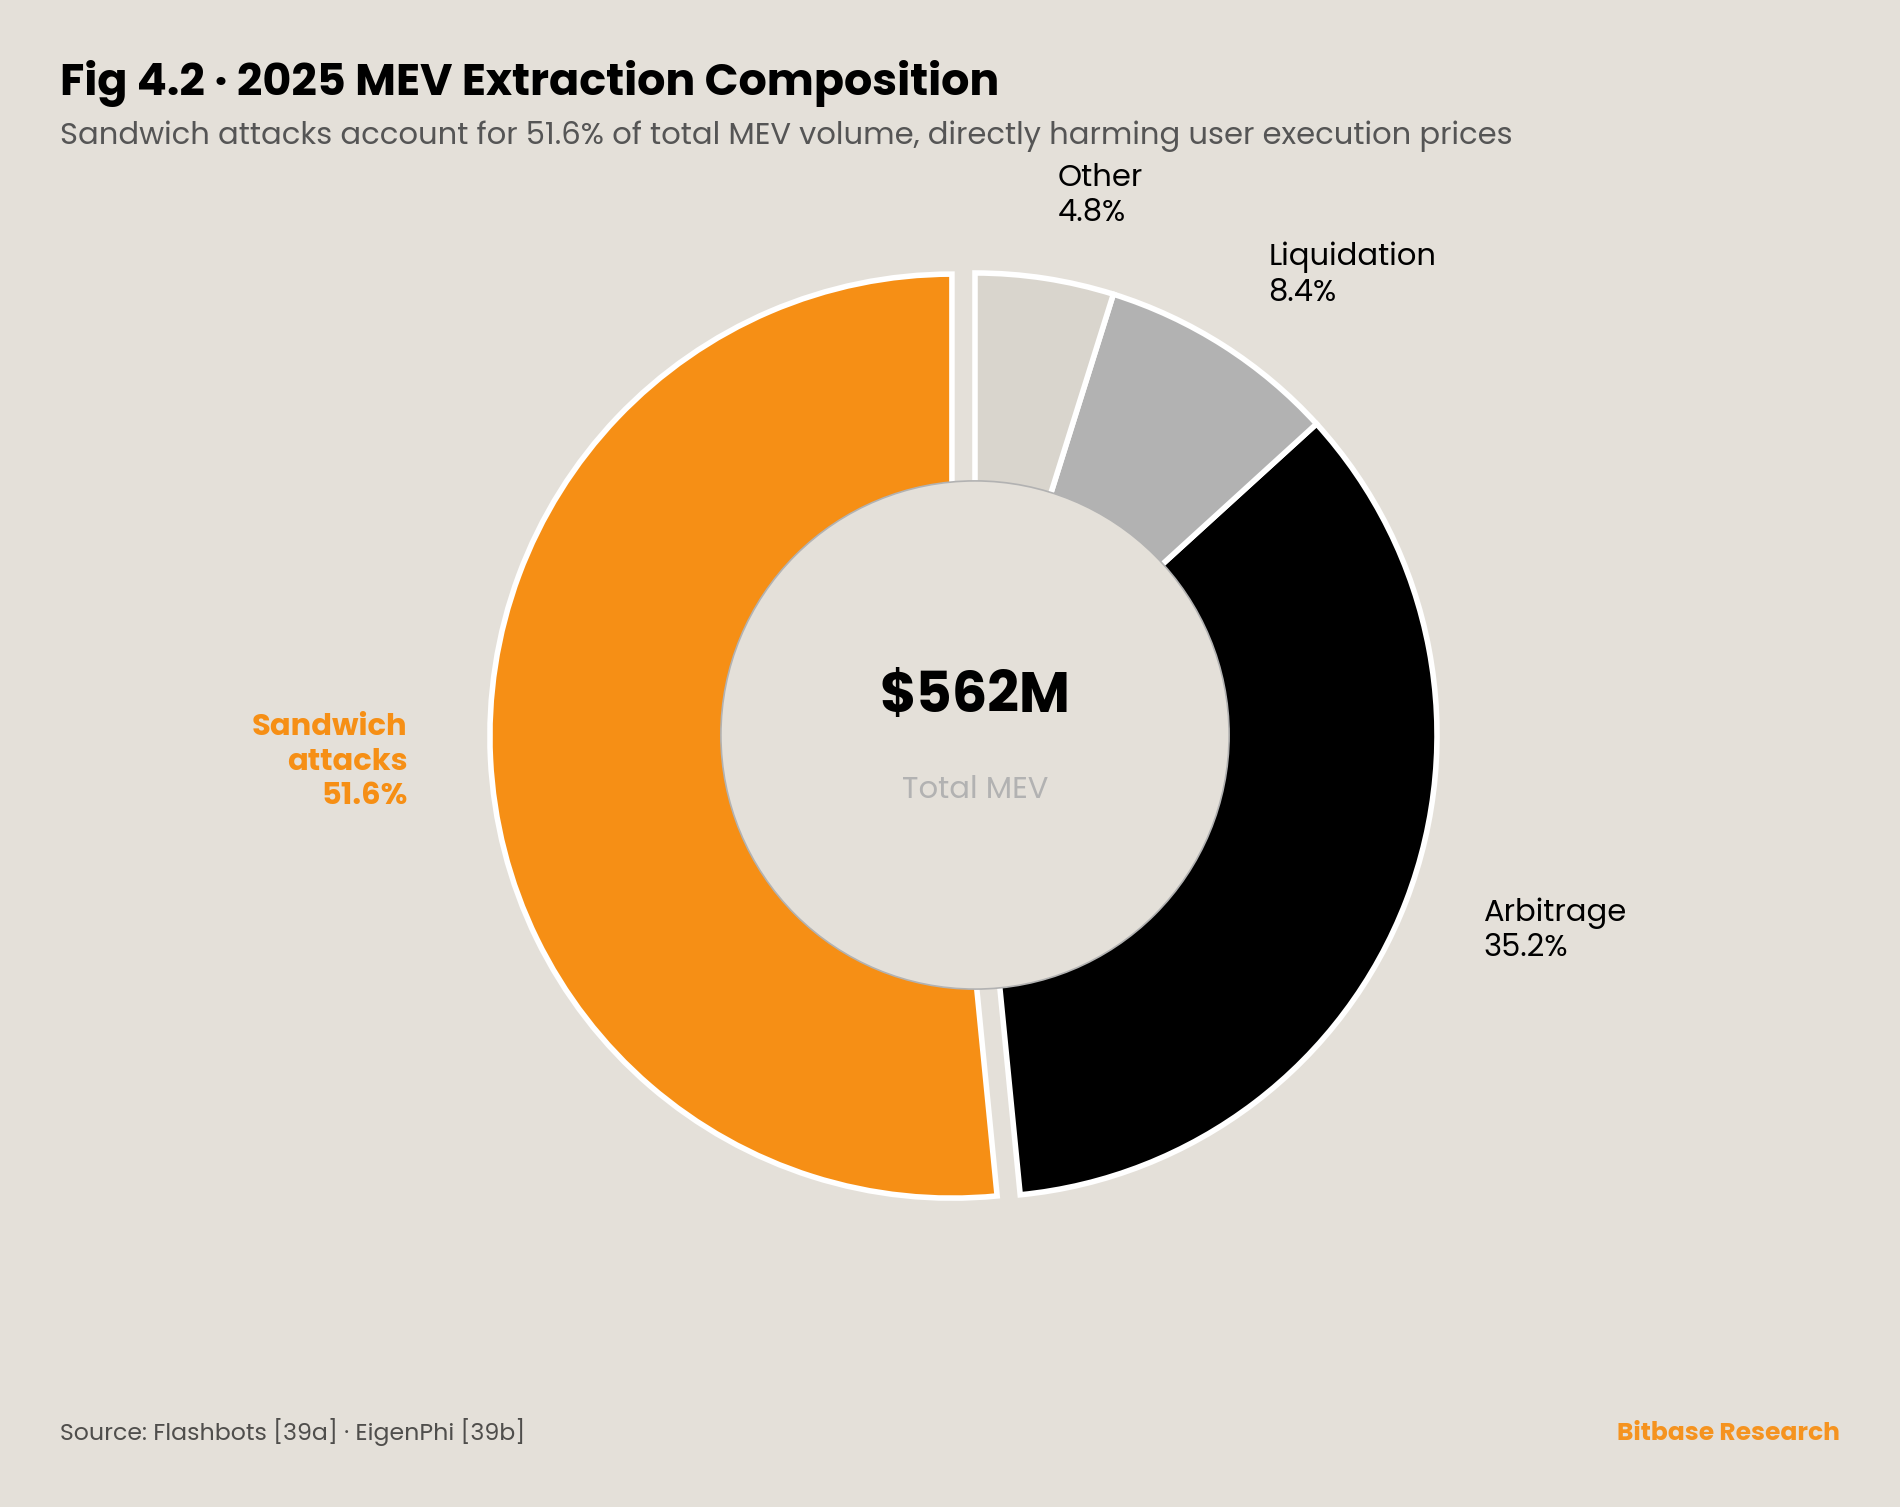
Makarov and Schoar [7] noted in their crypto market limits-of-arbitrage research that the crypto market’s price correction mechanisms are constrained by non-market frictions. MEV provides a protocol-layer extension of this conclusion: MEV searchers can see pending transactions in the mempool; ordinary users cannot — this is information asymmetry embedded at the protocol layer. Users cannot avoid MEV extraction through “smarter trading strategies” because the information gap lies not in strategy but in visibility of pending transactions. Tools like Flashbots Protect attempt to mitigate this by submitting private transactions that bypass the public mempool, but MEV itself cannot be entirely eliminated — it is an inevitable byproduct of the existence of transaction ordering authority.
MEV is the purest form of “mechanism-layer agency problem”: no fraudsters, no Ponzi structures, only asymmetric value extraction created by the protocol rules themselves. In May 2024, U.S. federal prosecutors filed criminal charges [41] against Anton Peraire-Bueno and James Peraire-Bueno for exploiting an MEV-Boost relay vulnerability to extract approximately $25 million from Ethereum transaction ordering in 12 seconds — the first case of MEV entering the criminal justice system, also demonstrating that when exploitation of “structural features” reaches a certain scale, the legal system begins to intervene but faces classification difficulties.
4.5 Common Characteristics of Mechanism-Layer Agency Conflict
The three case sets — Terra/Luna’s algorithmic death spiral, tokenomics’ institutionalized seigniorage, and MEV’s protocol-layer value extraction — superficially belong to different layers (algorithm design / token issuance / trade execution) but share a core structural characteristic: even if all participants are rational and well-intentioned, the mechanism itself produces asymmetric value distribution. Terra/Luna’s death spiral did not require a manipulator — the positive-feedback collapse pathway was embedded at design time. Tokenomics’ seigniorage did not require a fraudster — the low float + high FDV issuance structure statistically disadvantages retail investors. MEV did not require a malicious actor — the existence of transaction ordering authority itself creates extractable value.
This forms a clear contrast with Chapter 3’s “individual agency collapses”: Chapter 3’s problem is “removing individual actors could prevent the collapse”; Chapter 4’s problem is “removing individual actors cannot solve the problem — the mechanism itself must be redesigned.” This distinction carries governance implications — punitive enforcement (ex post prosecution of individuals) is effective for Chapter 3 but ineffective for Chapter 4; Chapter 4 requires mechanism-level redesign.
Returning to Chapter 1’s three-layer framework, this chapter completes a closed loop. Information asymmetry (Section 1.4) manifested at the mechanism layer: Terra/Luna’s risk was unobservable to most participants — Liu et al. [11] explicitly noted that “the system’s complexity made it difficult even for insiders to understand risk accumulation”; tokenomics’ true supply curve is unobservable to retail investors; MEV searchers’ mempool visibility versus ordinary users represents a structural information gap. Principal-agent conflict (Section 1.3) manifested at the mechanism layer: token designers and protocol designers, as mechanism builders, possess decision spaces far exceeding the monitoring capacity of token holders and users — Jensen and Meckling’s [3] agency cost framework is validated at the mechanism design level. Information cascades (Section 1.2) found an extreme instance at the mechanism layer: Terra/Luna’s on-chain transparency actually accelerated the run — a counterintuitive manifestation of Bikhchandani et al.’s [1] cascade model in an on-chain environment: more public information did not slow the cascade but increased its propagation speed by an order of magnitude.
The three-layer framework in this chapter completes a functional transition from “explaining historical cases” to “predicting mechanism design flaws”: any new token mechanism or protocol design that satisfies the triple condition of “base-layer information asymmetry + middle-layer agency power asymmetry + top-layer high-speed signal propagation” possesses the structural possibility of producing systemic value transfer. This judgment does not predict that a specific future event will occur but rather identifies a testable set of preconditions — Chapter 5’s governance pathways are built on the sequential correction of each precondition.
This chapter demonstrated how agency conflict escalates from the individual behavioral level to the mechanism design level — even without fraudsters, algorithm design, tokenomics, and protocol rules themselves can produce systemic value transfer. Chapter 5 proposes diagnostic and institutional pathways on this basis: if agency conflict is embedded in mechanisms, corrective pathways must also be at the mechanism level — a three-dimensional governance architecture comprising regulatory frameworks, protocol design, and platform self-regulation.
Chapter 5 · Diagnosis and Institutional Pathways: Where Are the Exits?
5.1 Diagnosis · The Correctability of Three-Layer Preconditions
Chapter 4 concluded that any token mechanism or protocol design satisfying the triple precondition of “base-layer information asymmetry middle-layer agency power asymmetry + top-layer high-speed signal propagation” possesses the structural possibility of producing systemic value transfer. This section assesses each precondition’s correctability layer by layer — which can be weakened through institutional improvement, and which are embedded features of the crypto market.
Base Layer · Information Asymmetry. The information asymmetries identified in Chapters 1–4 fall into at least two categories. The first is correctable through mandatory disclosure: token allocation tables (as in Chapter 1’s Worldcoin case with its 25%/75% insider-community allocation), team unlock schedules, and market-maker lending terms — this information is technically standardizable and enforceable for public disclosure; the problem is not whether disclosure is possible but whether institutions requiring it exist. The second is structurally unobservable: the true risk exposure of smart contracts (as in Chapter 4’s Terra/Luna death spiral mechanism, whose complexity exceeded most participants’ cognitive capacity including the designers’), and MEV searchers’ visibility advantage over the mempool — these cannot be resolved through “more disclosure” because even when information is made public, the comprehension threshold itself constitutes de facto information asymmetry. Existing corrective attempts include on-chain audits (e.g., security audit firms Certik, Trail of Bits) and Proof of Reserves (post-FTX, multiple exchanges adopted Merkle Tree reserve verification). Based on Chapters 1–4 analysis, this report’s assessment is: these tools reduce some information asymmetry but are far from eliminating it — audits cover code security but not economic mechanism design risk; Proof of Reserves covers asset status at a single point in time but not the agent’s behavior between two proofs.
Middle Layer · Agency Power Asymmetry. Similarly divided into two categories. The first is extendable from existing regulatory precedent: customer asset segregation at exchanges (the core flaw of Chapter 3’s FTX case) is covered by SEC rules for registered broker-dealers in traditional finance; stablecoin issuer reserve transparency is already required in some jurisdictions (e.g., NYDFS regulation of USDC issuer Circle). The second is difficult to constrain effectively under current institutional frameworks: token designers’ seigniorage power (Chapter 4’s tokenomics analysis) could theoretically be limited through DAO governance, but in practice DAO governance voting participation rates are generally low (industry observations commonly cite figures below 10%), large holders dominate decisions, and governance itself becomes another agency problem. Existing corrective attempts include the EU MiCA framework, Hong Kong’s VASP licensing regime, and Japan’s exchange registration system as ex ante admission regimes, plus ongoing improvements to DAO governance structures. This report’s assessment is: ex ante admission regimes are the single most effective tool for reducing Chapter 3-type agency collapse probability, but their effectiveness depends on cross-jurisdictional coordination — strict single-jurisdiction regulation is undermined by regulatory arbitrage when global coordination is lacking.
Top Layer · High-Speed Signal Propagation. This layer has the lowest correctability. On-chain data transparency and social media propagation speed are embedded features of the crypto market — Chapter 4’s Terra/Luna case demonstrated how on-chain transparency actually accelerated the run. These features cannot and should not be “restricted.” However, signal quality can be improved: requiring KOLs to disclose paid promotions (as in Chapter 1’s SEC $1.26 million penalty against Kim Kardashian), requiring project teams to disclose complete airdrop rule parameters (Chapter 2’s airdrop cases). Existing enforcement cases (SEC / FCA prosecutions of paid promotion on a case-by-case basis) have deterrent effects but have not formed a systematic regime. This report’s assessment is: signal propagation speed is not correctable, but signal information content can be incrementally improved through disclosure requirements — provided such requirements can be enforced across jurisdictions.
5.2 Three-Dimensional Governance Architecture
Based on the preceding diagnosis, this section proposes corrective pathways along three dimensions. Each pathway traces back to specific mechanism flaws identified in Chapters 1–4.
Dimension One · Regulatory Framework: From Ex Post Prosecution to Ex Ante Admission
The evidence across Chapters 1–4 collectively points to one fact: the crypto market’s primary regulatory mode to date has been “ex post prosecution” — the SEC, DOJ, and CFTC filed charges after collapses, and courts rendered judgments after liquidation was complete. BitConnect operated from 2016 to its 2018 collapse; the SEC did not file suit until 2021. FTX operated from 2019 to its 2022 collapse; the DOJ did not complete sentencing until 2023. Ex post prosecution’s deterrent effect exists (as Chapter 3 showed — Arcaro’s $17 million restitution, Bankman-Fried’s 25-year sentence), but it cannot prevent collapses — only allocate responsibility after the fact.
Ex ante admission regimes require exchanges, stablecoin issuers, and token issuers to meet a set of standards (capital requirements, customer asset segregation, disclosure obligations) before operating — standard practice in traditional financial markets. Makarov and Schoar [14], in their survey published in Brookings Papers on Economic Activity, explicitly noted that crypto market CEX trading volume is primarily concentrated on offshore exchanges “subject to little or no regulatory oversight.” The EU’s MiCA (passed in 2023, phased implementation from 2024), Hong Kong’s VASP licensing regime (implemented 2023), and Japan’s FSA exchange registration system (from 2017) are currently the three most complete ex ante admission frameworks.
This report’s assessment: ex ante admission is the single most effective tool for reducing Chapter 3-type agency collapses (exchange misappropriation, lending platform risk misallocation). However, its effectiveness faces a structural constraint — regulatory arbitrage. As long as jurisdictions exist that do not enforce equivalent admission standards, capital and users will flow to the most lightly regulated markets, undermining the institutional efficacy of strict-regulation jurisdictions. This is not unique to the crypto market, but the crypto market’s “borderless” technical characteristics make regulatory arbitrage easier to achieve than in traditional finance.
Dimension Two · Protocol Design: From “Trust the Agent” to “Verify the Mechanism”
Chapter 4’s three case sets demonstrated that mechanisms themselves can embed agency conflict — corrective pathways must therefore be at the mechanism design level, not only at the regulatory level.
Existing corrective attempts fall into four categories. Proof of Reserves: post-FTX, multiple exchanges adopted Merkle Tree-based reserve verification, allowing users to verify whether the exchange holds sufficient reserve assets without trusting a third party. This is a direct instance of the shift from “trust the agent” to “verify the mechanism.” MEV mitigation: as discussed in Chapter 4, Flashbots Protect submits private transactions bypassing the public mempool, and MEV-Share returns a portion of MEV to users — these solutions attempt to redistribute rather than eliminate MEV. Stablecoin design improvements: Lyons and Viswanath-Natraj’s [12] research cited in Chapter 4 demonstrated that fiat-collateralized stablecoins’ stability derives primarily from arbitrage structure rather than issuer intervention — this finding provides empirical support for the “over-collateralization + real-time audit” design pathway (e.g., USDC’s Circle monthly attestations) while drawing boundaries for algorithmic stablecoin alternatives. Token unlock transparency: some projects have begun publicly disclosing complete unlock schedules and market-maker terms; while not yet industry standard, the direction is consistent with this report’s Chapter 4 diagnosis of tokenomics seigniorage power.
This report’s assessment: the “trust the agent” model in the crypto market has been systematically falsified by Chapter 3’s four cases. “Trustless verification” is a more promising pathway, but its applicability is constrained by current technology maturity — Proof of Reserves can verify that assets exist but cannot verify whether assets are simultaneously pledged to other parties (as in Chapter 3’s 3AC case of multiple pledging).
Dimension Three · Platform Self-Regulation: From “Growth First” to “Incentive Compatibility First”
This dimension is most controversial — under misaligned incentives, is “self-regulation” credible? Chapters 1–4 analysis provides a conditional answer.
Chapter 2’s Hyperliquid airdrop case provides a positive reference: when incentive rules were anchored to difficult-to-automate genuine trading behavior, Sybil operations’ marginal returns decreased, and post-issuance token price performance outperformed control cases lacking anti-Sybil measures (zkSync −39% in 36 days vs. Hyperliquid’s sustained post-issuance appreciation). This demonstrates that mechanism-design-level incentive compatibility can produce better market outcomes without external regulation.
This report’s assessment: platform self-regulation cannot substitute for regulation — BitConnect and FTX’s experiences demonstrate that when agents’ interests severely diverge from users’, self-regulation will not occur. However, mechanism-design-level self-regulation (incentive compatibility) can complement regulatory frameworks. Platforms that proactively reduce agency conflict at the mechanism design level — through more transparent token allocation, incentive rules harder to exploit via Sybil, and more rigorous self-auditing — may possess structural competitive advantages in long-term competition, because trust itself is a scarce and competitive resource.
5.3 Limitations and Open Questions
The corrective pathways’ boundaries must be honestly discussed.
Limitation One: Regulatory arbitrage cannot be eliminated. As long as multiple independent jurisdictions exist, regulatory arbitrage exists. The crypto market’s “borderless” characteristic — users can access any jurisdiction’s exchange via VPN — makes regulatory arbitrage more severe than in traditional finance. MiCA is effective in the EU, but if the majority of trading volume remains concentrated on offshore platforms not subject to MiCA (as Makarov and Schoar [14] documented), its practical impact will be diluted. Global regulatory coordination is theoretically optimal but lacks an enforceable coordination mechanism in geopolitical reality.
Limitation Two: MEV cannot be eliminated. As analyzed in Chapter 4, MEV is an inevitable byproduct of transaction ordering authority. Solutions such as Flashbots can redistribute MEV (returning partial value to users) but cannot eliminate MEV’s existence. This means the protocol-layer agency problem is a long-term structural feature that can be managed but not solved — as long as blockchains maintain decentralized transaction ordering mechanisms, transaction orderers hold an information advantage over ordinary users.
Limitation Three: Information cascades cannot be eliminated. On-chain data transparency and social media propagation speed are embedded technical features of the crypto market. Chapter 2’s three cascade waves (ICO / Memecoin / Airdrop) demonstrated a pattern: whenever signal costs are reduced, cascades recur in new forms. The cascade’s “speed” may be reduced through cooling periods or trading restrictions, but the cascade’s “occurrence” cannot be prevented — it is a structural product of the crypto market’s information architecture.
Limitation Four: This report’s own limitations. This report is a survey and commentary, containing no original empirical research. Citations are based on publicly published paper abstracts, official descriptions, and mainstream academic media reporting verification (see the “Statement” section at the end). Case selection inevitably suffers from “the inverse of survivorship bias” — this report analyzes collapse cases and failure mechanisms, but well-functioning agency structures also exist in the crypto market: Coinbase operates as a U.S. registered broker-dealer, USDC maintains monthly audit transparency, and Hyperliquid’s airdrop design demonstrates the possibility of incentive compatibility. This report’s analytical framework aims to identify failure preconditions but should not be interpreted as a blanket negative judgment on the crypto market as a whole.
Finally, this report leaves one unanswered open question: can the crypto market’s agency conflicts be sufficiently mitigated without importing traditional finance’s regulatory architecture? Or will the crypto market ultimately need to converge toward a regulatory density similar to traditional finance? The answer to this question will be jointly determined by market evolution, technological development, and regulatory practice, and is beyond any single research report’s capacity to resolve.
This report, starting from three theoretical pillars, constructed a three-layer analytical framework — from information asymmetry to agency conflict to information cascades — through the ICO bubble, Memecoin Casino, and airdrop farming as three information cascade case sets; BitConnect, Three Arrows Capital, Celsius, and FTX as four agency collapse case sets; and Terra/Luna, tokenomics, and MEV as three mechanism design failure case sets. This framework’s value lies not in explaining collapses that have already occurred but in identifying the set of preconditions that may produce systemic value transfer in the future — and, for each precondition, the possible corrective pathways and their limitations.
Statement
Conflict of Interest Disclosure: This report is produced by Bitbase Research. Bitbase Research is the research division of the Bitbase derivatives exchange. The market failure mechanisms discussed in this report — particularly those involving principal-agent relationships between exchanges and users — also exist in the market environment in which the Bitbase platform operates. This report’s research position is to diagnose structural problems to promote industry evolution, not self-justification.
Tools and generation assistance. This report used advanced large language models as research assistance tools in the processes of material gathering, cross-source fact verification, structured argument, and draft writing. All primary data, regulatory documents, academic papers, and market indicators were human-verified item by item against their original sources; all mathematical formulas, cryptographic technical details, and legal citations were reviewed and either retained or corrected by humans. We acknowledge the inherent error risk of AI assistance tools in long-tail data handling, and we have reduced this risk through multi-round fact-checking processes, but we cannot fully eliminate it.
Non-investment-advice statement. This report and all analysis, data, frameworks, and conclusions it contains are for industry research and academic discussion only. Nothing in this report should be interpreted as advice to purchase, sell, or hold any digital asset, derivatives contract, or specific platform. Reading this report does not establish any form of fiduciary or investment advisory relationship with the authors or with Bitbase. Industry participants should make commercial decisions based on their own due diligence or that of independent third parties.
Feedback and corrections. Bitbase Research welcomes readers to submit corrections and critiques regarding data citations, factual statements, or logical reasoning. If any factual errors or argumentation flaws are identified, we welcome them through public channels and will confirm and correct them in subsequent tracking reports or errata notices.
References
Academic Literature
[1] Bikhchandani, S., Hirshleifer, D., & Welch, I. (1992). A Theory of Fads, Fashion, Custom, and Cultural Change as Informational Cascades. Journal of Political Economy, 100(5), 992–1026. https://doi.org/10.1086/261849
[2] Kogan, S., Makarov, I., Niessner, M., & Schoar, A. (2024). Are Cryptos Different? Evidence from Retail Trading. Journal of Financial Economics, 159, 103897. https://doi.org/10.1016/j.jfineco.2024.103897
[3] Jensen, M. C., & Meckling, W. H. (1976). Theory of the Firm: Managerial Behavior, Agency Costs and Ownership Structure. Journal of Financial Economics, 3(4), 305–360. https://doi.org/10.1016/0304-405X(76)90026-X
[4] Akerlof, G. A. (1970). The Market for “Lemons”: Quality Uncertainty and the Market Mechanism. The Quarterly Journal of Economics, 84(3), 488–500. https://doi.org/10.2307/1879431
[5] Holmström, B. (1979). Moral Hazard and Observability. The Bell Journal of Economics, 10(1), 74–91. https://doi.org/10.2307/3003320
[6] Cong, L. W., Li, Y., & Wang, N. (2022). Token-Based Platform Finance. Journal of Financial Economics, 144(3), 972–991. https://doi.org/10.1016/j.jfineco.2021.10.002
[7] Makarov, I., & Schoar, A. (2020). Trading and Arbitrage in Cryptocurrency Markets. Journal of Financial Economics, 135(2), 293–319. https://doi.org/10.1016/j.jfineco.2019.07.001
[8] Shleifer, A., & Vishny, R. W. (1997). The Limits of Arbitrage. The Journal of Finance, 52(1), 35–55. https://doi.org/10.1111/j.1540-6261.1997.tb03807.x
[9] Swartz, L. (2022). Theorizing the 2017 Blockchain ICO Bubble as a Network Scam. New Media & Society. https://doi.org/10.1177/14614448221099224
[10] Haffke, L., & Fromberger, M. (2018). ICO Market Report 2017: Performance Analysis of Initial Coin Offerings. SSRN Working Paper 3309271. https://papers.ssrn.com/sol3/papers.cfm?abstract_id=3309271
[11] Liu, J., Makarov, I., & Schoar, A. (2023). Anatomy of a Run: The Terra Luna Crash. NBER Working Paper №31160. https://www.nber.org/papers/w31160
[12] Lyons, R. K., & Viswanath-Natraj, G. (2023). What Keeps Stablecoins Stable? Journal of International Money and Finance, 131, 102777. https://www.nber.org/papers/w27136
[13] Daian, P., Goldfeder, S., Kell, T., Li, Y., Zhao, X., Bentov, I., Breidenbach, L., & Juels, A. (2020). Flash Boys 2.0: Frontrunning in Decentralized Exchanges, Miner Extractable Value, and Consensus Instability. 2020 IEEE Symposium on Security and Privacy (SP), 910–927. https://doi.org/10.1109/SP40000.2020.00040
[14] Makarov, I., & Schoar, A. (2022). Cryptocurrencies and Decentralized Finance (DeFi). Brookings Papers on Economic Activity, Spring 2022. https://www.nber.org/papers/w30006
Regulatory Filings, Court Documents, and Empirical Data Sources
[15] Cointelegraph / The Block / Fortune / DL News. $LIBRA event consolidated reporting, February 2025. https://cointelegraph.com/news/milei-libra-token-scandal-107m-rug-pull
[16] Nansen. $LIBRA on-chain wallet analysis (114,000 wallets / $251 million in losses).
[17] Fortune / Chainalysis. “TRUMP memecoin traders lost $2 billion.” February 11, 2025. https://fortune.com/2025/02/11/trump-memecoin-traders-2-billion-dollar-loss-family-100-million-fees/
[18] DOJ / U.S. Attorney’s Office, S.D.N.Y., March 28, 2024. “Samuel Bankman-Fried Sentenced to 25 Years in Prison.” https://www.justice.gov/usao-sdny/pr/samuel-bankman-fried-sentenced-25-years-prison
[19] CFTC Press Release 8938–24, August 7, 2024. “Federal Court Orders FTX and Alameda to Pay $12.7 Billion.” https://www.cftc.gov/PressRoom/PressReleases/8938-24
[20] World Foundation, “The Circulating Supply of Worldcoin (WLD): An Explainer”; Kaiko Research, “Worldcoin Tokenomics.”
[21] SEC Press Release 2022–183, October 3, 2022. “SEC Charges Kim Kardashian.” https://www.sec.gov/newsroom/press-releases/2022-183
[22] CFTC Press Release 8638–22, December 13, 2022. “CFTC Charges Sam Bankman-Fried, FTX Trading and Alameda with Fraud.” https://www.cftc.gov/PressRoom/PressReleases/8638-22
[23] SEC Press Release 2022–234, December 21, 2022. “SEC Charges Caroline Ellison and Gary Wang.” https://www.sec.gov/newsroom/press-releases/2022-234
[24] FTC, July 13, 2023. “FTC Reaches Settlement with Crypto Platform Celsius Network.” https://www.ftc.gov/news-events/news/press-releases/2023/07/ftc-reaches-settlement-crypto-platform-celsius-network-charges-former-executives-duping-consumers
[25] TokenData. ICO funding statistics 2017–2018. https://www.tokendata.io (original source offline; figures cross-verified via Swartz 2022 [9], Haffke & Fromberger 2018 [10], and multiple secondary sources).
[26] ICObench. ICO project count statistics 2017–2018. https://icobench.com (original source offline; figures cross-verified via Cointelegraph 2019–01–05 “ICO Market 2018 vs 2017”).
[27] SEC, July 25, 2017. “Report of Investigation Pursuant to Section 21(a): The DAO.” Release №81207. https://www.sec.gov/litigation/investreport/34-81207.pdf
[28] DefiLlama. pump.fun cumulative DEX trading volume and revenue data. https://defillama.com/protocol/pump.fun
[29] DailyCoin. “Airdrops Under Attack: Can Sybil Farmers Be Stopped?” September 30, 2024. https://dailycoin.com/airdrops-under-attack-can-sybil-farmers-be-stopped/
[30] LayerZero Labs / Chaos Labs / Nansen. Sybil identification and exclusion data, May–June 2024.
[31] Cookie3. Cross-project Sybil proportion survey (70% of eligible wallets are multi-wallet operators).
[32] DOJ, various dates. BitConnect-related criminal indictments. SEC Press Release 2021–172, September 1, 2021. https://www.sec.gov/newsroom/press-releases/2021-172
[33] DOJ, February 25, 2022. “BitConnect Founder Indicted in Global $2.4 Billion Cryptocurrency Scheme.” https://www.justice.gov/opa/pr/bitconnect-founder-indicted-global-24-billion-cryptocurrency-scheme
[34] Texas State Securities Board, Cease and Desist Order, January 3, 2018.
[35] Teneo. Three Arrows Capital Liquidation Affidavits, July 7, 2022; The Block / Decrypt / Fortune, July 19, 2022. 3AC bankruptcy liquidation filings.
[36] CoinDesk, November 2, 2022. Alameda Research balance sheet reporting (FTX collapse trigger).
[37] DOJ, July 2023 / December 2024. Alex Mashinsky indictment and guilty plea.
[38] Stretto. Celsius Network Bankruptcy, Case №22–10964, S.D.N.Y. https://cases.stretto.com/celsius/
[39a] Flashbots. MEV-Explore Dashboard & Transparency Reports. https://transparency.flashbots.net
[39b] EigenPhi. MEV transaction classification and statistics, 2025. https://eigenphi.io
[40] Cermak, Larry. ICO investor return statistical analysis, 2019. Originally published at The Block Research; data cited by Bitcoinist (2019–08–09) and multiple other sources.
[41] DOJ / U.S. Attorney’s Office, S.D.N.Y., May 15, 2024. “Two Brothers Arrested for Attacking Ethereum Blockchain.” (Anton & James Peraire-Bueno, wire fraud and money laundering conspiracy, $25M, 12-second MEV-Boost exploit). https://www.justice.gov/usao-sdny/pr/two-brothers-arrested-attacking-ethereum-blockchain