
A normal volume chart shows how much traded in each time period, but volume profile flips the axis to show how much traded at each price. That change reveals which price levels the market cared about most, where it spent time and money, and where it barely paused. These levels often become powerful support and resistance. Here is how volume profile works and what the point of control and value area tell you.
Volume by price, not time
Standard volume bars sit along the time axis, showing volume per candle. Volume profile instead maps volume along the price axis, drawing a horizontal histogram that shows how much total volume traded at each price level over a chosen range. Long bars mark prices where a lot of trading happened; short bars mark prices that were passed through quickly. This reframes the chart around where value changed hands, not just when, revealing the market's most important price zones.
The point of control
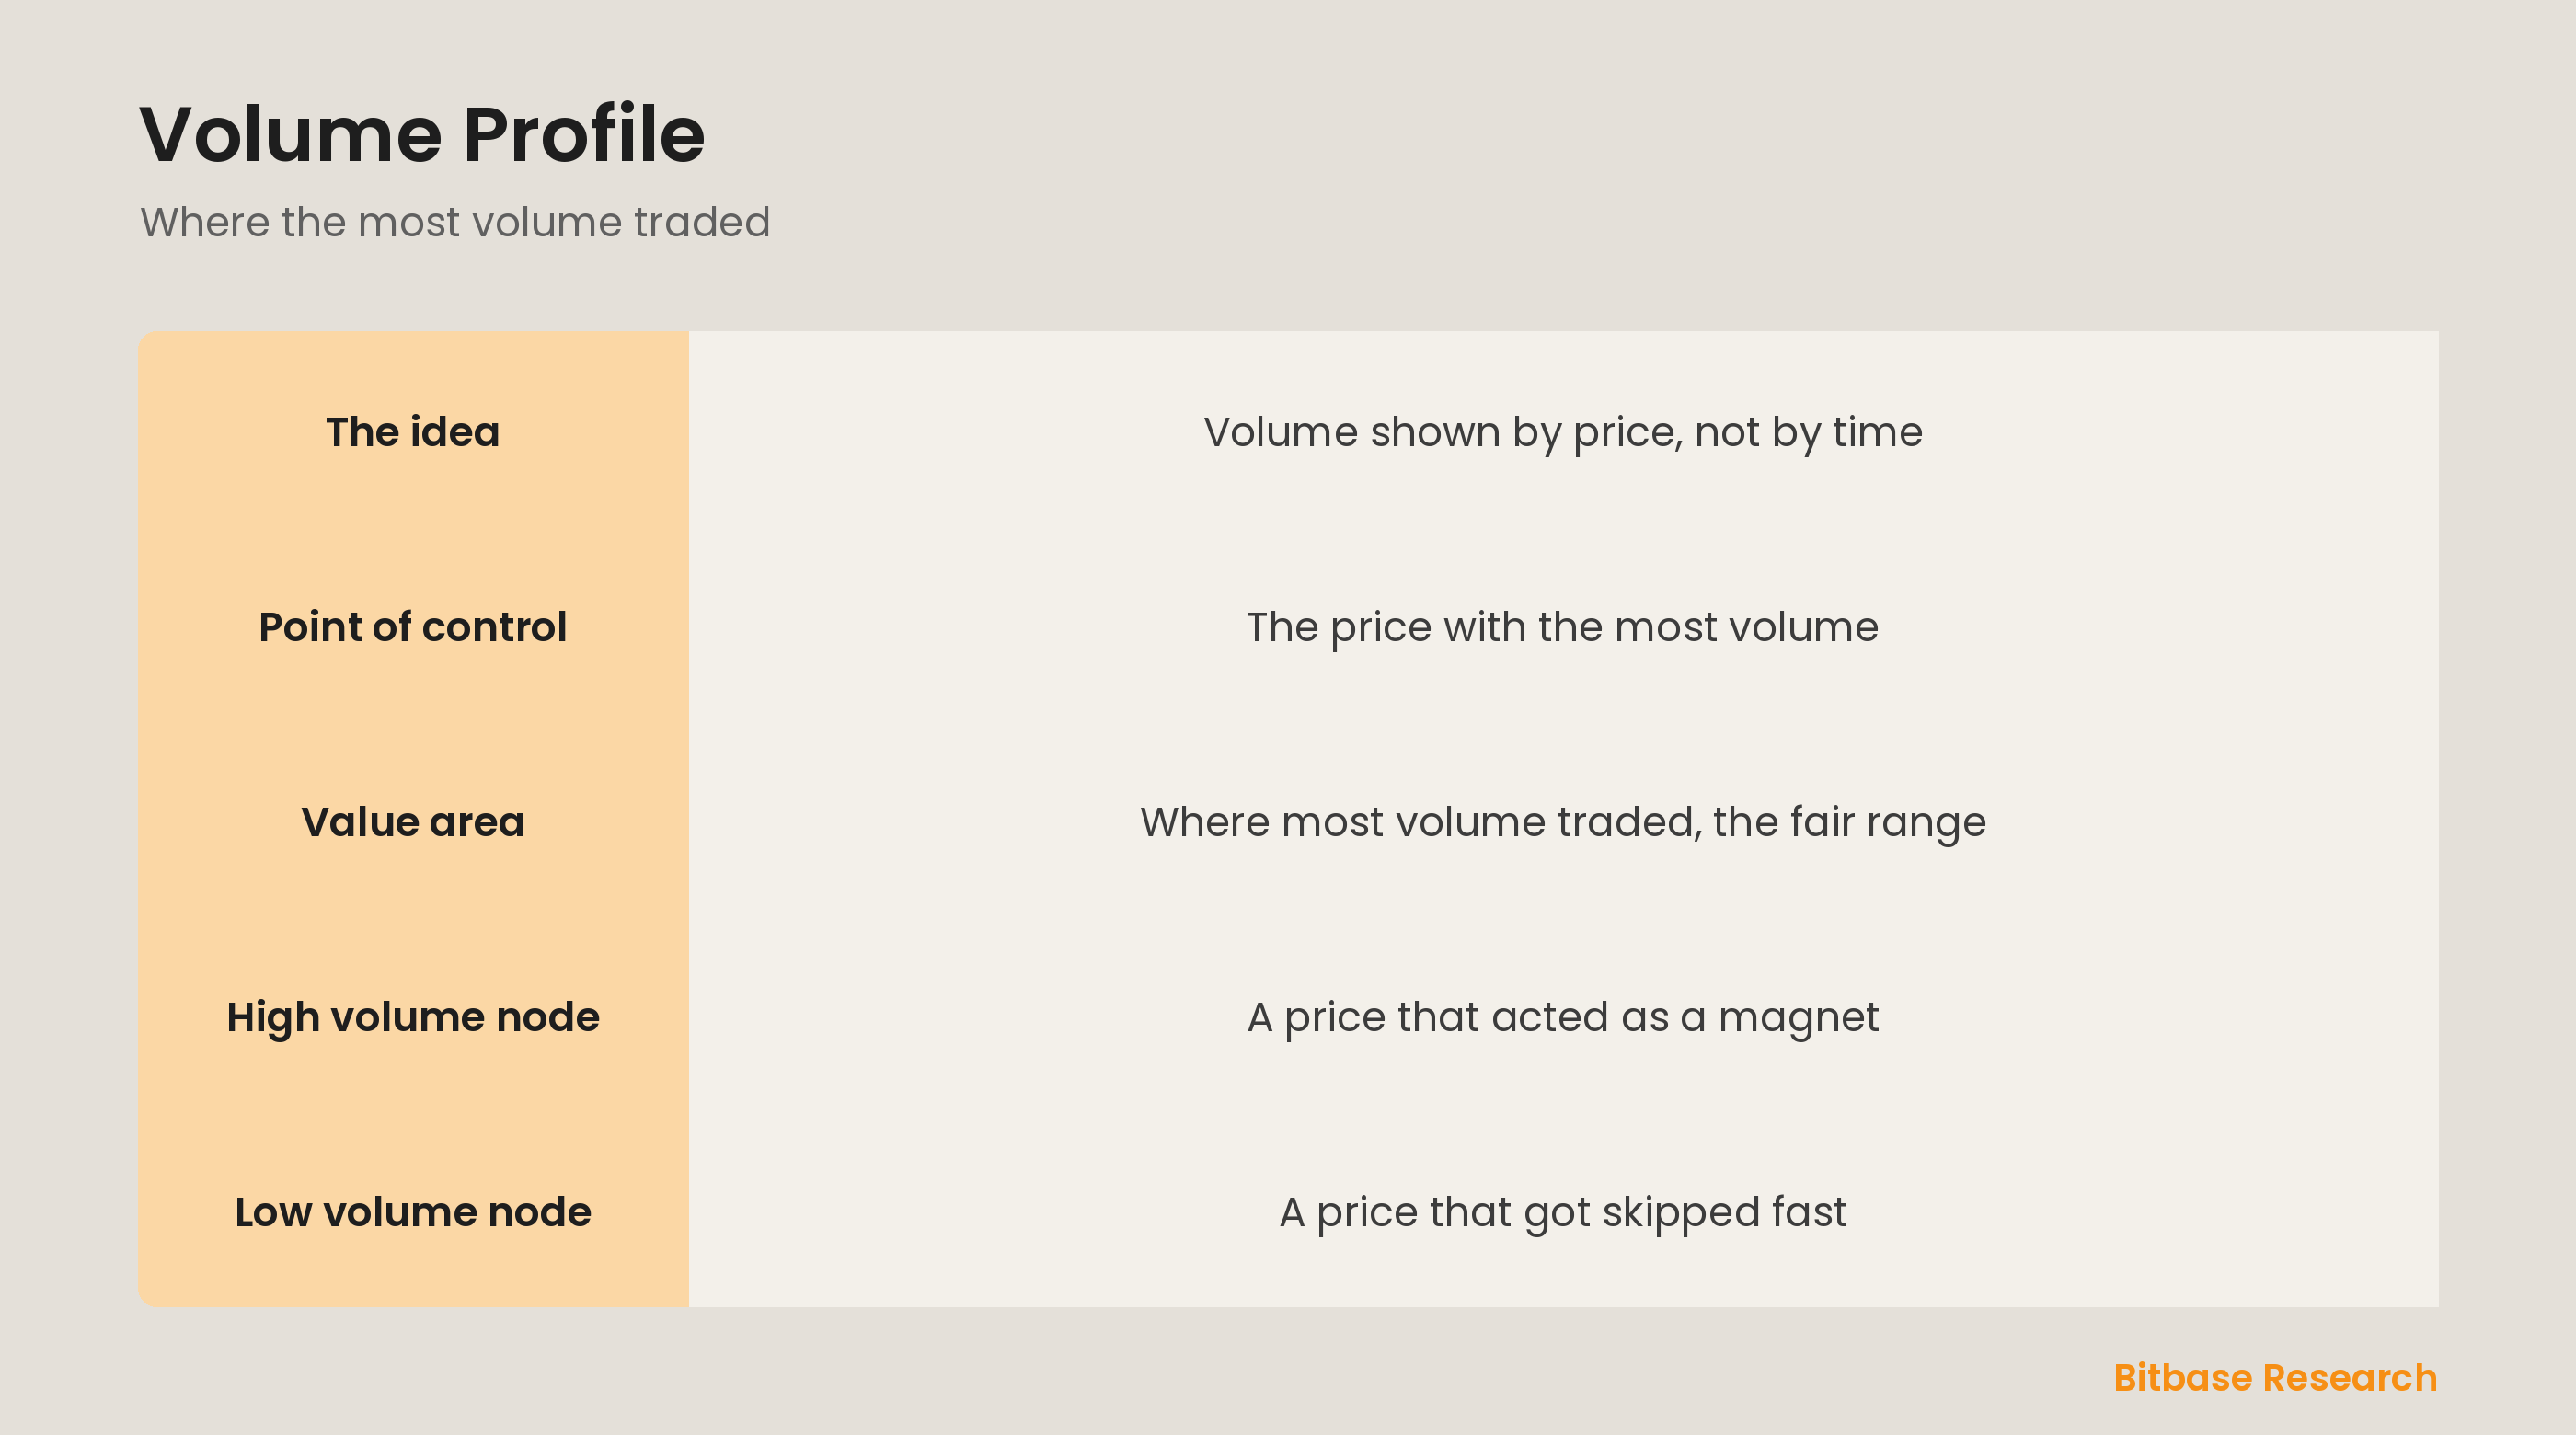
The single most important level on a volume profile is the point of control, the price with the highest traded volume in the range. It is where the most business got done, the level the market agreed on most, so it often acts as a magnet and a strong support or resistance. Price frequently gravitates back toward the point of control, making it a key reference for where the market considers fair value to sit.
The value area
Around the point of control is the value area, the range of prices where the bulk of volume, commonly about 70 percent, actually traded. The value area represents where the market spent most of its time and agreed on value, so its upper and lower edges act as boundaries. Price trading inside the value area is in balance; price breaking out of it signals the market is trying to establish value at a new level, which traders watch closely.
High and low volume nodes
Volume profile also reveals nodes. A high volume node is a price where a lot traded, a level of strong agreement that tends to attract and hold price, acting as support or resistance. A low volume node is a price the market skipped through quickly, with little trading, so it offers little resistance and price often moves fast through it. Reading these nodes tells you where price is likely to stick and where it may accelerate.
The bottom line
Volume profile maps volume by price instead of time, showing which levels the market traded most heavily. The point of control is the single highest-volume price, often a magnet and strong support or resistance, and the value area is the range where most volume traded, marking where the market agreed on value. High volume nodes tend to hold price while low volume nodes let it move fast, making volume profile a map of where price is likely to react. To keep learning the fundamentals, follow more from Bitbase Academy.
Disclaimer: This article is educational content from Bitbase Academy, provided for information only. It does not constitute investment, trading, tax, or financial advice. Crypto assets are volatile; assess your own risk. Written as of June 2026; refer to the latest official information.
References
[1] Investopedia, "Volume: Definition in Trading and How To Use It" investopedia.com
[2] Investopedia, "Liquidity: Definition, Example, and How It Works" investopedia.com
[3] Investopedia, "Technical Analysis: What It Is and How to Use It" investopedia.com