
A trend is easier to see and trade once you draw it, and that is exactly what trend lines and channels do. A single straight line can turn a messy series of candles into a clear direction, showing you where price has been respecting a boundary. Add a second parallel line and you have a channel that frames the whole move. Here is how to draw trend lines and channels, and what it means when price breaks one.
Drawing an uptrend line
An uptrend is a series of higher lows, and you draw an uptrend line by connecting those rising lows with a straight line that slopes upward. Each time price pulls back and bounces near that line, it confirms the trend and the line's validity. The line acts like a moving floor beneath the advance. As long as price keeps making higher lows above it, the uptrend is intact, and the line gives you a clear reference for where that would change.
Drawing a downtrend line
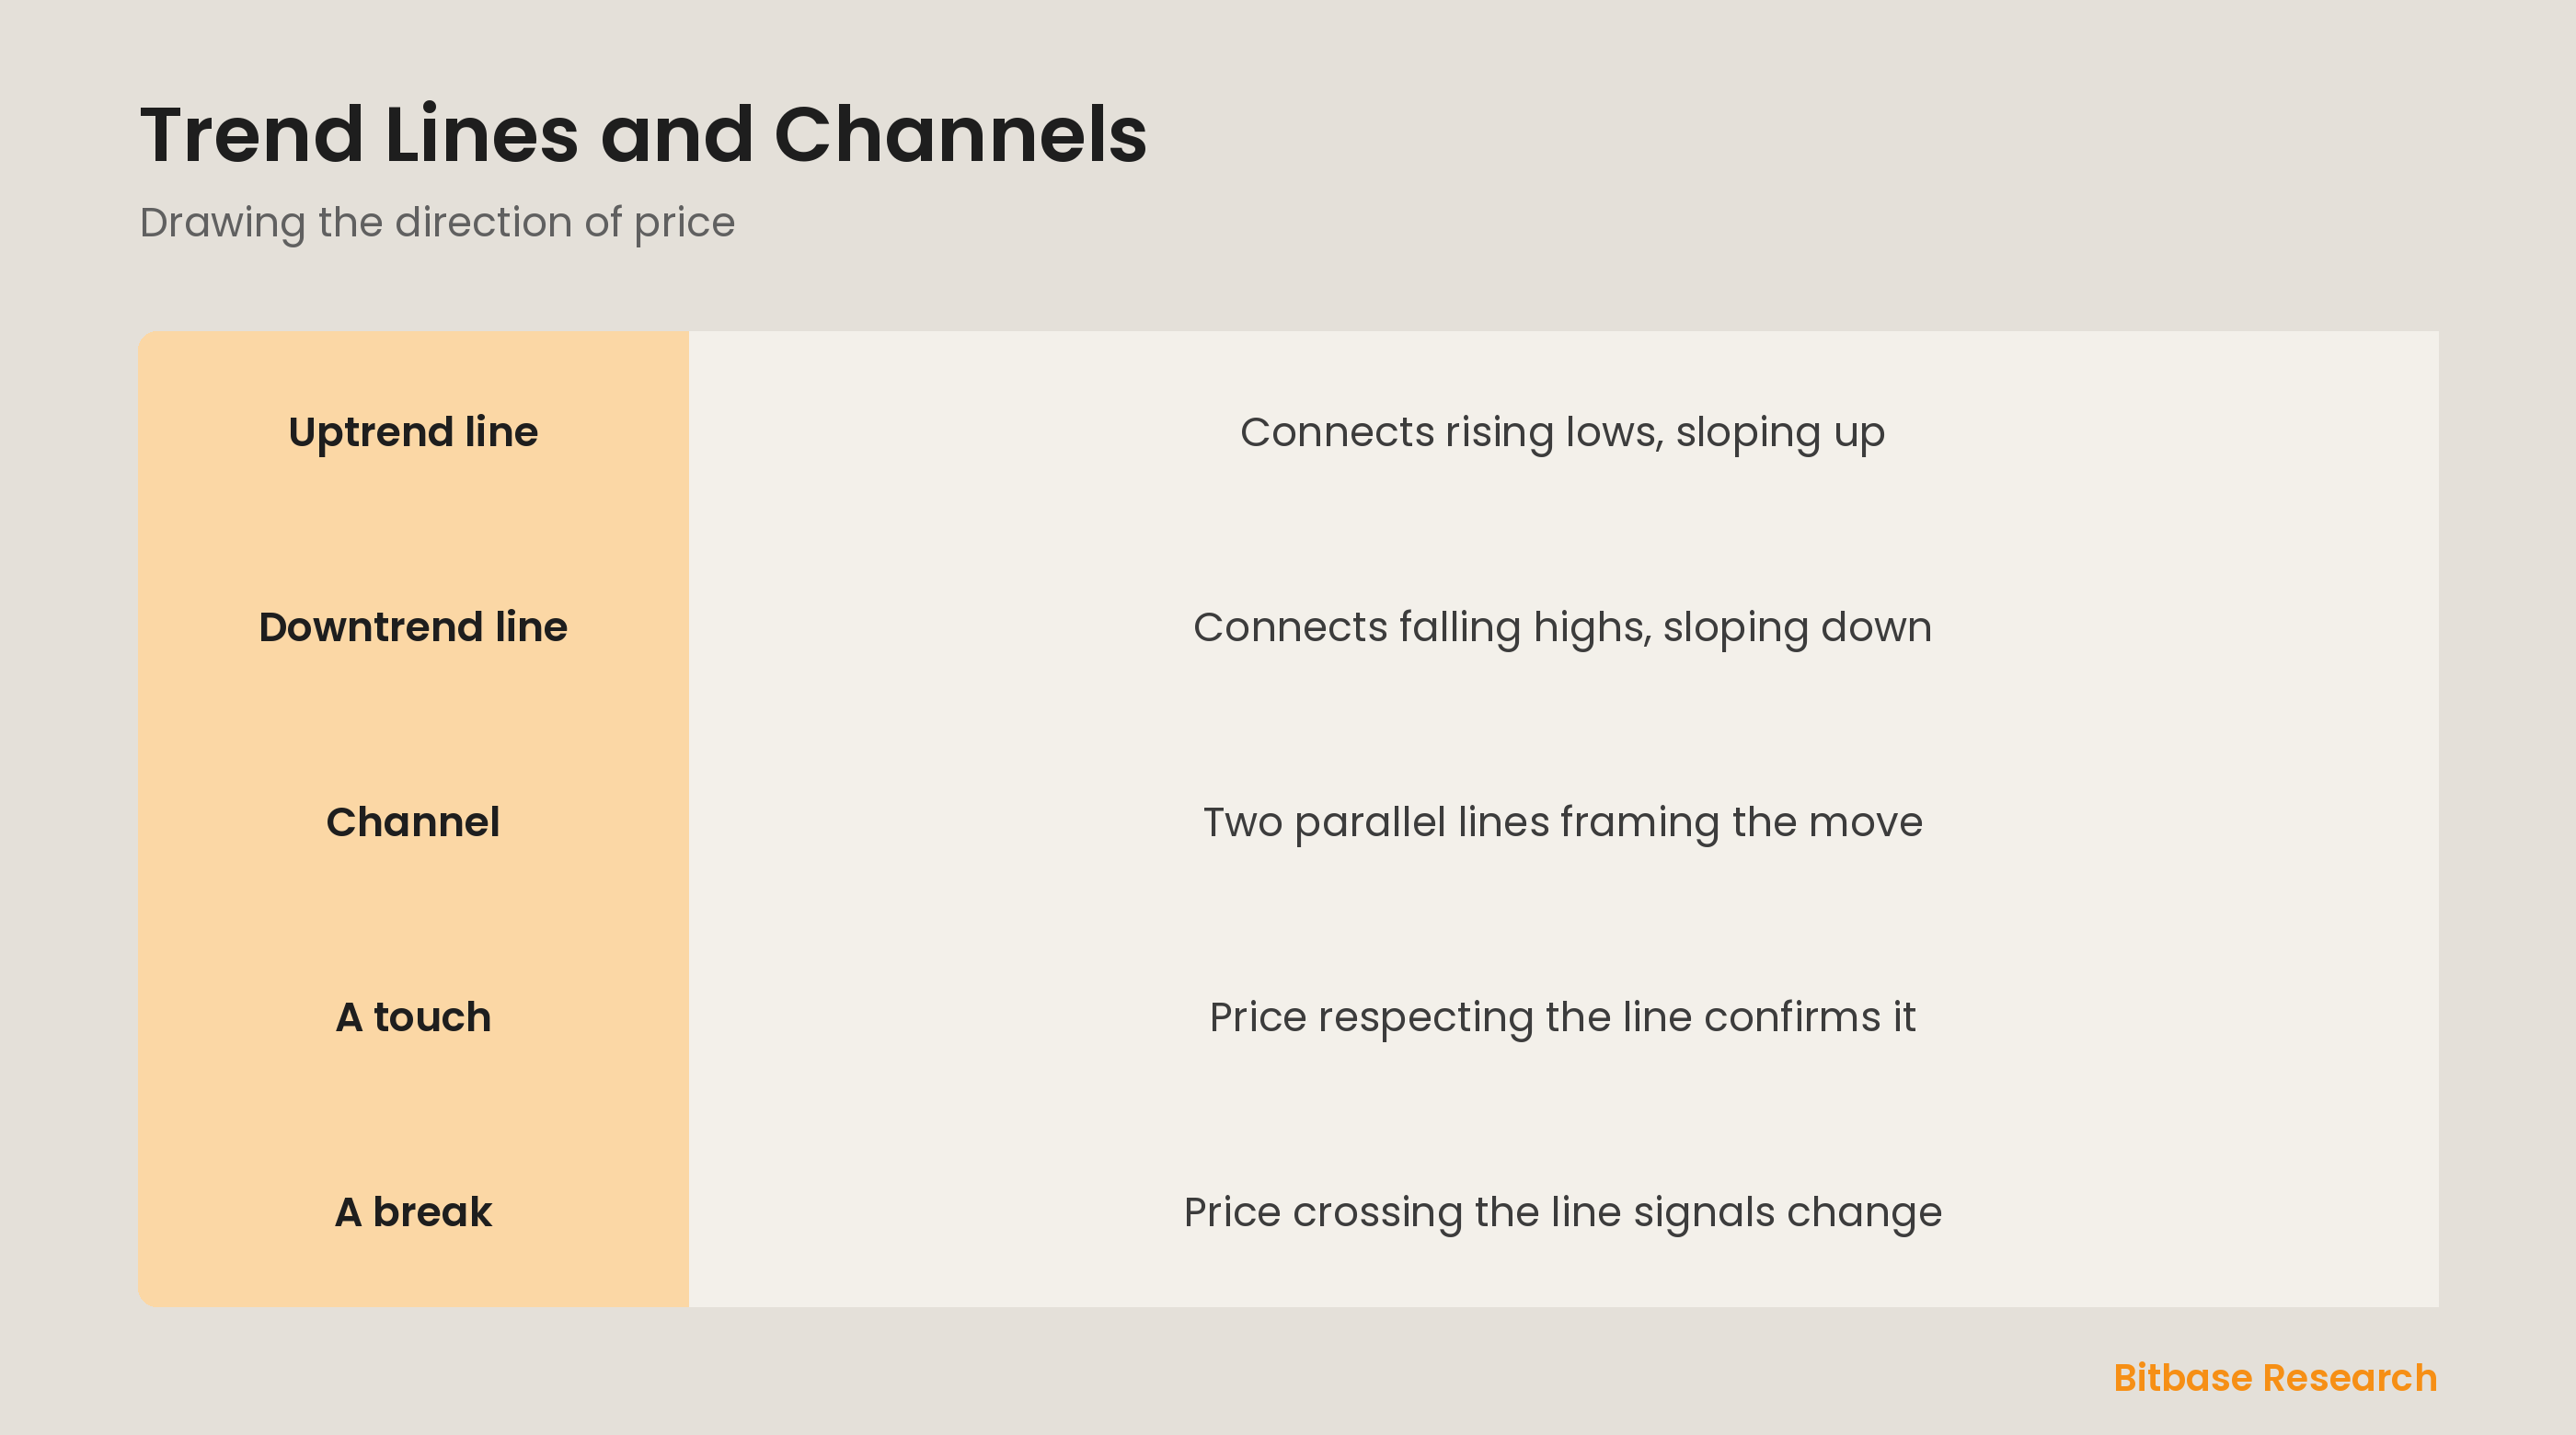
A downtrend is the opposite, a series of lower highs, and you draw a downtrend line by connecting those falling highs with a line sloping downward. Each rally that stalls near the line confirms the downtrend. The line acts as a moving ceiling above the decline, capping each bounce. As long as price keeps making lower highs beneath it, the downtrend holds. Drawing both kinds of lines forces you to define the trend precisely rather than guess at it.
What a channel is
A channel appears when price moves between two roughly parallel trend lines, one along the lows and one along the highs. In an uptrend channel, price rises while bouncing between a lower support line and an upper resistance line; a downtrend channel slopes down the same way. The channel frames the whole move, showing you the range price is traveling within. Traders use the channel edges as reference points for where a move might pause within the larger trend.
When a trend line breaks
A trend line matters most when price finally crosses it. When an uptrend line breaks, price has failed to hold its rising floor, a warning the uptrend may be weakening or reversing. When a downtrend line breaks, price has pushed above its falling ceiling, hinting the downtrend may be ending. A break does not guarantee a reversal, but it is a clear signal that the trend you drew is no longer behaving as it was, and worth your attention.
The bottom line
A trend line turns a trend into something you can see and act on: connect rising lows for an uptrend line, falling highs for a downtrend line. Two parallel lines make a channel that frames the whole move between a floor and a ceiling. As long as price respects the line, the trend is intact; when price breaks it, that is a signal the trend may be changing. Drawing them forces clarity about which way a market is really going. To keep learning the fundamentals, follow more from Bitbase Academy.
Disclaimer: This article is educational content from Bitbase Academy, provided for information only. It does not constitute investment, trading, tax, or financial advice. Crypto assets are volatile; assess your own risk. Written as of June 2026; refer to the latest official information.
References
[1] Investopedia, "Trend: Definition, Types, Examples, and Uses in Trading" investopedia.com
[2] Investopedia, "Trendline: What It Is, How To Use It in Investing" investopedia.com
[3] Investopedia, "Channel: Definition, What It Indicates, and How To Trade" investopedia.com