
Prices do not move in a straight line; they tend to pause, bounce, and stall at certain levels again and again. Those levels are support and resistance, two of the most useful ideas in reading a chart. They mark the prices where buyers and sellers have historically drawn a line, and knowing where they are helps you anticipate where a move might slow or reverse. Here is what they are and how to use them.
What support is
Support is a price level where a falling market has tended to stop and bounce, as if resting on a floor. It forms because at that price enough buyers step in, seeing value, to absorb the selling and halt the decline. Each time price dips to that level and rises again, the level gains credibility as support. Traders watch support because it is a spot where a downtrend may pause or reverse, offering a potential place to buy.
What resistance is
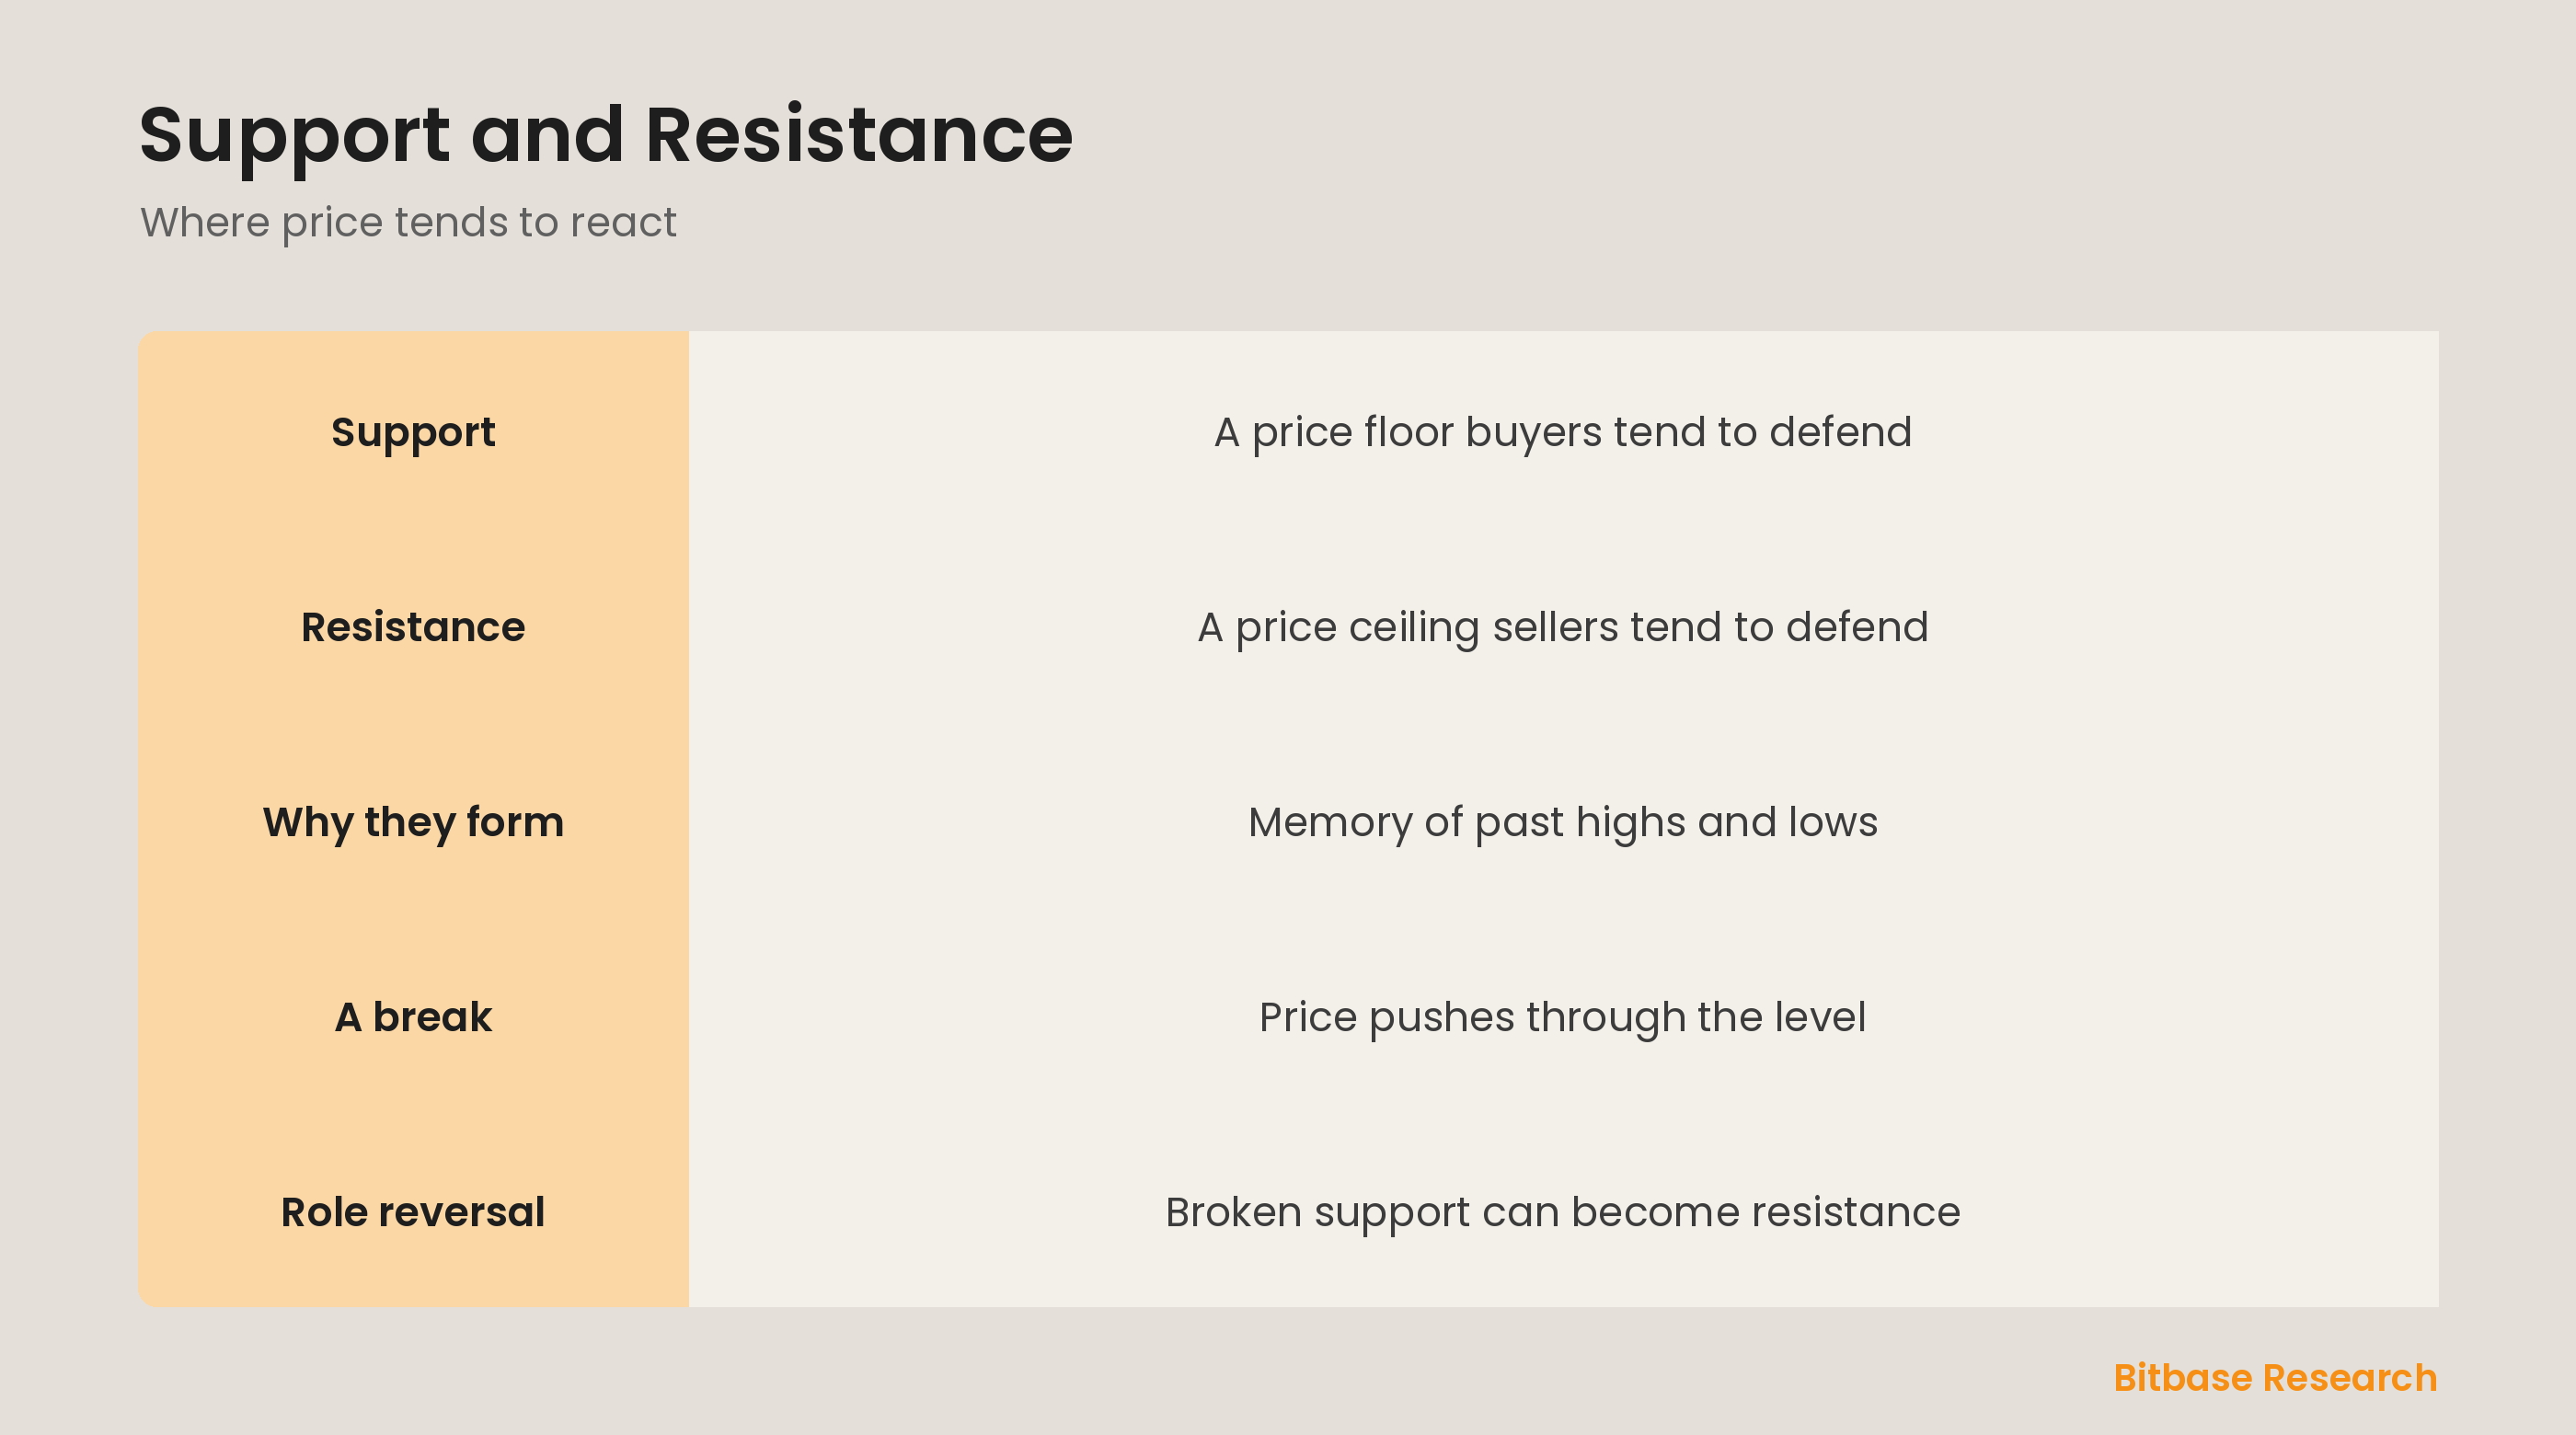
Resistance is the mirror image: a price level where a rising market has tended to stall and turn down, as if hitting a ceiling. It forms because at that price enough sellers appear, taking profits or judging the price too high, to overwhelm the buying and cap the advance. Each rejection at that level strengthens it as resistance. Traders watch it because an uptrend may stall there, marking a spot where a rally could run out of steam.
Why these levels form
Support and resistance exist because markets have memory. A price that mattered before, a prior high, a prior low, a round number, tends to matter again, because traders remember it and act around it. Buyers who missed a bounce wait to buy at the same support; sellers who wished they had sold at a high place orders at the same resistance. This collective memory is self-reinforcing, which is why levels that held once often hold again.
Breaks and role reversal
Levels do not hold forever. When price pushes decisively through support or resistance, it is a break, often signaling that the balance of buyers and sellers has shifted. What follows is one of the most useful patterns in charting: role reversal. Broken support frequently becomes new resistance, and broken resistance becomes new support, as the level that once stopped price now acts from the other side. Watching how price behaves after a break tells you a lot.
The bottom line
Support is a price floor where buyers have tended to halt a decline, and resistance is a ceiling where sellers have tended to cap a rally. They form because markets remember past highs, lows, and key prices, and traders act around them again. When price breaks through a level, it often flips role, with broken support becoming resistance and vice versa. Reading these levels helps you anticipate where a move may pause, reverse, or accelerate. To keep learning the fundamentals, follow more from Bitbase Academy.
Disclaimer: This article is educational content from Bitbase Academy, provided for information only. It does not constitute investment, trading, tax, or financial advice. Crypto assets are volatile; assess your own risk. Written as of June 2026; refer to the latest official information.
References
[1] Investopedia, "Support (Support Level): Definition, How It Works, and Trading Strategies" investopedia.com
[2] Investopedia, "Resistance (Resistance Level): Definition, Uses in Trading" investopedia.com
[3] Investopedia, "Technical Analysis: What It Is and How to Use It" investopedia.com