
The parabolic SAR is one of the more visual indicators: a series of little dots that trail along above or below price, flipping sides as the trend changes. Its name stands for stop and reverse, hinting at its two jobs, showing the trend direction and marking a moving exit point. It is elegant in a trend and frustrating in a range. Here is how the parabolic SAR works and when to trust it.
What the dots show
The parabolic SAR plots a dot near each candle, and the dot's position relative to price tells you the trend direction. When the dots sit below the candles, the trend is up and price is rising above them. When the dots sit above the candles, the trend is down and price is falling below them. So at a glance, the side the dots are on tells you which way the market is trending, without any numbers to interpret.
How the dots trail and accelerate
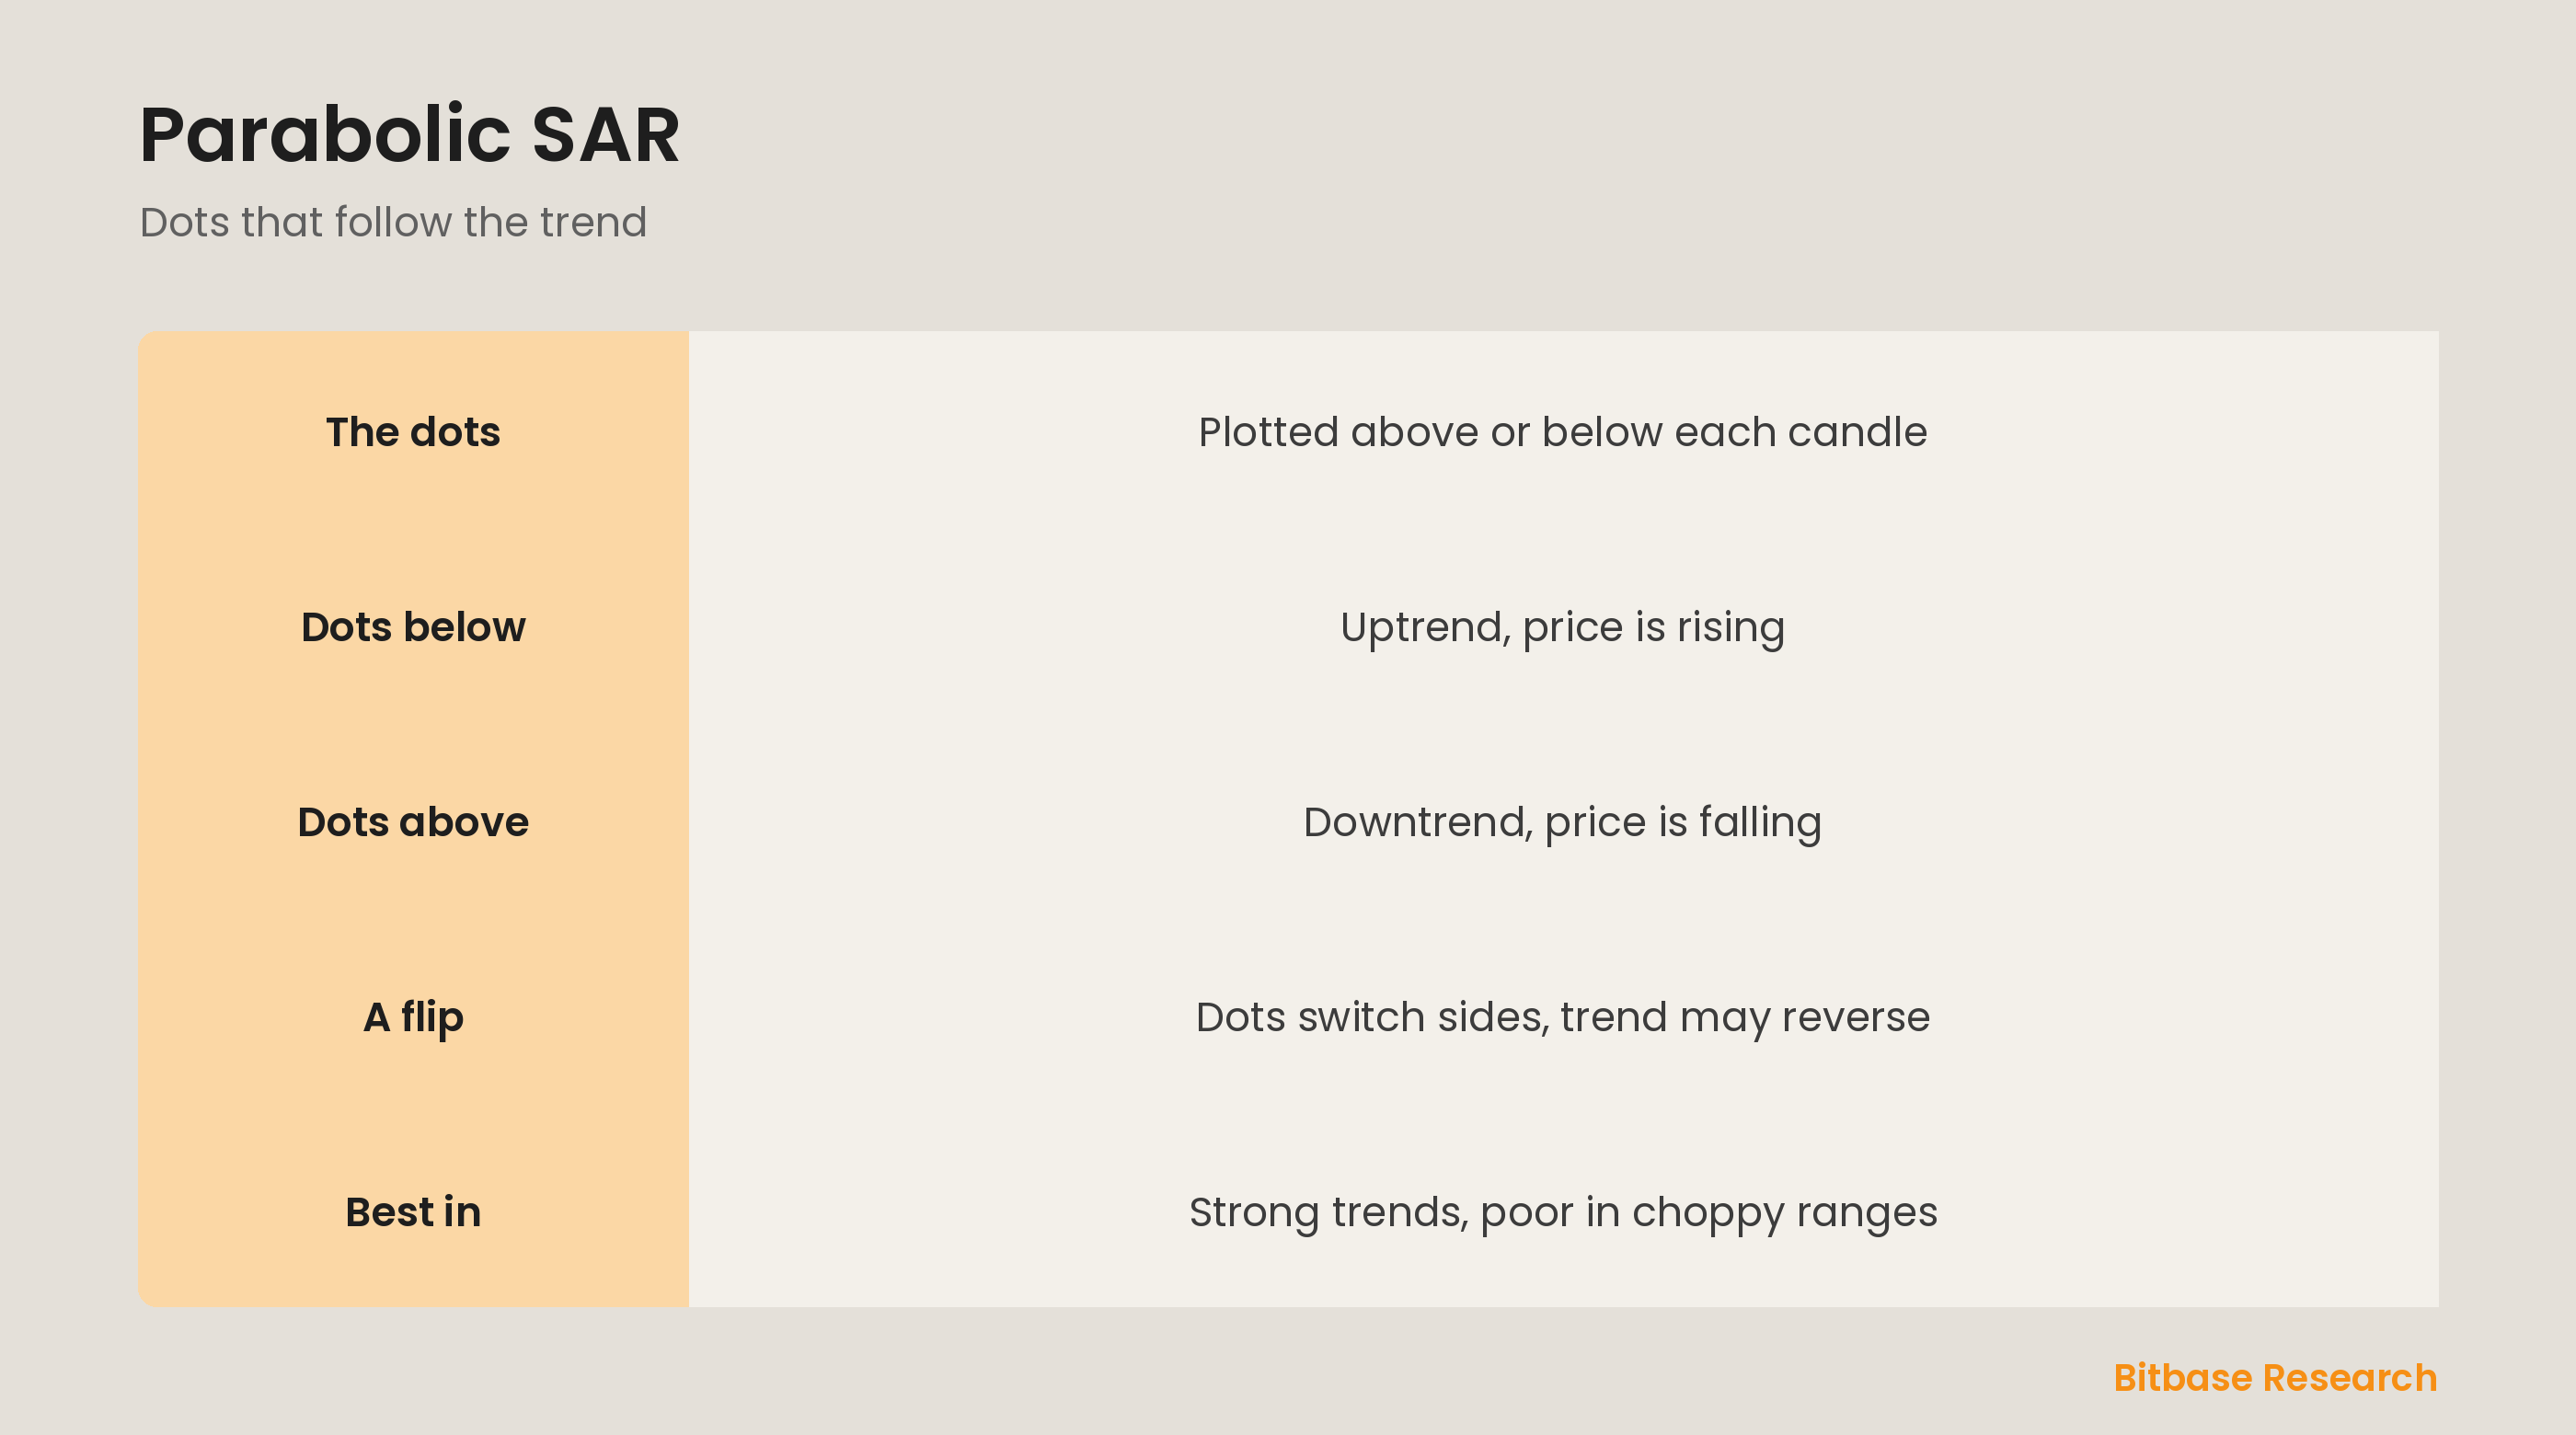
The dots do not sit still; they trail behind price and gradually accelerate toward it as a trend extends. In an uptrend, each dot steps a little higher, following price up and tightening the gap over time. This trailing behavior means the SAR acts like a moving stop that ratchets in the direction of the trend, locking in more of a move as it continues. The longer and stronger the trend, the faster the dots catch up.
The flip signal
The key event is when the dots flip from one side of price to the other. When price falls through the rising dots in an uptrend, the dots jump above price, signaling the uptrend may be over and a downtrend beginning. When price rises through the falling dots in a downtrend, the dots flip below, signaling a possible upturn. Because the SAR is designed to stop and reverse, this flip is both an exit for the old trend and a potential entry for the new one.
Where it works and fails
The parabolic SAR shines in strong, sustained trends, where it trails price smoothly and keeps you in the move while trailing a sensible stop. Its weakness is a sideways, choppy market: when price has no real trend, the dots flip back and forth constantly, generating a stream of false signals and whipsaw losses. This is why many traders pair the SAR with a trend-strength filter like the ADX, using it only when a real trend is present.
The bottom line
The parabolic SAR plots dots that trail price, sitting below it in an uptrend and above it in a downtrend, so their side shows the trend direction. The dots accelerate toward price as a trend extends, acting like a moving stop, and when they flip to the other side they signal a possible reversal and exit. The SAR works beautifully in strong trends but whipsaws in ranges, so it is best used when a genuine trend is confirmed. To keep learning the fundamentals, follow more from Bitbase Academy.
Disclaimer: This article is educational content from Bitbase Academy, provided for information only. It does not constitute investment, trading, tax, or financial advice. Crypto assets are volatile; assess your own risk. Written as of June 2026; refer to the latest official information.
References
[1] Investopedia, "Parabolic SAR Indicator: Definition, Formula, Trading Strategies" investopedia.com
[2] Investopedia, "Trend: Definition, Types, Examples, and Uses in Trading" investopedia.com
[3] Investopedia, "Technical Analysis: What It Is and How to Use It" investopedia.com