
Because every coin's last movement is recorded, a blockchain quietly knows something no stock market does: roughly what price each holder paid. From this, analysts build metrics that estimate whether the market as a whole is sitting in profit or loss — and history shows those extremes often cluster near tops and bottoms. Here are the key supply and profit metrics and how to read them.
Cost basis and realized value
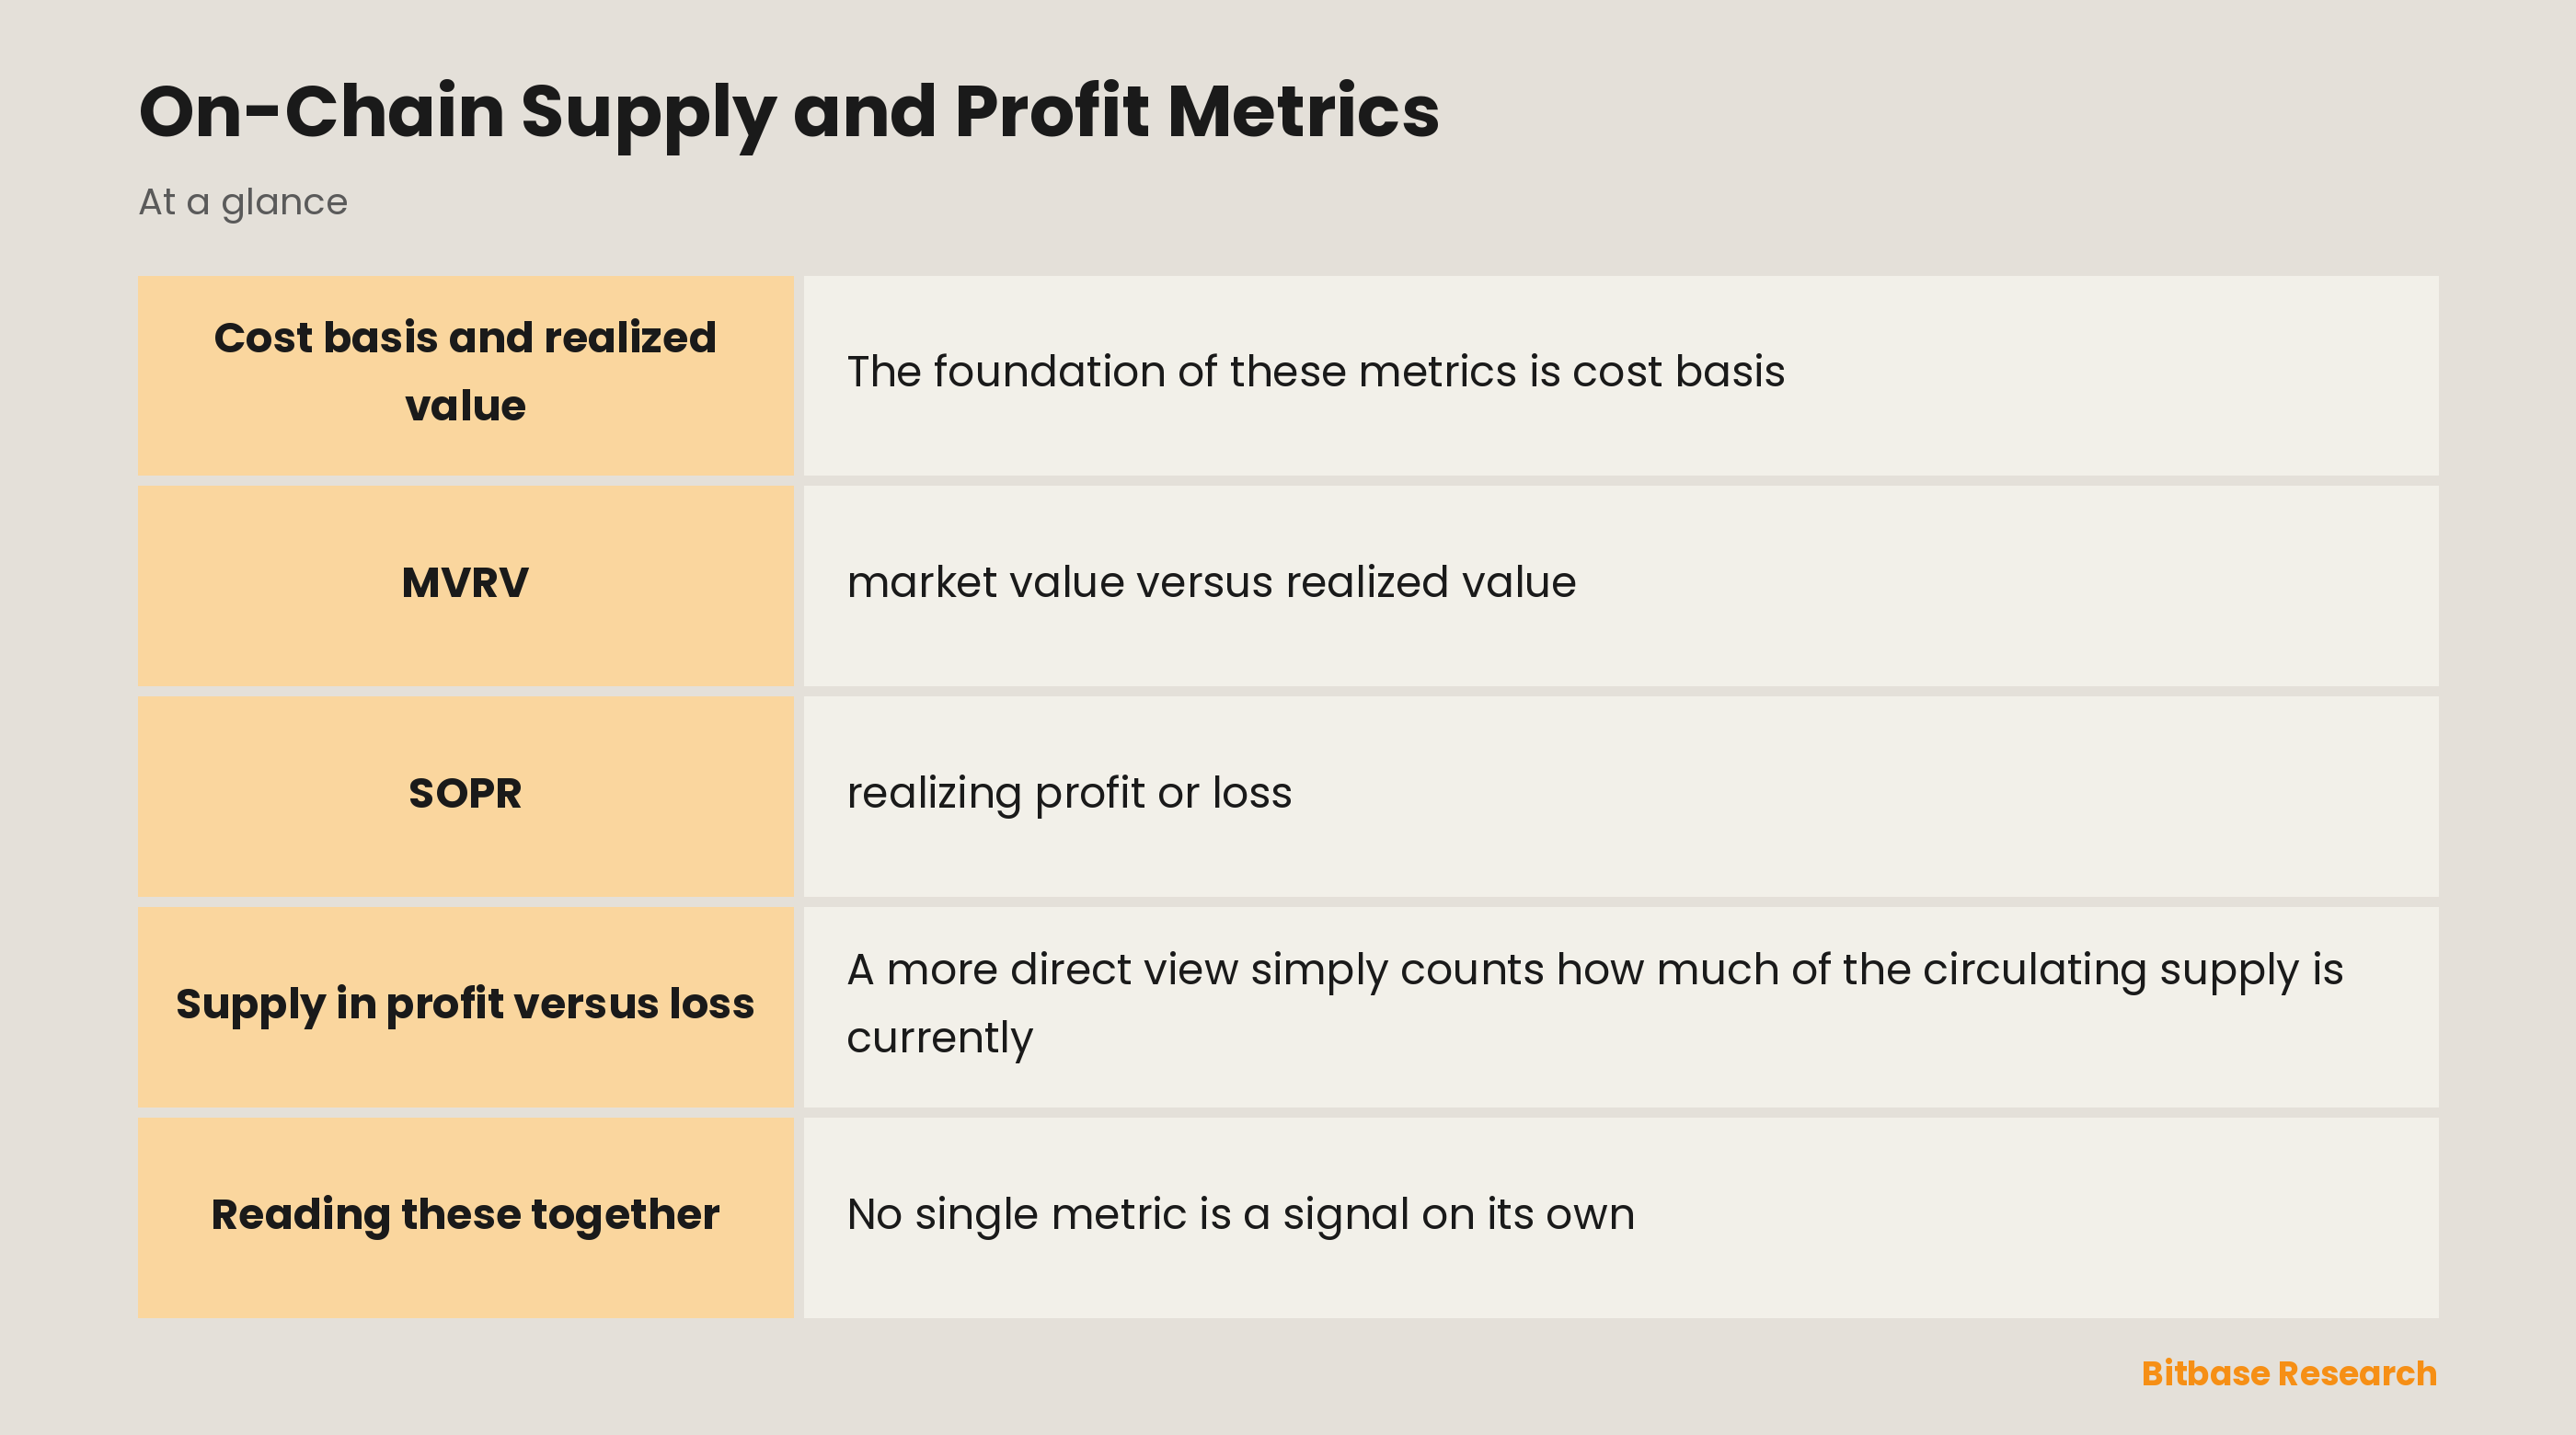
The foundation of these metrics is cost basis: the price at which a coin last changed hands, used as an approximation of what its owner paid. Summed across all coins, this gives realized capitalisation — the aggregate cost basis of the entire supply, as opposed to market cap, which values every coin at today's price. Realized cap tends to move slowly and acts like the market's memory of what was actually paid, providing a grounded baseline against which the frothy market price can be compared.
MVRV: market value versus realized value
The market-value-to-realized-value ratio, or MVRV, simply divides market cap by realized cap. When it is above one, the average holder is sitting in unrealised profit; below one, the average holder is underwater. Historically, very high MVRV readings have flagged periods of extreme, often unsustainable profit near cycle tops, while readings below one have marked capitulation zones near bottoms. It is a temperature gauge for aggregate profitability, not a precise timing tool.
SOPR: realizing profit or loss
Where MVRV measures unrealised profit, the spent output profit ratio, or SOPR, measures realised profit as coins actually move. It compares the price at which coins are being spent to the price they were last acquired. A SOPR above one means the coins moving are, on average, being sold at a profit; below one, at a loss. In uptrends, SOPR dipping to one and bouncing often marks support as holders refuse to sell below cost; in downtrends, it struggling to reclaim one signals persistent loss-taking.
Supply in profit versus loss
A more direct view simply counts how much of the circulating supply is currently worth more than its cost basis. When nearly all supply is in profit, the temptation to sell is high and the market is often euphoric and vulnerable; when a large share is in loss, sellers are exhausted and the market is often fearful and closer to a floor. Splitting this by long-term and short-term holders sharpens it, since patient holders and recent buyers behave very differently under stress.
Reading these together
No single metric is a signal on its own; their power is in agreement. A top is more convincing when high MVRV, elevated SOPR, and nearly all supply in profit appear together, alongside coins flowing to exchanges. A bottom is more convincing when the mirror image lines up. These metrics are probabilistic and can stay stretched for a long time, so they belong in a weight-of-evidence approach, cross-checked with price, flows, and market context rather than trusted alone.
The bottom line
On-chain supply and profit metrics turn the ledger's memory of cost basis into a read on market psychology: realized cap anchors what was paid, MVRV and SOPR gauge unrealised and realised profit, and supply-in-profit shows how tempted holders are to sell. Used together and with humility, they are among the most distinctive tools crypto offers — but they describe conditions and probabilities, never certainties, and are no substitute for sound risk management.
Disclaimer: This article is educational content from Bitbase Academy, provided for informational purposes only. It is not investment, trading, tax, or financial advice. Written as of July 2026; rely on the latest official information.
References
[1] Messari, "Realized cap and on-chain valuation" messari.io
[2] The Block, "MVRV and SOPR explained" theblock.co