Traditional markets hide their plumbing, but a blockchain records almost everything in public: every transaction, every wallet, every coin's movement. On-chain analysis is the craft of reading that raw ledger to understand what participants are actually doing, not just what prices say. Here is how it works and what it can and cannot tell you.
What on-chain analysis is
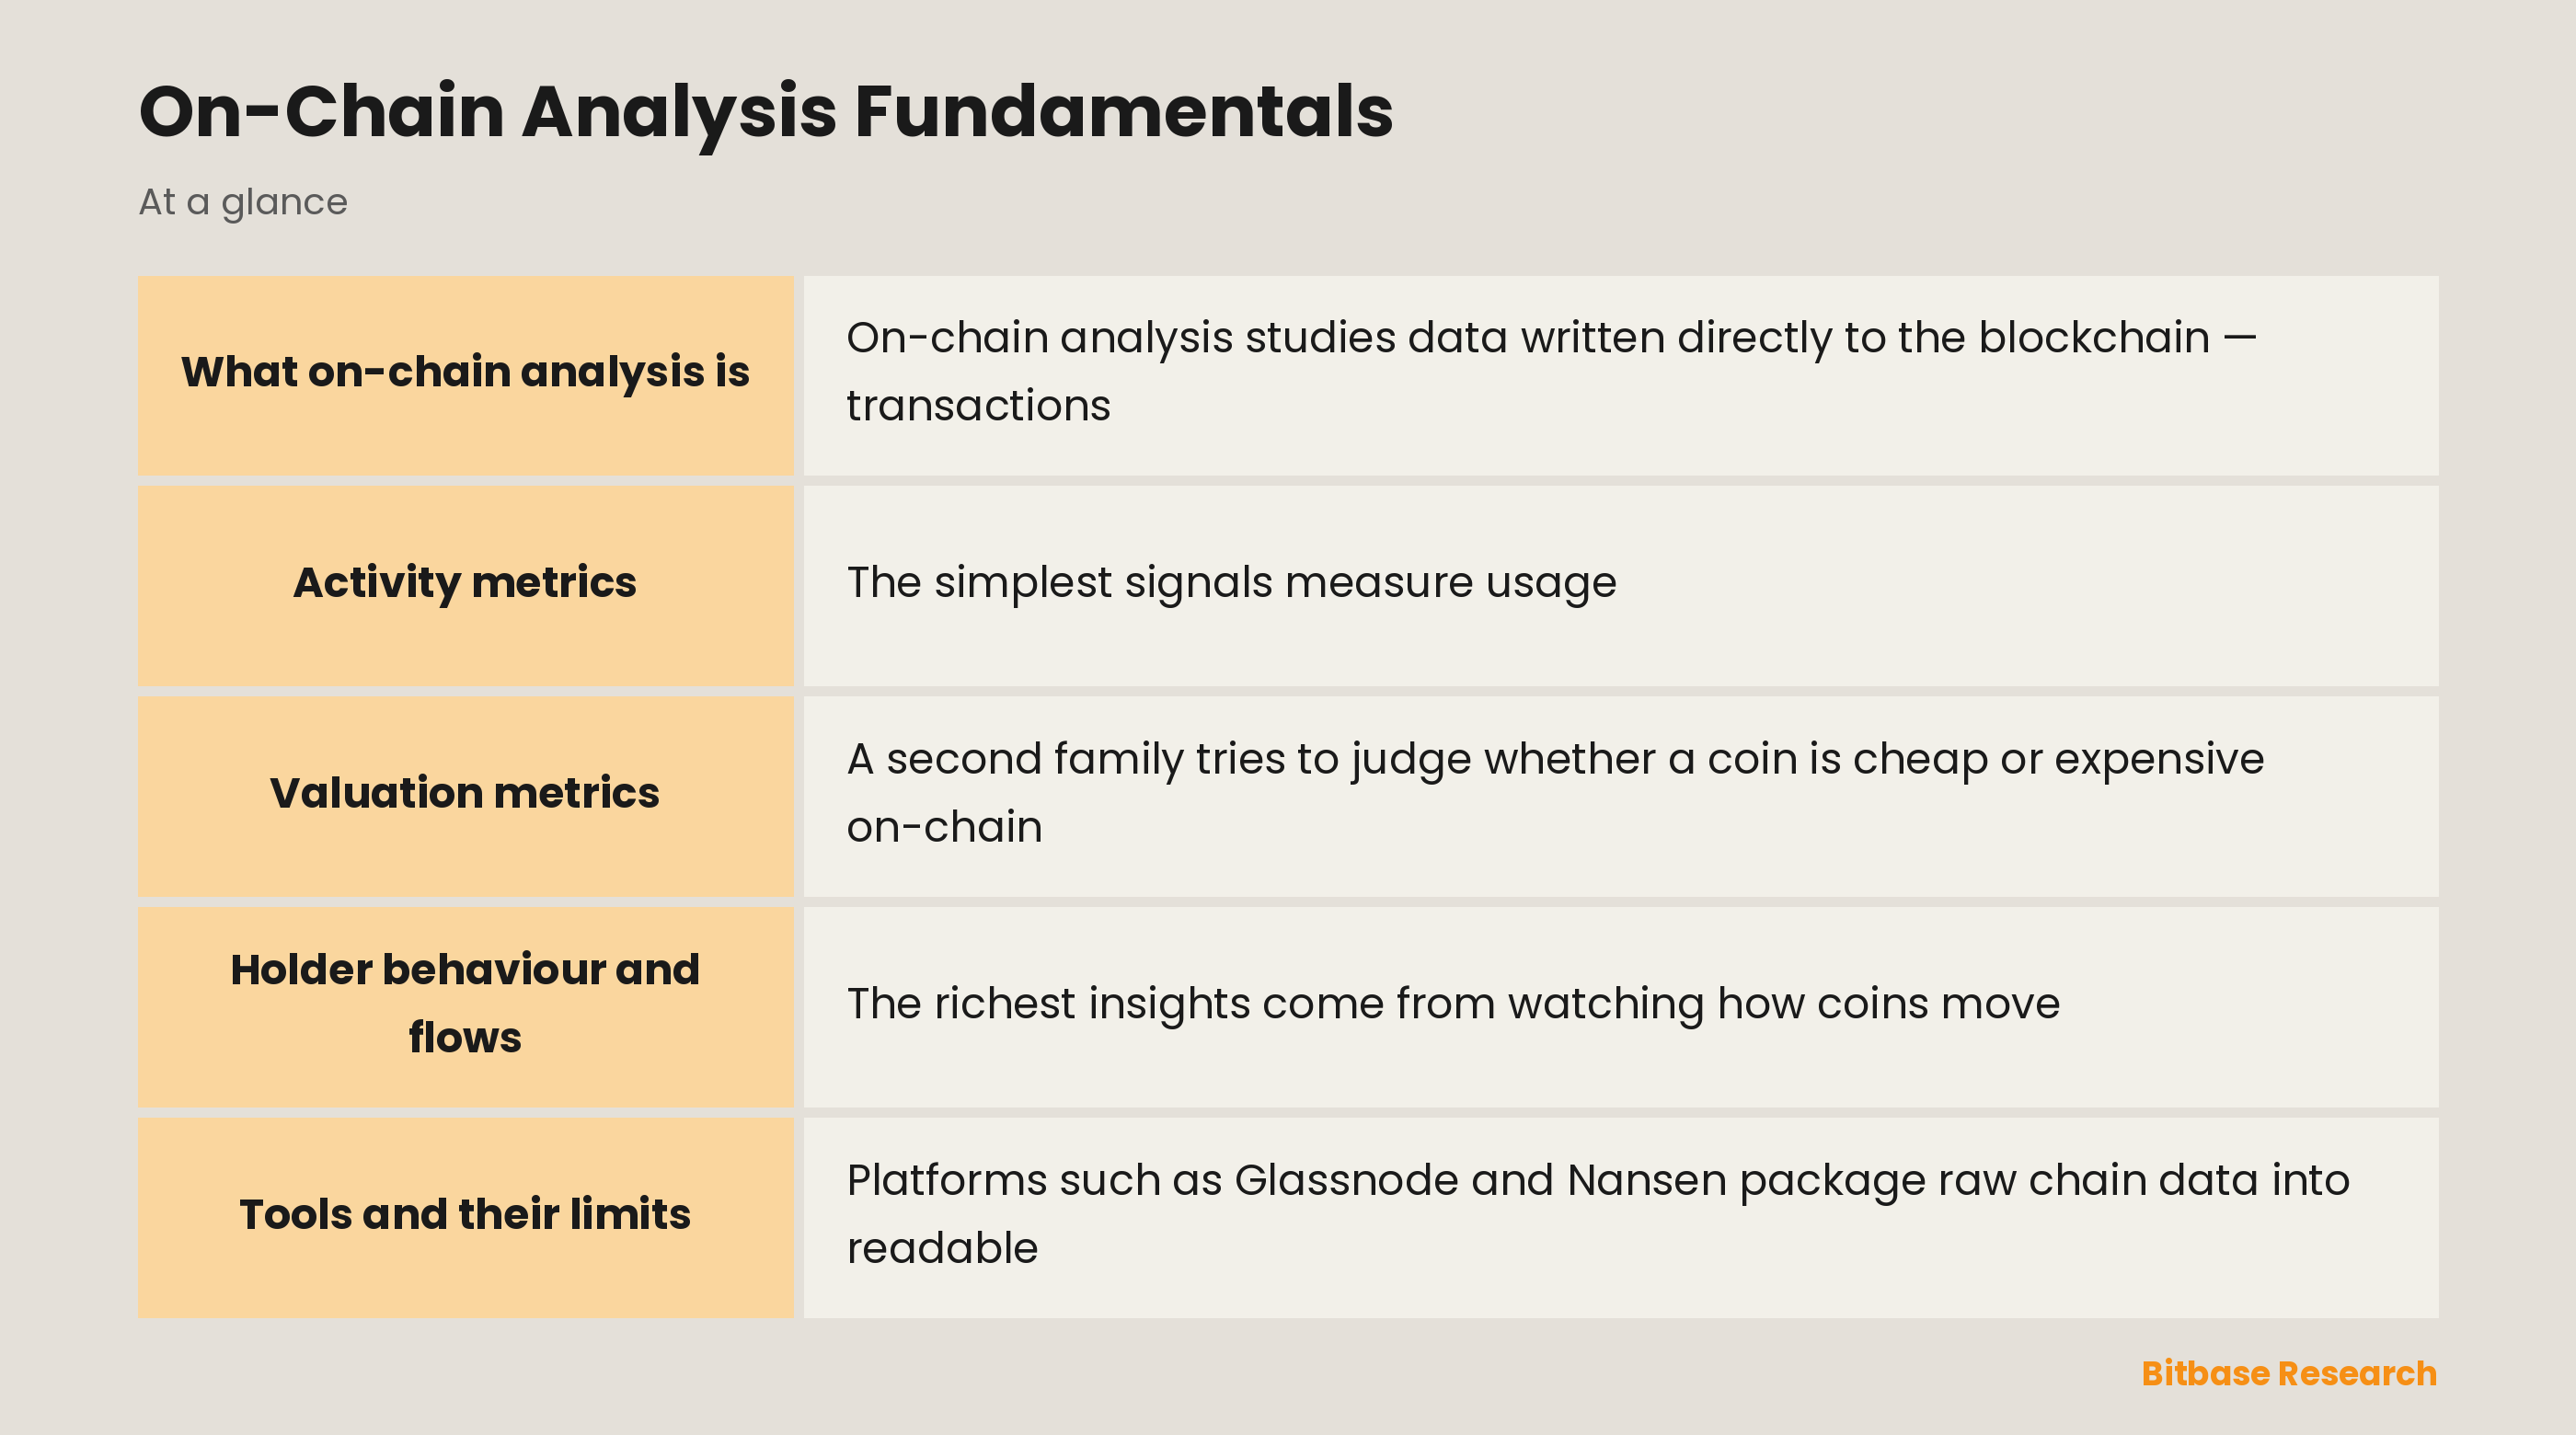
On-chain analysis studies data written directly to the blockchain — transactions, addresses, balances, and flows — to infer the behaviour and health of a network. Because the ledger is public and permanent, anyone can measure how many people are transacting, how coins are being held or moved, and where value is concentrating. Unlike price, which reflects opinion, on-chain data reflects action. It is not a crystal ball, but it is one of the few windows into what holders are really doing beneath the noise.
Activity metrics
The simplest signals measure usage. Active addresses count how many unique wallets transact in a period, a rough proxy for adoption and engagement. Transaction count and transfer volume show how much the network is being used, while fees paid reveal how much people will pay for blockspace, a sign of genuine demand. Rising activity alongside rising price suggests real participation; a price rally on fading activity is a warning that enthusiasm may be thinning.
Valuation metrics
A second family tries to judge whether a coin is cheap or expensive on-chain. Realized capitalisation values each coin at the price it last moved, approximating the aggregate cost basis of the market rather than its speculative market cap. Ratios built from this, such as market-value-to-realized-value, or network-value-to-transactions, attempt to flag when price has stretched far from underlying usage or cost basis. They are blunt instruments, but they add a fundamentals-flavoured lens to a market that often runs on sentiment.
Holder behaviour and flows
The richest insights come from watching how coins move. Exchange flows track coins entering exchanges, often a prelude to selling, versus leaving for self-custody, typically a sign of accumulation. Cohort analysis splits holders into long-term and short-term groups, revealing whether patient hands or recent speculators are driving activity. Tools like HODL waves show how much supply has stayed dormant, and coins that suddenly wake after years can mark important turning points.
Tools and their limits
Platforms such as Glassnode and Nansen package raw chain data into readable charts and labelled wallets, making analysis accessible without running your own node. But on-chain data has real limits. It cannot see off-chain trades on exchanges, it can be distorted by internal transfers and wash trading, and a single metric in isolation is easy to misread. On-chain analysis is strongest as a weight of evidence, cross-checked across several metrics and combined with other context.
The bottom line
On-chain analysis turns a public ledger into insight: activity metrics gauge real usage, valuation metrics hint at over- or under-pricing, and flow and cohort data reveal what holders are actually doing. It is a powerful complement to price and news, but it is interpretive, not predictive, and easy to abuse when cherry-picked. Used carefully and in combination, it is one of the clearest advantages that transparent blockchains give the diligent observer.
Disclaimer: This article is educational content from Bitbase Academy, provided for informational purposes only. It is not investment, trading, tax, or financial advice. Written as of July 2026; rely on the latest official information.
References
[1] Glassnode Academy, "Introduction to on-chain analysis" glassnode.com
[2] Coinbase, "What is on-chain data?" coinbase.com