The order book looks like a wall of scrolling numbers, but it holds a clear picture once you know how to read it. Market depth shows where buyers and sellers are stacked, the depth chart draws that visually, and a heatmap adds a view over time. Learn these and you can see support, resistance, and liquidity that a plain price chart hides. Here is how to read market depth and the order book heatmap.
Best bid, best offer, and top of book
At the center of every order book are two prices. The best bid is the highest price any buyer is currently willing to pay; the best offer, or ask, is the lowest price any seller will accept. Together they are the top of book, and the gap between them is the spread. Every market order trades against the top of book first, so these two numbers are the live price you actually get right now.
Reading the depth chart
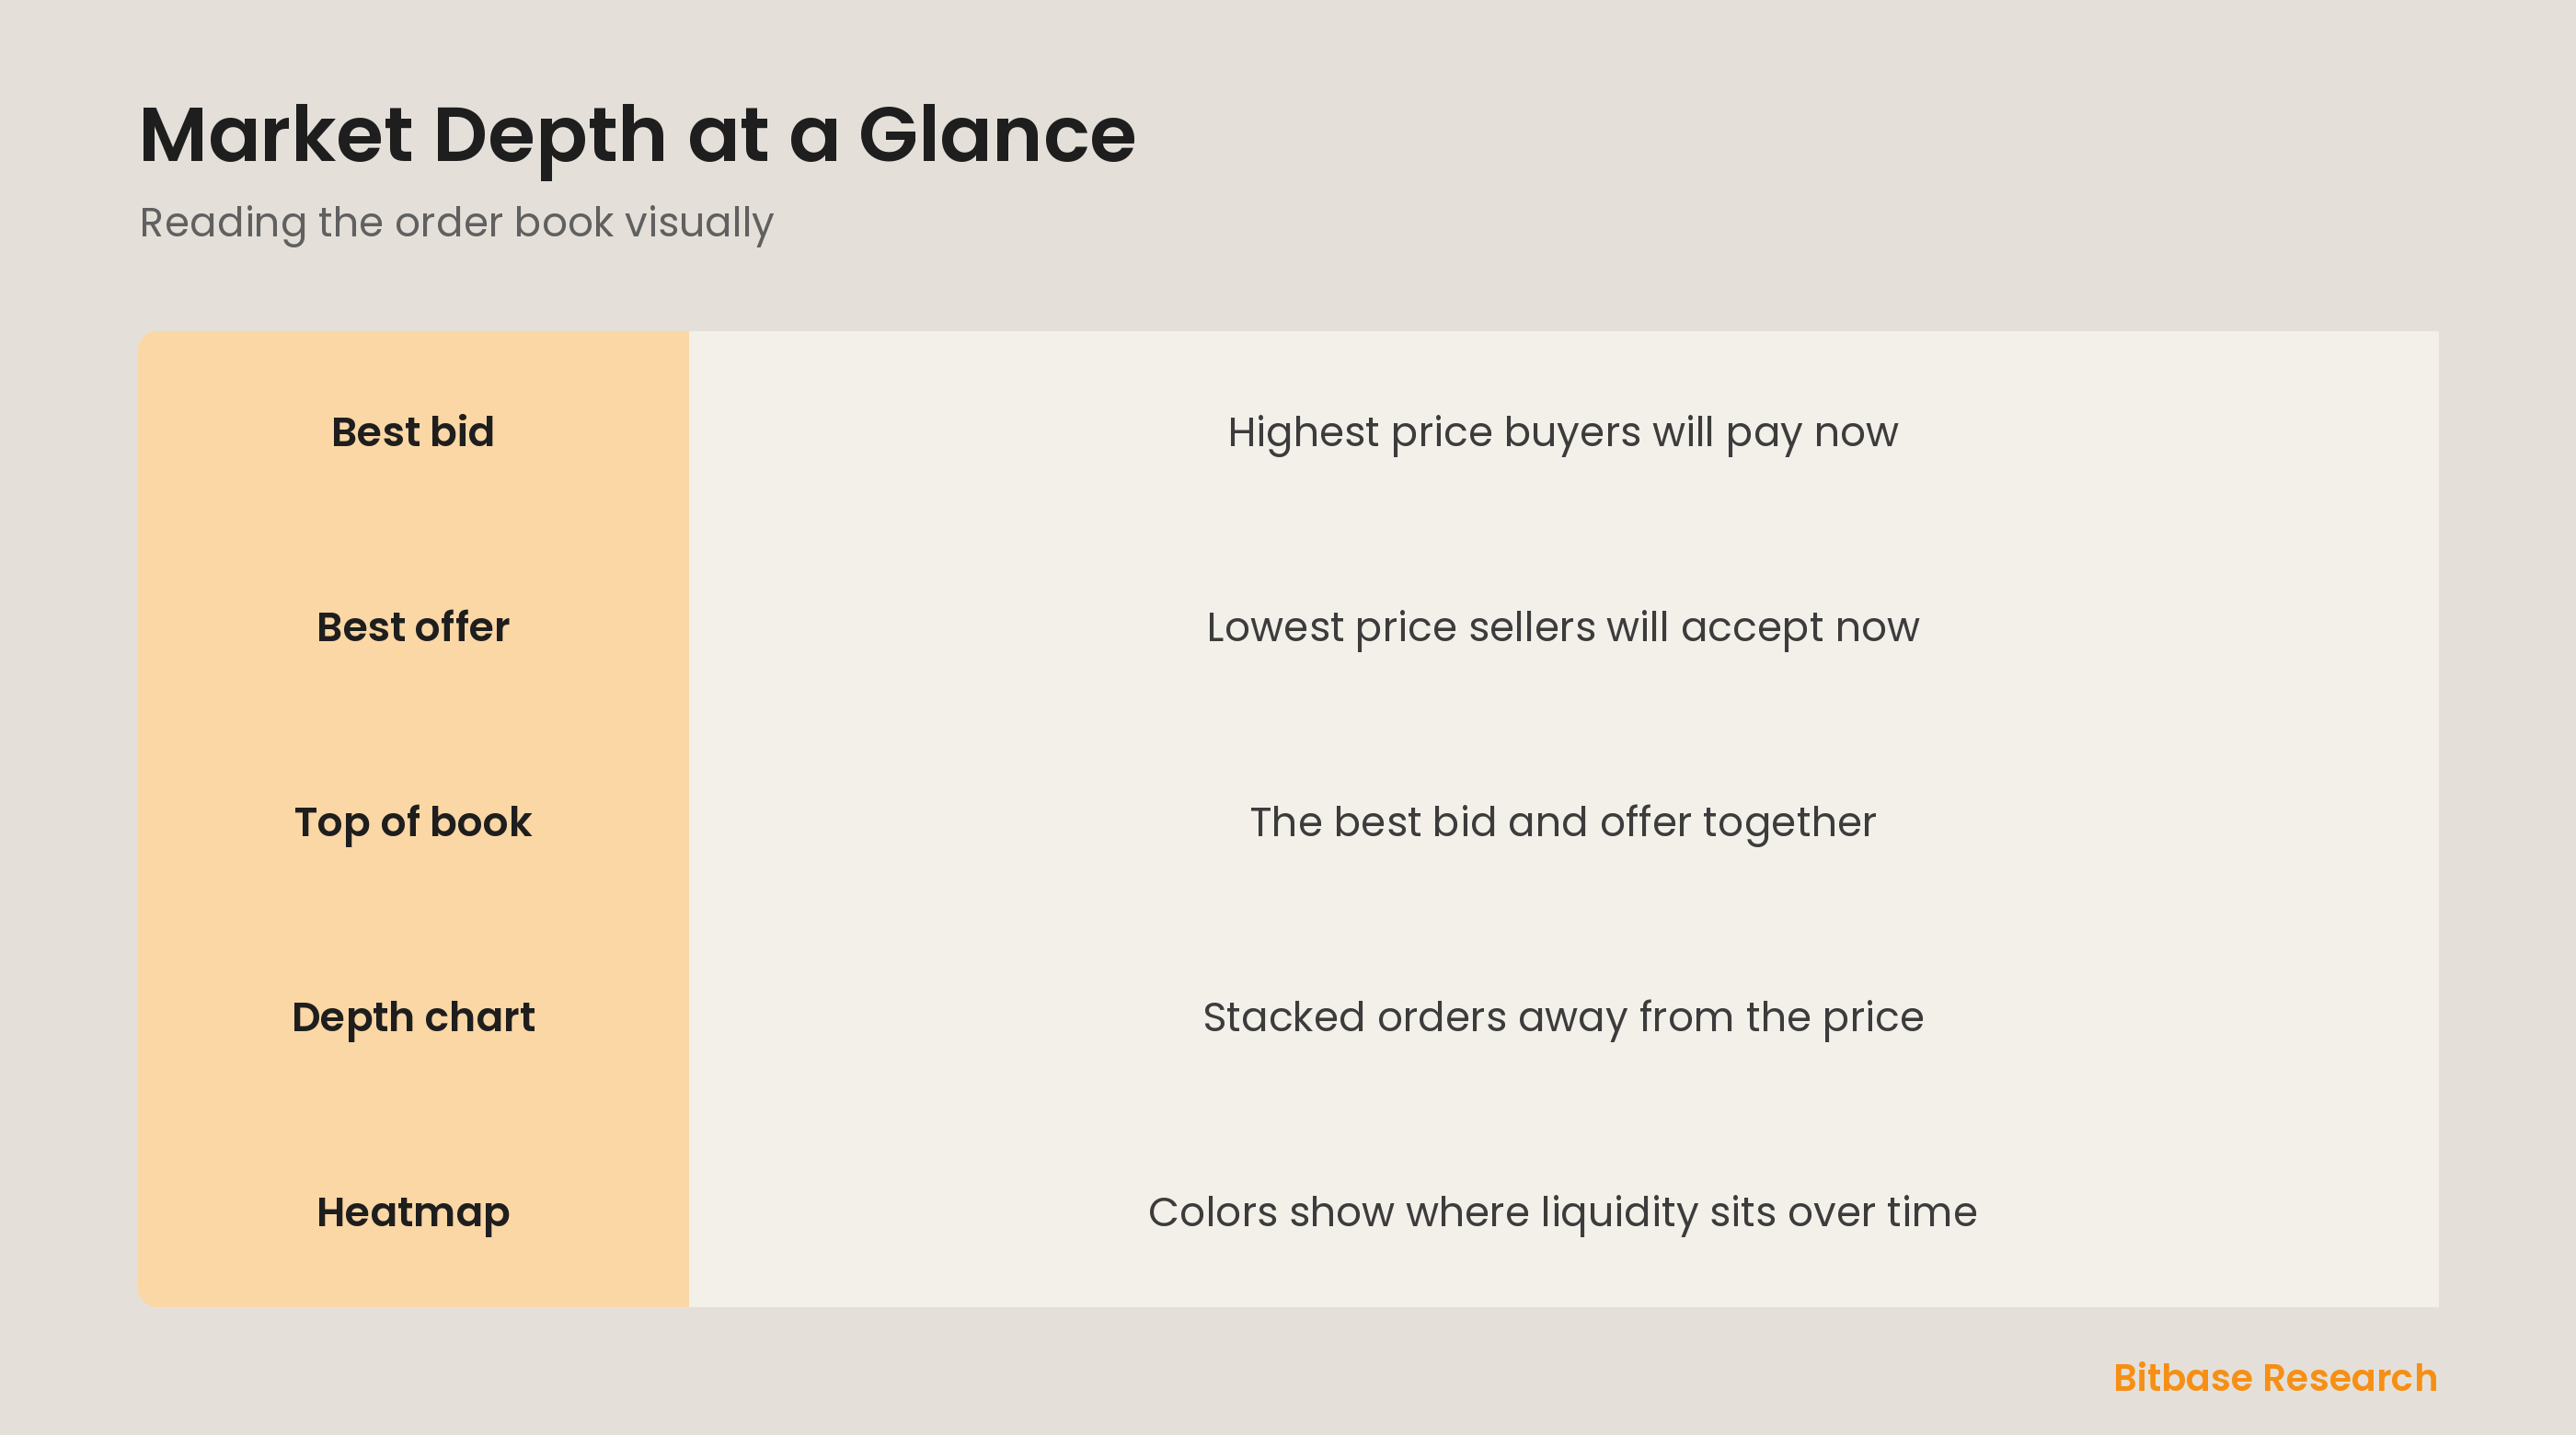
Behind the top of book, more orders wait at prices further away, and the depth chart draws them as two stacked curves: buy orders below the price, sell orders above. The steeper and taller the curve, the more liquidity sits at those levels. A large step in the curve marks a price where a big cluster of orders would need to be absorbed before the price could move past it, which often acts like support or resistance.
What the heatmap adds
A depth chart is a snapshot; a heatmap adds time. It plots price on one axis and time on the other, using color intensity to show how much resting liquidity sat at each price. Bright bands reveal levels where large orders have persisted, and you can watch them appear, hold, or vanish as the market approaches. The heatmap turns the order book into a moving map of where liquidity has been building or pulling away.
Deep versus thin liquidity
Reading depth tells you how easily the market absorbs orders. A deep book has plenty of orders stacked close to the price, so trades fill with little slippage and the price is stable. A thin book has sparse orders, so even a modest trade can move the price sharply. Before trading size, glance at the depth: deep liquidity means smooth fills, thin liquidity warns you to trade smaller or more carefully.
The bottom line
Market depth is the order book made readable: the best bid and offer form the top of book and the live price, the depth chart shows how orders stack away from it, and a heatmap reveals where liquidity has sat over time. Deep books absorb trades smoothly while thin ones move on little volume. Reading these gives you a view of support, resistance, and slippage that price alone never shows. To keep learning the fundamentals, follow more from Bitbase Academy.
Disclaimer: This article is educational content from Bitbase Academy, provided for information only. It does not constitute investment, trading, tax, or financial advice. Crypto assets are volatile; assess your own risk. Written as of June 2026; refer to the latest official information.
References
[1] Investopedia, "Order Book: Definition, How It Works, and Key Parts" investopedia.com
[2] Investopedia, "Depth of Market (DOM): Definition and How It Is Used" investopedia.com
[3] Investopedia, "Bid-Ask Spread: Definition, Meaning, and How It Works" investopedia.com