
Some of the most intuitive reversal patterns are the double top and double bottom, which form when price tries and fails twice to break through a level. Their shapes, an M at a top and a W at a bottom, are easy to recognize and tell a simple story: the market tested a barrier, failed, and gave up. Here is how double tops and bottoms form, what confirms them, and why the second failed attempt matters.
The double top
A double top forms at the end of an uptrend when price rallies to a high, pulls back, then rallies again to roughly the same high but fails to break above it, forming two peaks at a similar level. The shape looks like the letter M. The story is that buyers pushed price to a resistance level, could not break through, tried a second time, and failed again, showing the uptrend has met a wall it cannot climb, hinting at a reversal down.
The double bottom
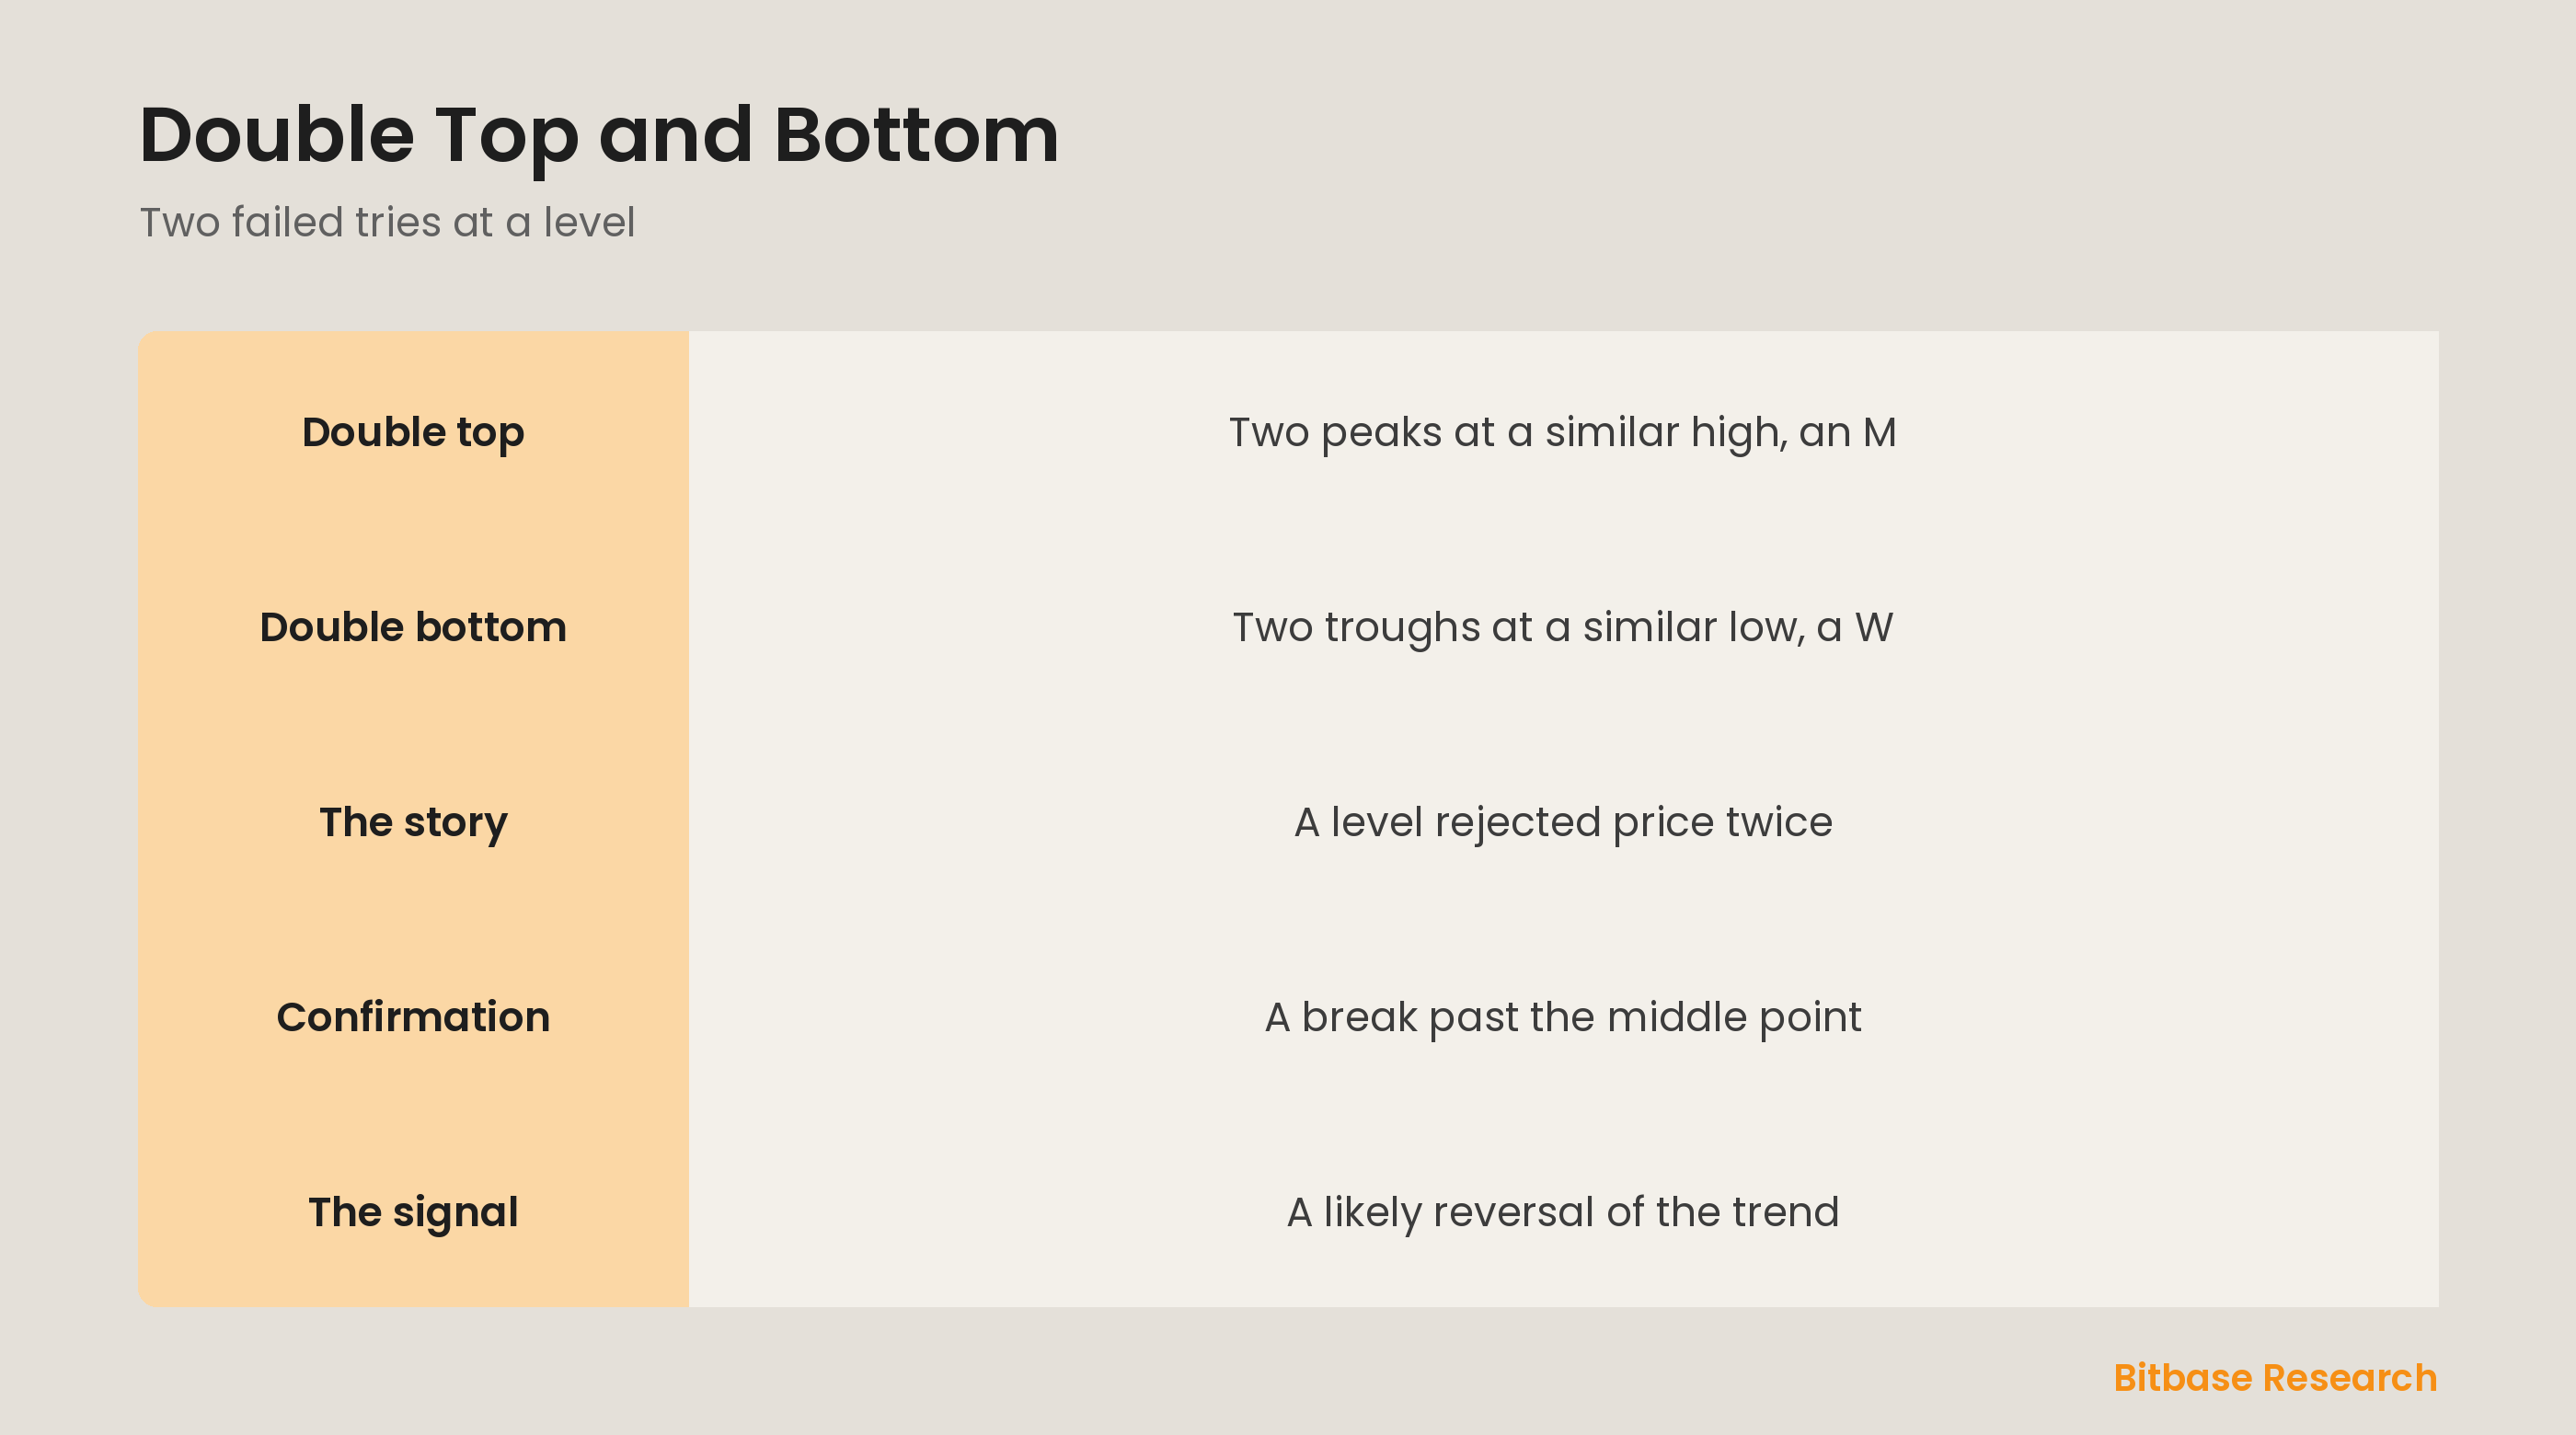
A double bottom is the mirror image, forming at the end of a downtrend. Price falls to a low, bounces, then falls again to roughly the same low but holds, forming two troughs at a similar level, a shape like the letter W. The story is that sellers drove price to a support level, could not break below, tried again, and failed, showing the downtrend has hit a floor it cannot break, hinting at a reversal up.
Why the second attempt matters
The power of these patterns is in the failed retest. The first peak or trough establishes a level; the second attempt is the market testing whether that level still holds. When price reaches the same level again and fails to push through, it confirms that the barrier is strong and the trend behind it is losing force. Two failures at the same price are far more meaningful than one, which is what gives the double top and bottom their weight as reversal signals.
Confirmation
Like other patterns, a double top or bottom is only a possibility until confirmed. Confirmation comes when price breaks past the pattern's midpoint, the low between the two peaks of a double top, or the high between the two troughs of a double bottom. Until that break, the pattern could still fail and the trend resume. Waiting for the break through this level, ideally on volume, is what turns the shape from a guess into a validated reversal signal.
The bottom line
A double top forms when price fails twice at a similar high, making an M shape at the end of an uptrend, while a double bottom forms when price holds twice at a similar low, making a W at the end of a downtrend. The two failed attempts at the same level are what signal the trend is losing force. The pattern is confirmed only when price breaks past its midpoint, ideally on volume, marking a likely reversal. To keep learning the fundamentals, follow more from Bitbase Academy.
Disclaimer: This article is educational content from Bitbase Academy, provided for information only. It does not constitute investment, trading, tax, or financial advice. Crypto assets are volatile; assess your own risk. Written as of June 2026; refer to the latest official information.
References
[1] Investopedia, "Double Top: Definition, Patterns, and Use in Trading" investopedia.com
[2] Investopedia, "Double Bottom Pattern: What It Is and How To Trade It" investopedia.com
[3] Investopedia, "Trend: Definition, Types, Examples, and Uses in Trading" investopedia.com