
The same chart can look bullish on one timeframe and bearish on another, which confuses beginners until they understand what a timeframe actually is. It is simply how much time each candle represents, and switching it is like zooming a camera in or out on the very same market. Learning to read multiple timeframes together is one of the biggest upgrades to how you see a chart. Here is how timeframes work and how to combine them.
What a timeframe is
A timeframe is the amount of time each candle on the chart covers. On a one-hour timeframe, every candle summarizes one hour of trading; on a daily timeframe, each candle is a whole day. Changing the timeframe does not change the market, only how zoomed in your view of it is. A lower timeframe zooms in to show fine detail, and a higher timeframe zooms out to show the broad picture, both of the exact same price history.
Higher versus lower timeframes
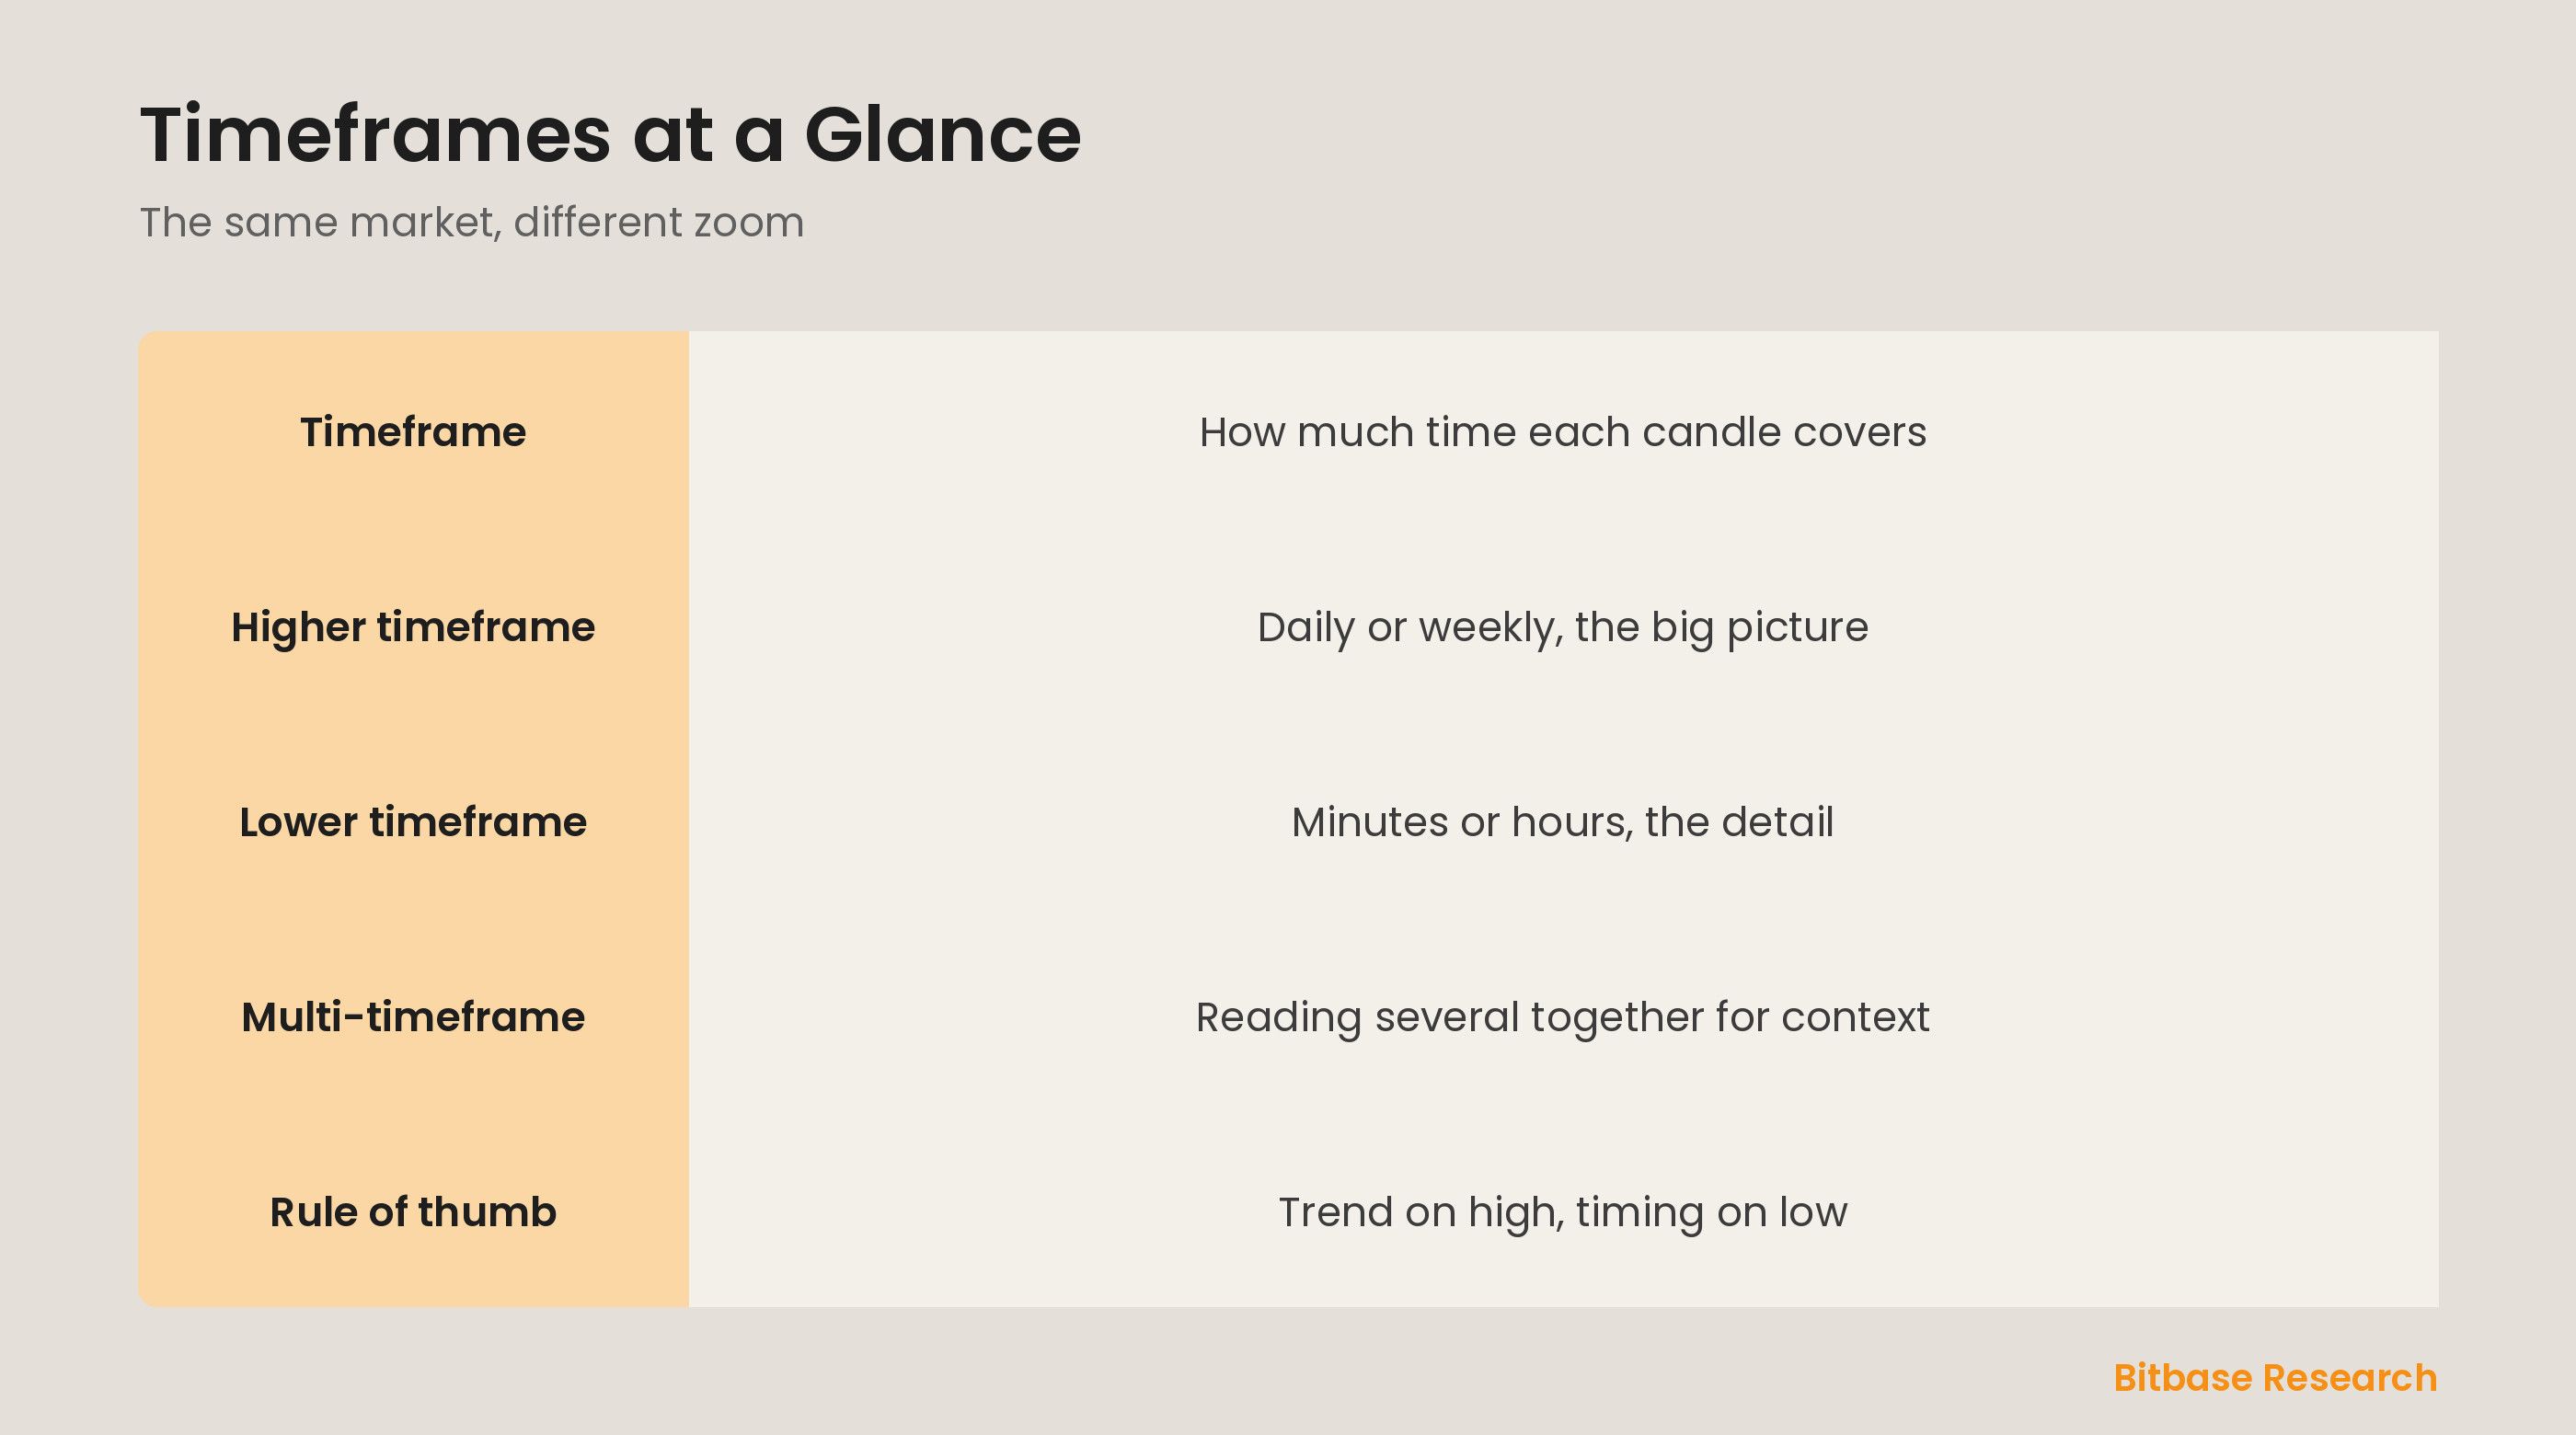
Higher timeframes, like the daily or weekly, show the big picture: the major trend, the important support and resistance, the moves that matter over weeks and months. Lower timeframes, like the five-minute or one-hour, show the detail: the smaller swings and the precise moments price turns. Higher timeframes are slower and more reliable but less precise for timing; lower ones are noisier but sharper for entries. Neither is better; they answer different questions.
Why one timeframe misleads
Looking at only one timeframe is like judging a journey from a single photo. A lower timeframe might show a sharp rally that looks powerful, while the higher timeframe reveals it is just a small bounce inside a large downtrend. Or a scary drop on the daily might be a routine pullback on the weekly. Relying on a single timeframe repeatedly traps traders into fighting the larger trend or mistaking noise for a real move.
Multi-timeframe analysis
Multi-timeframe analysis means reading two or three timeframes together so each gives context to the others. A common approach is to identify the main trend on a higher timeframe, then drop to a lower one to time an entry in that trend's direction. The higher timeframe tells you which way to lean; the lower one tells you when to act. Combining them keeps you aligned with the big picture while still being precise, the best of both views.
The bottom line
A timeframe is simply how much time each candle covers, so switching it zooms your view of the same market in or out. Higher timeframes show the major trend and key levels; lower ones show detail and precise turns. Reading only one can mislead you, making noise look like a trend or hiding the bigger move. Multi-timeframe analysis, using a higher timeframe for direction and a lower one for timing, gives you both context and precision. To keep learning the fundamentals, follow more from Bitbase Academy.
Disclaimer: This article is educational content from Bitbase Academy, provided for information only. It does not constitute investment, trading, tax, or financial advice. Crypto assets are volatile; assess your own risk. Written as of June 2026; refer to the latest official information.
References
[1] Investopedia, "Technical Analysis: What It Is and How to Use It" investopedia.com
[2] Investopedia, "Trend: Definition, Types, Examples, and Uses in Trading" investopedia.com
[3] Investopedia, "Price Action: What It Is and How Stock Traders Use It" investopedia.com