Candlesticks are the language most traders read the market in, and once you understand a single candle, a whole chart of them opens up. Each candle is a compact picture of four prices over one slice of time, packed into a shape you can read at a glance. It tells you not just where the price ended but the whole story of the fight between buyers and sellers in that period. Here is how to read one.
The four prices in a candle
Every candlestick summarizes one period, whether a minute or a day, using four prices. The open is where price started the period, the close is where it ended, the high is the most it reached, and the low is the least. These four numbers, open, high, low, and close, are everything a candle contains. The whole art of reading candles is seeing those four prices instantly in the candle's shape rather than reading them off a table.
Body and wicks
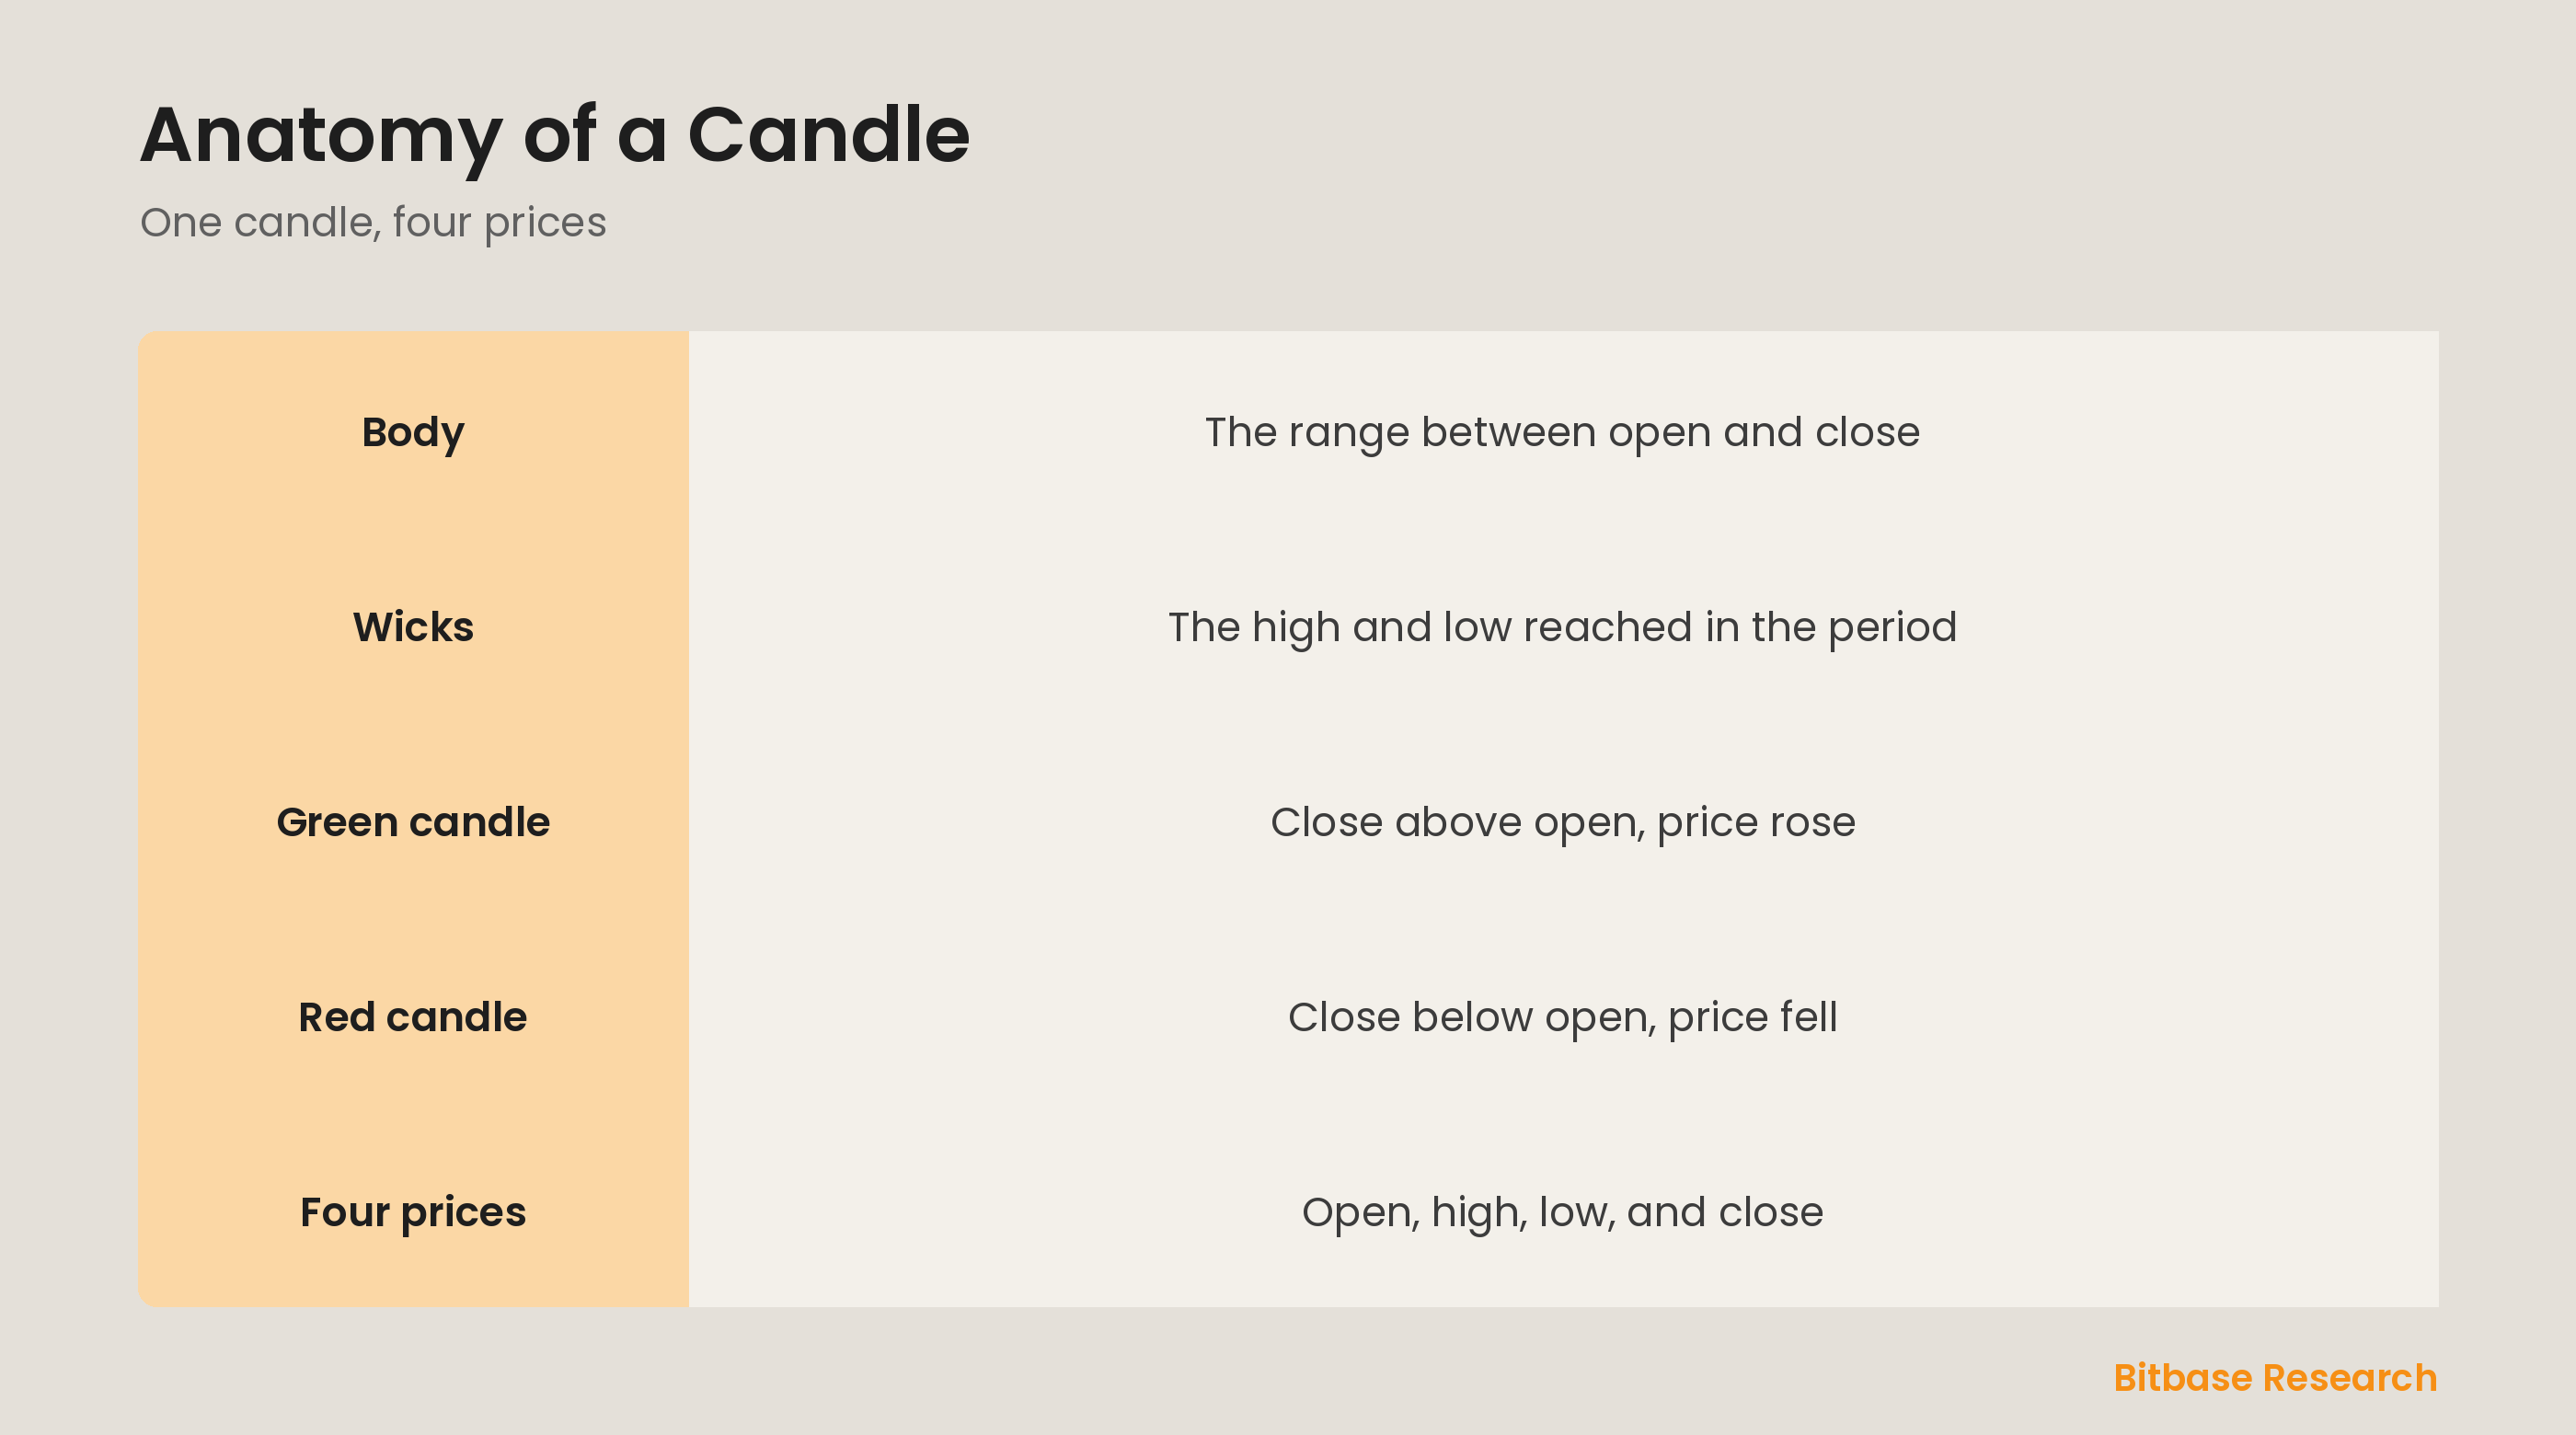
A candle has a thick body and thin lines called wicks or shadows above and below it. The body spans the open and the close, the two prices that bookend the period. The wicks reach up to the high and down to the low, showing the extremes price touched before settling. A long body means price moved decisively from open to close; long wicks mean price ranged far but came back, hinting at a struggle between buyers and sellers.
Green versus red candles
Color tells you direction at a glance. A green, or often hollow, candle means the close was higher than the open, so price rose over the period and buyers won. A red, or filled, candle means the close was lower than the open, so price fell and sellers won. The color and the body length together give you an instant read: a long green candle is strong buying, a long red one strong selling, and small bodies mean indecision.
Why candles beat a plain line
A line chart shows only the close, so it hides how price got there. Candles show the full journey of each period, the high and low as well as the open and close, which is far richer. That extra detail is why traders rely on candles: it reveals things a line cannot, such as a period that spiked hard then reversed, or a quiet range. Reading price action, the raw behavior of price, starts with reading candles.
The bottom line
A candlestick packs four prices, open, high, low, and close, into one readable shape. The body spans the open and close, and the wicks reach to the high and low, so the candle shows the full range of a period, not just its endpoint. A green candle closed above its open and a red one below, telling direction at a glance. That is why candlesticks, richer than a plain line, are how most traders read the market. To keep learning the fundamentals, follow more from Bitbase Academy.
Disclaimer: This article is educational content from Bitbase Academy, provided for information only. It does not constitute investment, trading, tax, or financial advice. Crypto assets are volatile; assess your own risk. Written as of June 2026; refer to the latest official information.
References
[1] Investopedia, "Candlestick: What It Is, What It Tells Investors" investopedia.com
[2] Investopedia, "OHLC Chart: Definition, Uses, How to Read" investopedia.com
[3] Investopedia, "Price Action: What It Is and How Stock Traders Use It" investopedia.com