Most indicators try to tell you which way price is going. The ATR does something different and quietly essential: it measures how much price is moving, regardless of direction. Knowing whether a market is calm or wild is crucial for setting stops, sizing positions, and judging risk. The ATR, or average true range, turns that into a simple number. Here is what the ATR measures and why it is one of the most practical tools around.
What the ATR measures
The ATR, or average true range, measures volatility, the size of price movements, without regard to direction. A high ATR means price has been moving in large swings, a volatile market; a low ATR means it has been moving in small increments, a calm one. It does not tell you whether price is going up or down, only how far it tends to travel in a given period. That makes it a pure gauge of how active a market is.
What true range is
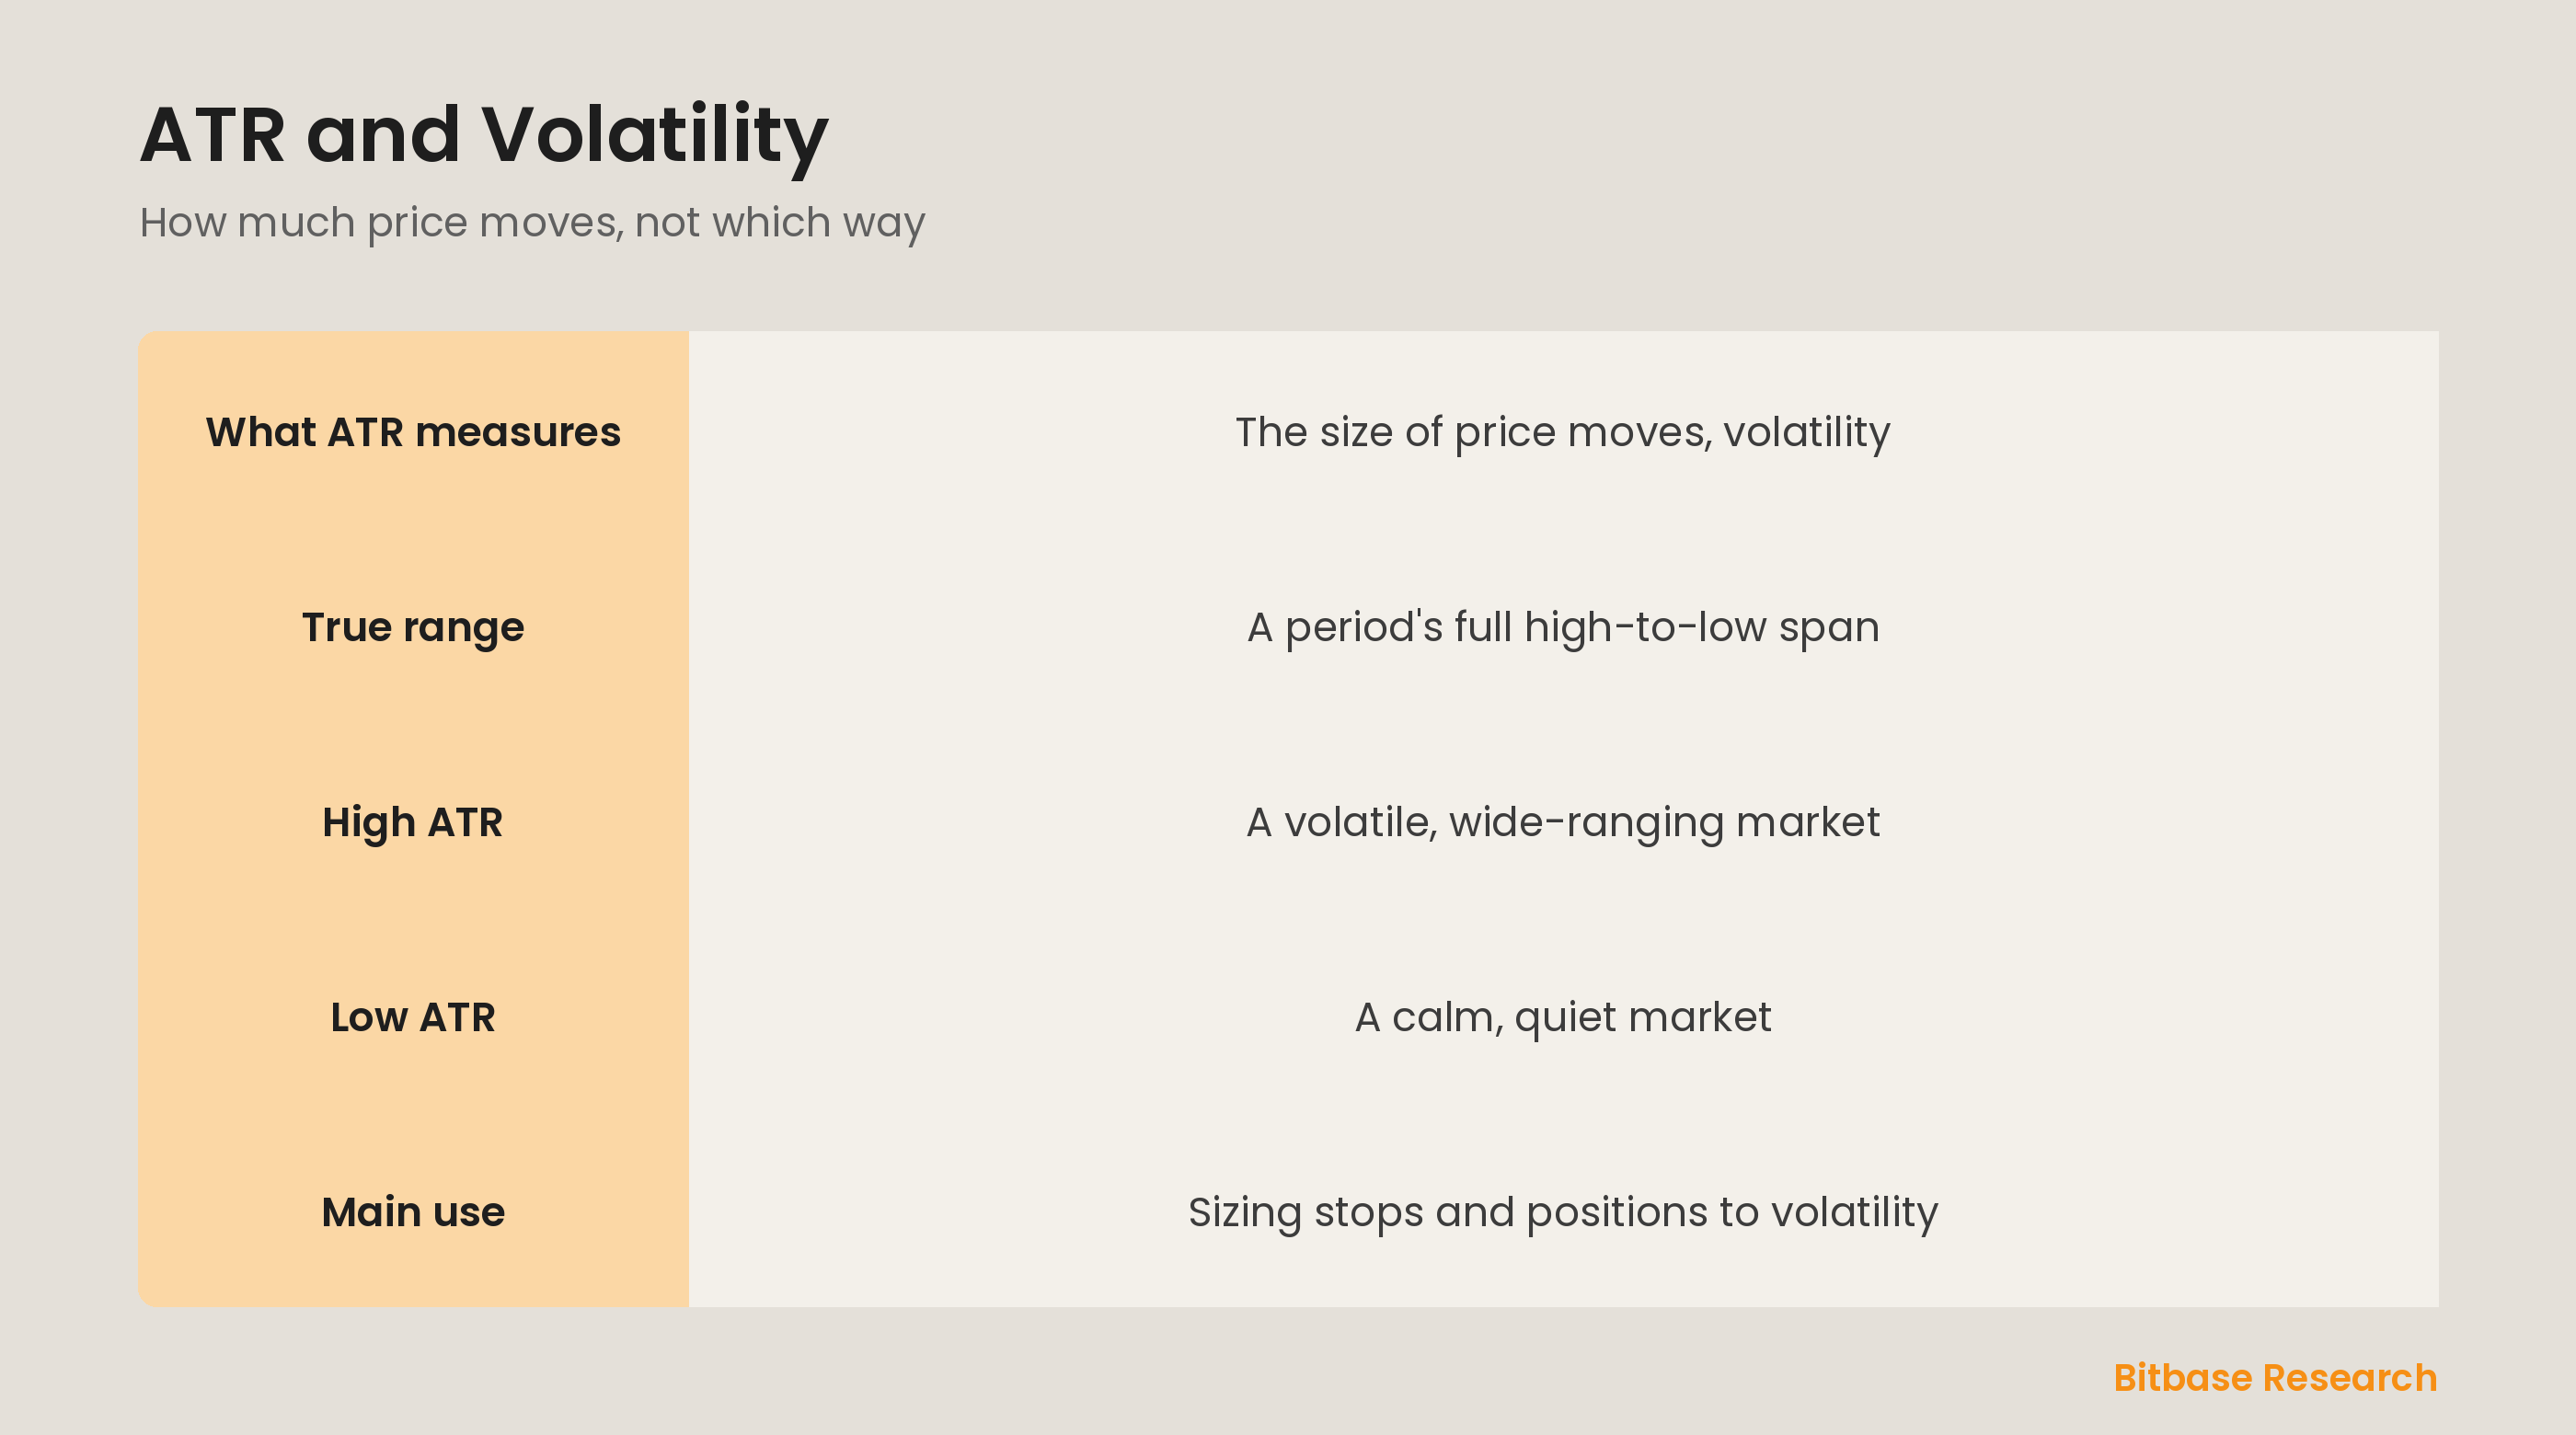
The ATR is built from the true range of each period. True range is the full extent of a period's movement, measured as the largest of three spans: the current high to low, or the distance from the prior close to the current high or low. This captures the whole move including any gap from the previous close, which a simple high-minus-low can miss. The ATR is then just an average of true range over recent periods, smoothing it into one figure.
Reading ATR levels
The ATR is read in the price units of the asset, not on a fixed 0 to 100 scale, so what counts as high or low is relative to the market and its price. What matters is the trend and comparison: a rising ATR means volatility is increasing and the market is getting more active, while a falling ATR means it is calming down. Comparing the current ATR to its recent range tells you whether conditions are unusually turbulent or quiet right now.
Using ATR for stops and sizing
The ATR's most practical use is risk management. Because it measures how much price typically moves, it helps you set stops at a sensible distance: a stop placed too tight for a volatile market gets hit by normal noise, while one scaled to the ATR gives the trade room to breathe. The ATR also guides position sizing, letting you take smaller positions when volatility is high and larger ones when it is low, so your risk stays consistent.
The bottom line
The ATR, or average true range, measures volatility, how much price moves, not its direction, by averaging the true range of recent periods, which captures each period's full span including gaps. A high ATR means a volatile market and a low ATR a calm one, read relative to the asset rather than a fixed scale. Its most practical use is risk management, sizing stops and positions to the market's volatility so your risk stays steady. To keep learning the fundamentals, follow more from Bitbase Academy.
Disclaimer: This article is educational content from Bitbase Academy, provided for information only. It does not constitute investment, trading, tax, or financial advice. Crypto assets are volatile; assess your own risk. Written as of June 2026; refer to the latest official information.
References
[1] Investopedia, "Average True Range (ATR): Definition and Formula" investopedia.com
[2] Investopedia, "Volatility: Meaning in Finance and How It Works" investopedia.com
[3] Investopedia, "Technical Analysis: What It Is and How to Use It" investopedia.com