Most indicators tell you which way price is going, but the ADX answers a different and equally important question: how strong is the trend? Knowing a market is trending strongly, or barely trending at all, changes which strategies make sense. The ADX is designed to measure exactly that, and paired with its companion DI lines, it becomes a complete picture. Here is what the ADX shows and how to read trend strength.
What the ADX measures
The ADX, or Average Directional Index, measures the strength of a trend, not its direction. It produces a single line, usually scaled from 0 to 100, where higher values mean a stronger trend and lower values mean a weaker one. Crucially, the ADX does not care whether price is going up or down; a powerful uptrend and a powerful downtrend both produce a high ADX. It answers only how forceful the move is, leaving direction to other tools.
Reading the ADX level
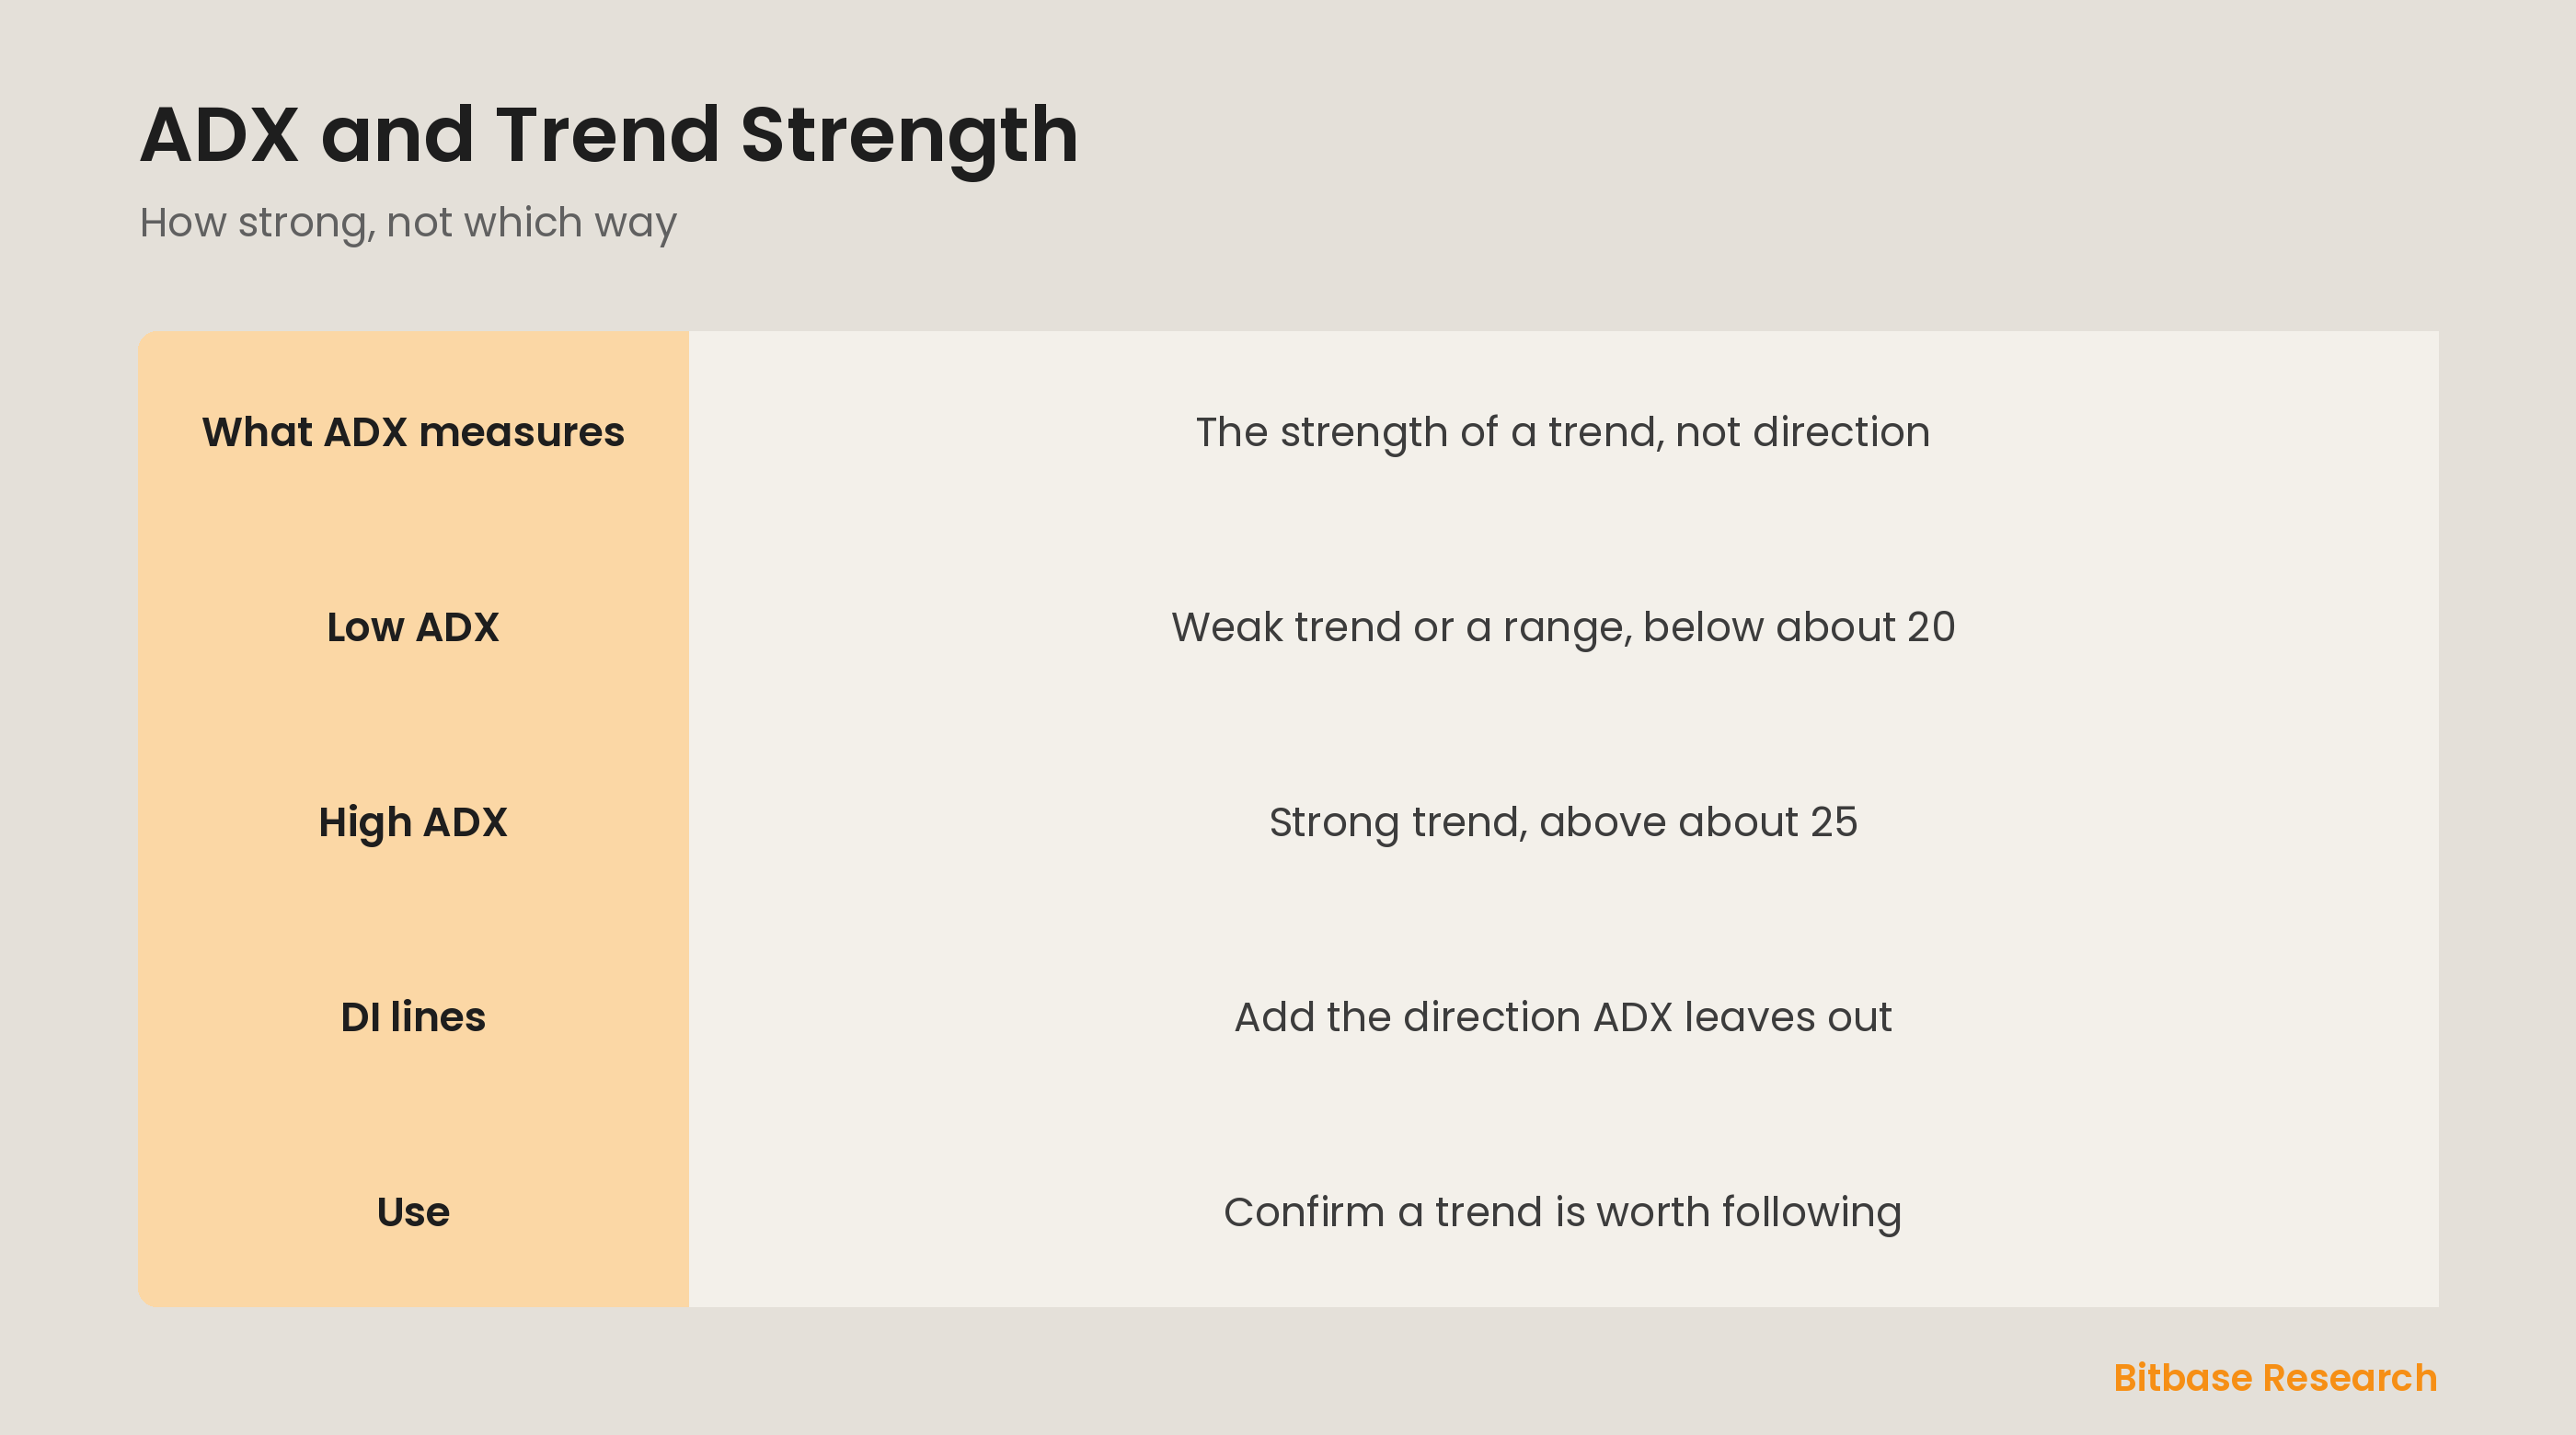
The ADX is read by its level. As a rough guide, a reading below about 20 suggests a weak trend or a directionless, ranging market where trend-following strategies struggle. A reading above about 25 suggests a strong, established trend worth following, and the higher it climbs, the stronger the trend. A rising ADX means the trend is gaining strength; a falling one means it is weakening, even if price is still moving in the same direction.
The DI lines add direction
Because the ADX ignores direction, it usually comes with two companion lines: the plus DI and minus DI, which measure upward and downward directional movement. When the plus DI is above the minus DI, buyers are in control and the trend is up; when the minus DI is on top, sellers dominate and the trend is down. Together, the DI lines tell you the direction while the ADX tells you the strength, completing the picture.
How traders use it
The ADX is most useful as a filter. Trend-following strategies, like trading crossovers or breakouts, tend to work when the ADX is high and fail when it is low and the market is chopping sideways. So many traders check the ADX first: if it is strong, they trust trend signals; if it is weak, they either stand aside or switch to range strategies. Used this way, the ADX keeps you from fighting a market that has no real trend.
The bottom line
The ADX measures how strong a trend is, not its direction, on a scale where low readings, below about 20, mean a weak or ranging market and high readings, above about 25, mean a strong trend. The plus and minus DI lines add the direction the ADX leaves out. Traders use the ADX as a filter, trusting trend signals when it is high and stepping aside when it is low, so they follow real trends and avoid choppy ones. To keep learning the fundamentals, follow more from Bitbase Academy.
Disclaimer: This article is educational content from Bitbase Academy, provided for information only. It does not constitute investment, trading, tax, or financial advice. Crypto assets are volatile; assess your own risk. Written as of June 2026; refer to the latest official information.
References
[1] Investopedia, "Average Directional Index (ADX): Definition and Formula" investopedia.com
[2] Investopedia, "Directional Movement Index (DMI): What It Is, Calculation" investopedia.com
[3] Investopedia, "Trend: Definition, Types, Examples, and Uses in Trading" investopedia.com